Abstract
This document suggests standards for the acquisition, measurement, and reporting of radiofrequency data analysis (virtual histology – VH) intravascular ultrasound (IVUS) studies. Readers should view this document as the authors’ best attempt in an area of rapidly evolving investigation, an area where rigorous evidence is not yet available or widely accepted. Nevertheless, this document is based on known pathologic data as well as previously reported imaging data; where practical, this data is summarised in the current document, a document which will also include recommendations for future evolution of the technology.
Introduction
There is increasing attention in the possibility that recognition and treatment of high-risk plaques would improve the progress made against coronary artery disease. To address the former issue, innovations in invasive imaging techniques – i.e. intravascular radiofrequency data analysis for tissue composition (Virtual Histology™) – may help to better understand coronary atherosclerosis. Indeed, Virtual Histology (VH) can potentially detect thin-capped fibroatheromas (TCFAs). In addition, the progression of the disease can also be followed-up. The technique has been validated in vivo and ex vivo and its reproducibility tested in patients with encouraging results. Therefore, several studies in different contexts have been already reported in the literature. Furthermore, large natural history studies and randomised controlled trials are ongoing in which the technique is being used. Thus, there is a need to establish standards on acquisition guidelines, analysis, definitions and reporting.
Description of the technique
VH-IVUS is a technique that allows tissue characterisation of vascular lesions. It is based upon the spectral analysis of the raw backscattered ultrasound data that has been correlated with vascular tissue types determined from histology. Once the spectral signature of four tissue types (fibrous tissue, fibro-fatty tissue, necrotic core [NC], and dense calcium) are determined, these signatures are programmed into software, either on the IVUS console or stand-alone software packages, for the analysis of patient data.
Independent studies have demonstrated in vivo a relatively high level of accuracy and reproducibility of IVUS-VH in human arteries. The technique has been validated in vivo, utilising directional coronary atherectomy specimens1, yielding predictive accuracies of up to 95% in non-ACS patients. Recent ex vivo studies2 that validated VH images directly with the histopathology sections gave accuracies of up to 97%.
The reproducibility of the technology using same and different catheters has been studied using ex vivo IVUS pullbacks through excised human coronary arteries and in vivo from randomly selected patients undergoing elective percutaneous coronary intervention (PCI). No statistical differences were found between the pullbacks from the ex vivo or in vivo studies irrespective of whether the same or a different catheter was used3. VH is an IVUS based technology and as such is subject to the limitations of IVUS. The axial resolution of IVUS is approx 100µm and the lateral resolution is 250 µm. In addition, VH analyses data in blocks of 250 µm. Therefore, for example, detection of thin fibrous caps <65 µm in thickness, is below the resolution of the technology.
Screening and image acquisition
VH-IVUS is a technique that is specific to equipment and (as of this writing) solid-state IVUS catheters manufactured by Volcano (Rancho Cordova, CA, USA). VH-IVUS image acquisition requires ECG gating, and although the ECG is not recorded along with the VH-IVUS data, it is important to ensure that the ECG signal is generating only one frame per cardiac cycle (“R tops”). If there is no ECG recording (at this moment only detectable when acquired together with palpography), then the study should not be analysed.
Step by step procedure
In the past, Virtual Histology was acquired using the In-Vision Gold console and a 20 MHz Eagle Eye™ Gold catheter. Currently, the Volcano s5 Imaging System is used for the qualitative and quantitative evaluation of vascular morphology in the coronary arteries and vessels of the peripheral vasculature. One of its components, the Virtual Histology System, is intended to perform spectral analysis of RF ultrasound signals of vascular features during routine diagnostic ultrasound imaging examinations. Although two types of catheters can be used with this system, a 20 MHz electronic catheter or a 45 MHz mechanical catheter, the VH-IVUS for the 45 MHz is under development.
SYSTEM DESCRIPTION
The Volcano s5 system offers two options for IVUS acquisition: the s5 tower and the s5i (integrated) system.
The s5 tower – The hardware system consists of the system console that includes monitor a keyboard, and the patient interface module (PIM). The cabling connector at the PIM end allows for the PIM to be disconnected and replaced.
The s5i system – This system can be integrated into any of the available angiographic systems. The CPU is the heart of the s5i platform. The CPU can be located in different locations, such as in the control room, the patient exam room or in an equipment closet. The s5i control panel with a slide out keyboard can be mounted on a support bracket from a patient table DIN rail. It can also be placed on a table in the control room. A separate joystick option or a touch panel is available for the physician at the bedside if desired which will provide basic systems functions from the bedside.
GUIDELINES FOR ACQUISITION
It is worth mentioning that before IVUS is performed, administration of between 100 and 300 µg of intracoronary nitroglycerin is highly desirable in order to avoid spasm of the vessel and minimise ischaemia. Consider patient’s blood pressure before nitroglycerin is administered.
The detailed acquisition process is described in Table 1.
Because image acquisition is ECG-gated, while the pullback speed is constant, the number of frames/mm will vary with the heart rate. The higher the heart rate, the more data (number of frames per mm) is collected; the pullback speed should, ideally, be 0.5 mm/sec. At this pullback speed and depending on the heart rate, three to six image slices will be acquired per 1.5 mm segment.
Studies must be acquired using motorised catheter pullback. Manual pullback is unacceptable and should not be done when acquiring VH-IVUS data. Volcano manufactures two motorised pullback devices: TrackBack II and R-100. The TrackBack II device is not the most recommended for VH-IVUS image acquisition because of the absence of steady grasp of the catheter (related, in part, to the lubricious nature of the catheter shaft itself) and the weakness of roller movement causing the catheter to be withdrawn unevenly. The R-100 device is the best pullback device currently available for the solid-state IVUS catheter. When imaging single stents of known length, 80-85% of stents measured using the R-100 device were within 20% of known length compared to only 65-70% of stent measured using the TrackBack II device4. Third party motorised pullback devices require validation before being used for VH-IVUS acquisition. Currently, the Global VH Registry includes a combination of TrackBack II and R-100 acquired cases; IBIS-2 and PROSPECT studies used only the R-100 device. In general, pullbacks of the solid-state IVUS catheter appear to be less uniform in tortuous vessels, the left circumflex coronary artery, and in stented and calcified segments; therefore, consideration should be given to excluding tortuous or heavily calcified vessels.
Non-continuous image acquisition
During pullback, the catheter can stall or “stick” during image acquisition. In addition, typically when imaging very long lengths of the coronary artery, VH-IVUS data must be acquired in two overlapping segments because the length of the artery is greater than the capacity of the pullback device. Non-continuous or overlapping pullback sections should be deleted from the file, and the two residual ends stitched together electronically during image analysis. However, the cut-and-paste technique should be used only if there is one long segment of the pullback that is continuous (i.e. >10 mm) that contains clearly identifiable landmarks; no more than two segments can be joined together, and the cut-and-paste technique should not be used to extend the length of the analysis segment if there is a good, continuously imaged, 40 mm long segment that can be analysed. If the cut-and-paste technique is used, it is very important that the same (identical) landmarks (fiduciary points) at both ends of the reconstructed analysis segment be identified and used in the baseline and follow-up studies. It is equally important that the segment that is to be removed have its own identifiable proximal and distal fiduciary points. It is possible that the distribution of atherosclerosis will be skewed by the use of the cut-and-paste technique; therefore, this technique should not be used if the number of patients in the study is small. If cutting and pasting has taken placed during the process, this should be described in the methodology.
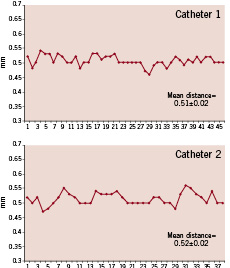
Figure 1. This patient was imaged in the same region with two different catheters during the same procedure. The graphs show all the frames acquired (x axis) and in the y axis the distance between them is given. Small variations in the intervals were observed.
ECG or zoom setting problems
Because VH-IVUS requires ECG-gating with one image slice per cardiac cycle, it is recommended that the software be modified so that at the time of recording and analysis, the ECG signal is clearly visible. It is essential that the ECG leads be connected to the patient such that a good ECG tracing is obtained and output to the IVUS system (Figure 2). The R wave must be at least 2X the amplitude of the T wave in order to ensure appropriate capture of data (the larger the “R” wave, the better).
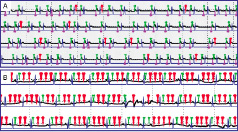
Figure 2. This figure shows the heart beats recorded during VH-IVUS acquisition (in this case palpography was also recorded simultaneously). In black, the ECG signal; in purple the “R” top marker; in green and red the acquired VH-IVUS frames. The blue line indicates the segmentation per heart beats based on the blood pressure signal (blood pressure curve not shown). In panel A, a quasi-normal ECG-gating acquisition is seen, the VH-IVUS frames (green markers) were constantly acquired throughout the pullback. Only few extra VH-IVUS non-”R”-top related were acquired (red markers). In panel B, due to a bad ECG signal the ECG gating was poor. This graph has been created by Frits Mastik at Erasmus Medical Center.
The zoom factor should NOT be changed during pullback. To ensure that the entire circumference of the artery is imaged throughout its length, the proximal part of the vessel should be imaged while inserting the catheter in order to set the zoom factor. Gain settings do not influence VH-IVUS data and analysis and can be adjusted during pullback. Eventually, segments with an inadequate ECG, incorrect triggering, or with the media “out of the image” are unreliable and should not be analysed.
Segment lengths
There is no upper limit to the length of artery that can be assessed using VH-IVUS. It is limited only by the memory (or hard disk space) of the instrument and the capacity of the pullback device.
Scrambling of image slices
Scrambling of the image slices occurs because of antegrade / retrograde motion of the transducer during systole and diastole. In sheath-based, mechanical IVUS catheters, this averages 1.5 mm (range 0.5 to 5.5 mm)5. For this reason (as well as because of pullback issues), the following is recommended.
Up to three consecutive scramble slices should be deleted from the file (“ignored frame”), and the two residual ends stitched together electronically during image analysis. To this end, clear anatomical landmarks, such as side-branches, must be taken into account to recognise the scramble frames.
Vessel-specific limitations
It is often difficult to image the very proximal segment of the RCA because the guiding catheter is in the ostium. Even the conus branch is frequently covered by the guiding catheter. One option is to disengage the guiding catheter, taking care not to introduce too much tension into the coaxial system. Another option is to use a distal side-branch as the primary, fiduciary landmark. The priority for the fiduciary point when imaging the RCA should be the aorto-ostial junction, then the conus branch or a proximal atrial branch, and finally a distal side branch.
A similar problem exists when imaging the left main (LM). However, it is easier to disengage the guiding catheter from the LM while maintaining catheter stability. It is recommended that the LAD or LCX be imaged first and then the guiding catheter disengaged to image the LM. The carina is the most recommended fiduciary point.
Contours
There are only two reproducible borders (contours) in non-stented arteries: the external elastic membrane (EEM) and the lumen. Once the borders are traced, there will be a VH-IVUS classification of all structures within this region of interest. Therefore, accurate contour detection is critical. While there is a “flare” (ring down artefact) around the catheter, the lumen contour must be drawn away from this flare (Figure 3).
On the current VH-IVUS display, the grey contour representing the media can occupy up to 40% of the plaque area, although this area can be subtracted to obtain only the VH-IVUS plaque and its four tissue types; it was built into the display as a landmark denoted the outer edge of the vessel. Histologically, the “normal” media is 250 microns thick, but it is frequently destroyed during various pathologic processes including atherosclerosis. Media thickness cannot be measured using either greyscale or VH-IVUS imaging. Because 1) media thickness is variable, 2) the contours for greyscale IVUS, VH-IVUS, and other derived techniques such as palpography should be the same, and 3) the plaque cross-sectional area measured by greyscale IVUS, VH-IVUS, and other derived technologies should also be the same. New software modifications will allow the display with or without the grey contour for media.
Side branches
Cross-sectional image slices containing a side-branch should not be ignored or deleted from the VH-IVUS analysis (unless the side-branch opening is > 90 degrees). Nevertheless, because side-branch containing cross-sections do not display the artery as a “circle,” some rules are necessary for defining the contours of the EEM and lumen 1) The EEM contour should be interpolated as to follow the pre- and post-side branch frames EEM morphology. 2) The lumen contour should be drawn just beyond the EEM contour to avoid computation of tissue types and to create in the VH-IVUS images an empty area indicating the position of the side-branch (Figure 3).
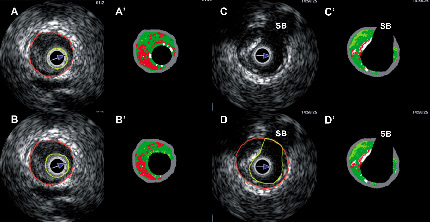
Figure 3. Panels A and A’ show that the lumen border was drawn halfway into the flare (ring down artefact) of the catheter (yellow circle), in the VH frame this was misclassified as dense calcium. Panels B and B’ show the recommended approach to draw the lumen border, away from the flare of the catheter. Panels C and D show the proposed method to draw the contours at side-branches. Luminal contour (yellow line) should be drawn just beyond the vessel contour, so that in the VH-IVUS this appears as an empty space. SB, side-branch.
Thrombus
Currently, there is no VH-IVUS classification for thrombus. It is not clear when or if such a classification will emerge because thrombi evolve and develop over time so that a single classification for thrombus may never be possible. Work is ongoing for identification of fresh thrombus; however, identification of late thrombus appears to be more difficult. With higher frequency greyscale IVUS, the real-time, continuously changing appearance of a clot during imaging is a useful criterion for the presence of a thrombus. However, even with 40/45 MHz transducers, the sensitivity/specificity of detecting thrombus is low6; and with 20 MHz and ECG gating used for VH-IVUS, temporal resolution is lost along with many of the subjective criteria of thrombus. Thrombus is misclassified as fibrous or fibrofatty by VH-IVUS7. However, it is advisable that the luminal border should be drawn to include the thrombus as part of the plaque for the following reasons (Figure 4): 1) there is no consistent border between thrombus and plaque that would clearly separate thrombus from plaque and allow quantification of just the plaque. 2) Thrombus is a moving target, changing with age. 3) Mural and intramural thrombus is even more difficult to detect than intraluminal thrombus and impossible to quantify. 4) Lumen dimensions (and, therefore, stenosis severity) are affected by the presence of thrombus. 5) When/if a classification for thrombus is developed, it will only be necessary to reprocess the images, not to redraw the lumen contours. However, it is recommended that lesions suspected of containing thrombus be flagged for future study and reanalysis.
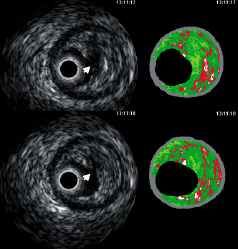
Figure 4. Two consecutive frames showing a ruptured plaque in a patient with an acute coronary syndrome. The luminal contour (not shown to allow visualisation of the discontinuity area of plaque surface) should be drawn including the cavity (white arrow) in the analysis.
Pathological plaque characteristics
Plaque rupture
Based on post-mortem studies, there are three main causes of thrombosis in atherosclerotic coronaries. The most frequent cause of thrombosis is plaque rupture, which in the coronary arteries accounts for 65 to 70% of cases dying suddenly, plaque erosion accounts for 30 to 35% of cases and calcified nodule for another 2 to 5%.
The rupture of a thin fibrous cap over a necrotic core is the most common underlying mechanism of atherothrombosis8. Although pathologic features that predict plaque rupture are elusive, increasing size of the necrotic core, decreasing thickness of the cap, intraplaque haemorrhage, and concentration of macrophages within the cap are associated with plaque instability. As the plaque ruptures, the exposure of the tissue factor to flowing blood results in activation of the coagulation cascade with formation of a platelet-rich thrombus (Figure 5).
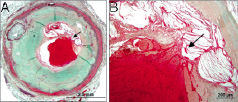
Figure 5. Coronary plaque rupture with overlying luminal thrombus. A shows the area of the thrombus and rupture site (arrow) and B shows the site of rupture (arrow) with the overlying thrombus at higher magnification.
In smaller calibre arteries such as the coronaries, the plaque rupture results in luminal thrombus but the necrotic core contents tend not to embolize distally; the core contents (free cholesterol crystals, cellular debris) intermingle with red cells, fibrin and platelets. The platelet thrombus is seen to embolize downstream in 40% of cases dying suddenly. However, post-mortem data implies that in large arteries, such as the aorta and carotid, excavation of the necrotic core underlying the rupture site is frequent, with creation of a deep filling defect or ulcer crater with superficial organization of thrombus (Figure 6). Because of high flow conditions in the carotid, the contents of the necrotic core along with platelet rich thrombus embolize. Using grey scale IVUS, the site of the plaque rupture with disrupted fibrotic cap may appear as an empty cavity due to the space left from the embolised necrotic core and flow within the crater or the deep ulcer (Figure 6).
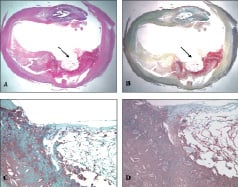
Figure 6. Ulcerated plaque, carotid artery. A. Haematoxylin eosin stain. B. Movat pentachrome stain showing the ulcerated plaque (arrow) and the various plaque components. C. Macrophage staining (CD68) showing macrophages (brown) close to the area of the ulceration and the underlying core. D. There is abundant fibrin within the ulcerated necrotic core.
The greyscale IVUS definition of a plaque rupture is a cavity within the plaque that communicates with the lumen with or without an overlying fibrous cap fragment9,10. However, not all plaque ruptures are detected by greyscale IVUS because the cavity is often filled with thrombus and blood. Information from greyscale IVUS should be used to define the residual plaque and exclude the cavity from VH-IVUS analysis, when/if this is empty. When a plaque rupture is present on greyscale IVUS, this should be noted to imply previous presence of a thin capped fibroatheroma (TCFA) even though the NC may no longer be in contact with the lumen on VH-IVUS because of overlying thrombus.
Calcification
Focal calcification of atherosclerotic plaques is a nearly universal finding in advanced plaques and in elderly patients. Because several components of the plaque can calcify, there is significant heterogeneity of the morphology of calcium deposits within atherosclerotic lesions. This heterogeneity precludes general statements associated with plaque calcification and plaque stability/instability
It is believed that calcification is an active cellular process. Intimal smooth muscle cells calcify by the formation of membrane vesicles (so-called “matrix vesicles”) which pinch off from the cell, calcify, and form a nidus for surrounding collagen calcification. This mechanism of calcification has been studied in vitro using cultures of vascular smooth muscle cells that have the propensity for calcification under certain conditions of the growth medium and in conditions of cell death (apoptosis). Other patterns of plaque calcification have not been studied in detail due to a lack of in vitro models. Matrix calcification, especially in lipid-rich pools (pathologic intimal thickening) has been observed morphologically. Proteoglycans, especially decorin, may play a role in binding of phospholipids initiating extracellular calcification. In the absence of significant inflammation, calcification may have a “stabilising” effect as dense collagenous calcified plates radiographically seen as “blocks” of calcium. However, macrophages may also form a nidus for calcification, resulting in “speckled” calcium that is associated with plaque instability and plaque rupture. Calcification of necrotic cores is often partial and “speckled” radiographically. Necrotic cores, along with surrounding collagen and block of calcium, are more often seen in stable plaques (so-called fibrocalcific plaques, which are considered stable) (Figure 7 to 10). In plaque rupture calcification is most often seen as speckled or fragments of calcification which involve either necrotic core or fibrous tissue and calcification is observed in 80% of plaques that rupture. Finally, there is a form of calcification associated with calcified nodules with overlying platelet thrombus which has been termed “nodular calcification” (Figure 11). This form of calcification is most often associated with deposition of fibrin and even bone formation. Nodular calcification is an uncommon cause of luminal thrombosis in the coronary arteries. However, in the carotid arteries, nodular calcification is more common occurring in 5-10% of cases of thrombosis by histology.
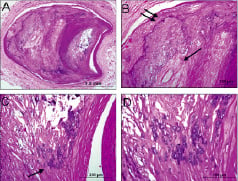
Figure 7. Stable plaque, coronary artery. A shows focal calcification (dark purple areas). B shows an area of sheet calcification (double arrow) of a collagen rich plaque where as the single arrow points to an area of necrotic core calcification. C illustrates as area of speckled calcification along a necrotic core. D is the area from C underneath the arrow at higher magnification showing single cell calcification.
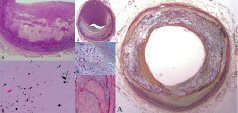
Figure 8. Coronary arteries showing patterns of calcification. Left: A. Pathologic intimal thickening. B. Calcium stain demonstrating microscopic calcifications (von Kossa). Middle: A. Fibrocalcific plaque, non-occlusive. B. Speckled calcification within an early necrotic core (Movat stain). C. Shows fibrous plaque calcification. Right: A. “Pipestem” calcification circumferentially around the vessel, with apparent stabilisation of the plaque.
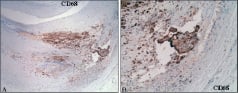
Figure 9. Unstable calcification. A. Macrophage marker (CD 68) demonstrating macrophage infiltration of an early necrotic core. B. Higher magnification of spicule of calcification (arrow) within an area of necrotic core.
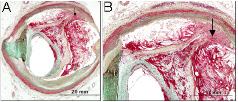
Figure 10. Coronary plaque showing healing plaque rupture. A and B at higher magnification show the site of previous plaque rupture where the fibrous cap is disturbed (arrow) and overlying healing thrombus. The rupture is almost fully healed towards the lumen.
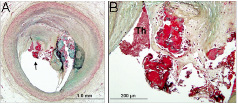
Figure 11. Nodular calcification in a coronary plaque. Note the calcification (A) some of which is nodular in nature in the area close to lumen. B is area underneath arrow in A at higher power showing nodular calcification with fibrin (dull red) in between nodules (bright red).
There is an ongoing controversy whether VH-IVUS can see behind calcium. If there is a solid “rock” of calcium, then VH-IVUS cannot see behind the calcium. Solid “rocks” of calcium can be superficial (near the lumen) or deep (near the adventitia). Conversely, if the calcium is non-confluent with gaps of approximately 100 microns (typical with speckled calcium that is present in a necrotic core), then some signal is present even if it is attenuated. On VH-IVUS imaging large confluent calcium deposits can be solid “rocks” of calcium or represent multiple, nearby, calcium deposits. It is also unclear how often there is a definable signal and how often there is mostly noise; the current hardware and software do not make this distinction. Therefore, in some cases, the signal behind calcium is mostly noise while in other cases it contains useful data. Studies are currently underway to determine when there is enough signal to accurately assess plaque composition behind calcium and when there is mostly noise and the signal ambiguous.
Nevertheless, in the case of both solid and speckled (or multifocal) calcium, shadowing caused by the presence of calcifications necessitates extrapolation of the EEM contours. Extrapolation can be assisted by longitudinal reconstruction of the cross-sectional images. The following are suggested guidelines. Extrapolation can be performed 1) if the arc of calcium is ≤90 degrees or 2) if the arc of calcium is 90-180 degrees, <5mm in length, and the “continuation” of the EEM evident using longitudinal views. Extrapolation should not be performed if the arc of calcium is >180 degrees and/or >5 mm in length. However, these are just guidelines, and the location of the transducer relative to the calcium also influence the validity of extrapolation. The presence and qualitative assessment of calcification may be prognostically important, even though quantification of its thickness and of the tissue behind the calcium are difficult.
Pathologic plaque progression
Pathology of lesion classification is based on autopsy observations which are based on static images. Although the natural history of coronary atherosclerosis is unknown, some believe that atherosclerotic lesion progression starts with pathologic intimal thickening in which lipid accumulates in areas rich in proteoglycans (lipid pools), but in absence of necrotic core. Others believe that the earliest change of atherosclerosis is the fatty streak, also called as intimal xanthoma.
The earliest lesion with a necrotic core is the fibroatheroma (FA), and this is the precursor lesion that may give rise to symptomatic heart disease. It is believed that rupture of an atherosclerotic plaque is the underlying cause of 70% of symptomatic disease. It has been shown in patients dying suddenly without prior symptomatic heart disease that at least 60% of cases will show prior rupture site or “healed plaque rupture” (Figure 10) suggesting that rupture of an atherosclerotic plaque may occur in the absence of symptoms. On the other hand, only 11% of ruptured plaques in patients dying sudden have a virgin rupture i.e., the first time that a plaque had ruptured. In the majority of cases, plaque rupture is silent, heals and leads to plaque progression through repetition of this cycle.
Pathological intimal thickening (PIT)
The pathological intimal thickening (Figure 12 and 13) is a poorly defined entity sometimes referred in the literature as “intermediate lesion”. This type of plaque does not encroach the lumen and consists of intimal thickening composed of fibrous plaque with extracellular lipid and proteoglycans. True necrosis is not evident. The area overlying the lipid is rich in smooth muscle cells and may contain a variable number of macrophages and T lymphocytes. It has been demonstrated that in the coronaries the majority of erosions occur over areas of pathological intimal thickening giving rise to a clinically significant role for these lesion types.
Fibrous cap atheroma (fibroatheroma)
This type of lesion is constituted by a large lipid-necrotic core (Figure 12 and 13) comprising large amounts of extra cellular lipid, cholesterol crystals, and necrotic debris, surrounded by a fibrous cap consisting principally of smooth muscle cells in a collagenous-proteoglycan matrix, with varying degrees of infiltration by macrophages and T lymphocytes, and a variable number of surrounding inflammatory cells surrounded also the lipid-necrotic core. This lesion, according to the AHA classification which distinguishes between lesion types IV and V on the basis of the development of complicating features, may progress and became highly calcified or develop complications such as mural haemorrhage.
Thin capped fibroatheroma (TCFA)
This lesion is characterised by a large necrotic core containing numerous cholesterol clefts (Figure 12 and 13). The overlying cap is thin and rich in inflammatory cells, macrophages and T lymphocytes with few smooth muscle cells. Plaques prone to rupture are those with decrease cap thickness, large lipid-necrotic core and severe inflammatory infiltrate A study done by Burke et al11 has identified a cut-off value for cap thickness of <65 microns for vulnerable coronary plaque definition.
Healed lesions
Healed ruptures are characterised by a disrupted fibrous cap filled in by smooth muscle cells, proteoglycans, and collagen (Figure 12 and 13). Healed ruptures are best identified by picrosirius red staining, whereby newly synthesised type III collagen is seen overlying a ruptured fibrous cap consisting primarily of type I collagen. The matrix within the healed fibrous cap defect may consist of a proteoglycan-rich mass or a collagen-rich scar depending on the phase of healing. Lesions with healed ruptures may exhibit multi-layering of lipid and necrotic core, suggestive of previous episodes of thrombosis.
Fibrocalcific lesions
Fibrotic plaques with extensive accumulations of calcium are called fibrocalcific plaques (Figure 12 and 13).
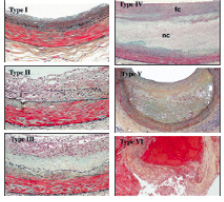
Figure 12. AHA plaque classification. (Stary HC. The histological classification of atherosclerotic lesions in human coronary arteries. In: Fuster V, Ross R, Topol E, eds. Atherosclerosis and Coronary Artery Disease.). fc: fibrous cap; nc: necrotic core
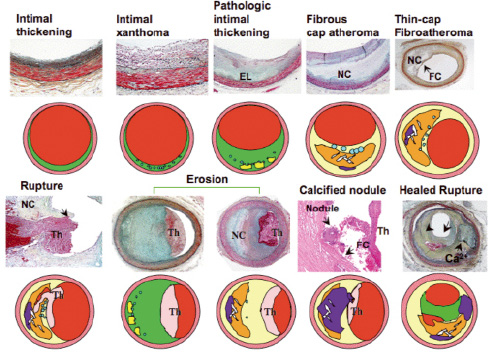
Figure 13. Modified AHA classification, Virmani et al, ATVB 2000; 20:1262-75. EL: extracellular lipid; nc: necrotic core; fc: fibrous cap; th: thrombus
VH-IVUS lesion type or classification
Table 2 outlines the plaque and lesion types that are proposed based on the above pathologic data.
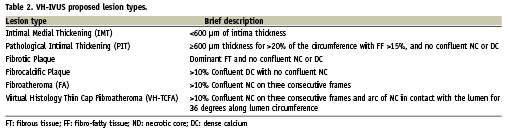
Confluence is important to minimise over reporting isolated islets or individual pixels of VH-IVUS detected necrotic core which can be artefacts. The term confluent is defined as a substantial area of necrotic core or dense calcium that is present in the VH-IVUS image as an aggregate indicative of the plaque type not just image ‘noise.’ This was determined based on observations from numerous VH-IVUS images and corresponding histology images, such that a ‘confluent area’ is equivalent to an area of approximately 10% of necrotic core. Two other important concepts are 1) the size of the major confluent necrotic core (area, volume, length, and arc) and 2) size of the major necrotic core in contact with the lumen (length and arc). IVUS derived TCFAs (VH-TCFA) or fibroatheromas can also be subclassified according to 1) the number of necrotic cores or the presence of multiple layers of necrotic core; 2) presence or absence of calcification and number of focal or layered calcific deposits (presumed evidence of previous rupture); and 3) plaque burden (or lumen compromise). Given any two-dimensional (2D) VH-IVUS image, the following text outlines a possible algorithm for lesion analysis.
The plaque thickness is first checked to determine if the VH-IVUS image represents intima-medial thickening (IMT) or a lesion. For this criterion to be satisfied, the plaque has to be greater than 360 µm thick for over 20% of the circumference covered by the plaque. For VH-IVUS images, this distance is calculated beyond the grey-coloured media area that is considered to be 250-350 µm, representing healthy media. Hence, the total cut-off distance is approximately 600 µm. Next, an area of confluent necrotic core or dense calcium is searched for in the image. Confluent necrotic core or confluent dense calcium can also be present together with their co-existence resulting in the formation of calcified fibroatheroma and calcified thin cap fibroatheroma categories. If a confluent necrotic core is found, its proximity to the lumen is determined to define whether the lesion is a FA or a VH-TCFA. The term confluent at the lumen is defined as a confluent necrotic core that is consistently present for at least 36 degrees along the circumference of the lumen. If the confluent necrotic core is not at the lumen, the plaque is simply a fibroatheroma. The addition of attached confluent-dense-calcium lends to the presence of either Ca fibroatheroma or Ca VH-TCFA dependent on the lumen confluency condition. If confluent necrotic core is absent but confluent dense calcium is present, the plaque is fibrocalcific. In absence of both confluent necrotic core and confluent dense calcium, the remaining categories are either PIT or fibrous plaque. Presence of >15% fibro-fatty component indicates PIT and <15% fibro-fatty component indicates fibrous plaque.
A plaque becomes a lesion when the plaque burden (plaque/EEM) exceeds 40% over three consecutive frames. Lesions separated by 5mm lengths of artery with a plaque burden <40% should be considered separate lesions. Lesions should be classified according to the worst-case scenario or highest risk lesion. We hypothesise that an “evolutionary” lesion classification will be, in order, IMT, PIT, Fibrotic plaque, Fibroatheroma, VH-TCFA, and (finally) Fibrocalcific (Figure 14). We also hypothesise that a classification in term of vulnerability will be different with VH-TCFA being highest risk plaque: IMT, PIT, Fibrotic, Fibroatheroma, and VH-TCFA. Thus, there should be different approaches for pharmacological versus prognostic versus interventional studies. The interventional cardiologist may be more concerned with plaque morphology that influences the procedure (ie. calcification, necrotic core-rich plaque), lesion preparation pre-intervention, acute complications post-intervention (plaque shifting, stent thrombosis), and final results. Pharmacologic or other natural history studies may be more interested in serial changes in plaque composition, lesion classification, and lesion vulnerability.
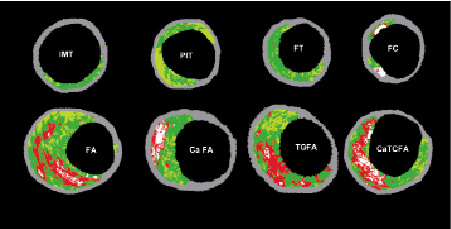
Figure 14. Examples of VH-IVUS images classified by a two-dimensional lesion analysis. (IMT) intimal medial thickening; (PIT) pathological intimal thickening; (FT) fibrotic plaque; (FC) fibrocalcific plaque; (FA) fibroatheroma and (caFA) calcified fibroatheroma; (VH-TCFA) Virtual Histology-thin cap fibroatheroma and (VH-caTCFA) Virtual Histology-calcified thin cap fibroatheroma.
Stents
Currently, VH-IVUS has not been validated for metal stents, for intimal hyperplasia, for tissue surrounding and behind stent struts in general, and for the chronic effect of drug-eluting stent polymers. Metallic stent struts appear white surrounded by a red halo; thus, stent metal is artefactually included in the calculation of both calcium and necrotic core. However, from a quantitative point it would be interesting to develop a third (stent) contour with validation of stent metal and peri-stent tissue. This should be feasible because stent struts are small and the gaps between stent struts are large. For example, in the TAXUS-II study12, there was a chronic increase in EEM dimensions; it would be interesting to know what type of tissue contributed to this process. It is recommended that frames containing stents being marked as containing a stent and that these frames be assessed visually, but not included in the VH-IVUS calculations similar to the approach recommended for heavy calcification (above).
However, a distinction should be made for bioabsorbable stents. Recently, the feasibility and safety of a bioabsorbable everolimus-eluting stent (BVS) was assessed. In a prospective, open-label study, 30 patients with a single de novo lesion that was suitable for treatment with a single BVS, were enrolled. Stent struts are classified as “dense calcium” (DC) and “necrotic core” (NC) by IVUS-VH. From pre- to post-stenting, in 13 patients imaged with VH (n=13), there was an increase in mean “DC” (9.8 vs. 25.4%, p=0.0002) and “NC” (15.5 vs. 30.5%, p=0.0002). Comparing post-stenting with six months follow-up (n=27), VH showed a decrease in “DC” (29.7% vs. 21.1%, p=0.0001). “NC” also decreased (26.9 vs. 21.5%, p=0.0027).
The quantitative assessment of the IVUS-VH changes at six months suggests early strut alteration of the BVS stent with reduction of radiofrequency backscattering.Thus, virtual histology helps in assessing the bioabsorption rate of such stents13.
Core labs, analysis software, and their validation
Based on current experience with programs developed by individual laboratories, the following should be incorporated into an ideal software package.
1. Optimised automatic contour detection
2. Quantitative output of data along the longitudinal axis of the segment to include “Greyscale” parameters such as EEM, lumen, and plaque+media areas and remodeling
3. Absolute and relative VH-IVUS plaque components (in which the total of the four components equals the absolute “greyscale” plaque area)
4. Presence of “normal” or non-diseased cross-sections
5. Volumetric analyses
6. Automated targeted lesion classification software
7. Manual annotation – for example, lesion classification, evidence of plaque rupture on greyscale imaging, presence of a stent, presence of multiple necrotic cores, artefacts, presence of a non-diseased cross-section, etc.
8. Manual selection of reference segments for calculation of remodelling
Only one analysis software package should be used in a given study; unfortunately, this may result in not being able to switch to the latest, most efficient software when it becomes available.
Either phantoms or a standard set of cases be developed for validation of new software and new core laboratories. Inter and intra-observer reproducibility should include all sources of variation from image acquisition to core lab analysis: general precision/accuracy of the technique, 1st vs 2nd pullback, 1st vs 2nd catheter, one type of catheter vs another, 1st vs 2nd observer, and 1st vs 2nd core lab, 1st vs 2nd set of contours, and lesion classification.
Study-design related recommendations
Single point-in-time studies (transversal or observational studies)
Each artery should be divided into segments defined by proximal and distal fiduciary branches, most often side-branches. The shortest segment that should be analysed at one point in time is 1.5 mm within a >10 mm continuously imaged vessel segment and near to one or more definable fiduciary points that can be used for interpolation. The rationale for this recommendation is 1) a 1.5 mm segment will contain at least three consecutive frames at a pullback speed of 0.5 mm/sec (when heart rate is 60 bpm); 2) this is the average antegrade/retrograde catheter motion during systole / diastole; and 3) the Medis quantitative angiographic analysis system reports coronary artery lengths as short as 1.5 mm. Therefore, VH-IVUS can be referenced to the coronary angiogram using nearby sidebranches that can be identified on both studies. It is highly recommended that a picture of the angiogram be provided for comparative purposes. PROSPECT is analysing the three major epicardial arteries in 1.5 mm segments.
Serial studies (longitudinal or natural history studies)
The shortest segment that should be analysed on serial studies is 10 mm. It is also recommended that the zoom setting be the same for each of the serial studies. Because the number of frames/mm will vary with heart rate and because the heart rate may differ between two VH-IVUS studies, serial studies should use both a proximal and distal landmark to define the analysis segment; and the VH-IVUS data should be averaged on a per segment basis or reported as a normalised volume. (This is similar to what has been done for greyscale IVUS analysis of progression/regression.)
Vulnerable plaque studies
Because of angiographic studies documenting the distribution of acute coronary occlusions and because of greyscale IVUS studies documenting the location of ruptured plaques, it is recommended that long-term prognostic studies include VH-IVUS analysis of the proximal 40 mm of the LAD and LCX and the RCA down to the crux14-18. However, this may not always be possible or practical. Therefore, at the very least, the most proximal 30 mm of each of the three major epicardial arteries should be imaged. The US FDA recommends imaging 1) at least a 30 mm long non-stented segment of an untreated artery or 2) a 30 mm long non-stented segment of a treated artery that is at least 10mm removed from the stent edge. The minimum length of LM that should be imaged is 5mm or 50% of LM length. However, natural history studies in which the origin and morphology of vulnerable plaques were prospectively identified have not been completed. In the PROSPECT study the left main coronary artery and the proximal 6-8 cm of the three major epicardial coronary arteries have been imaged in >600 patients, with follow-up ongoing.
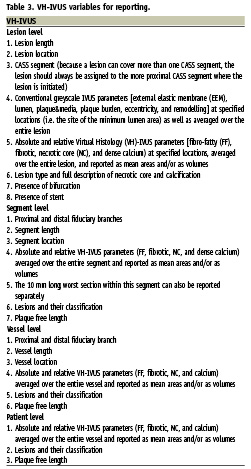
Reporting
VH-IVUS data can be reported per lesion, per segment, per vessel, and per patient (Table 3). On one hand, a study geared to providing prognostic information should aim at the most complete assessment of the coronary tree possible. The minimal segment to be analysed should be 1.5 mm. It is unclear whether such short segments of coronary tree are independent of each other in terms of VH classification. However, we assume that there is some degree of interdependence. Thus, there maybe a value in analysing the entire length of the coronary tree for statistical power. On the other hand, a study geared to assessing coronary intervention should focus in the lesion, itself.
Whenever possible, all VH-IVUS continuous data should be reported as continuous variables.
Greyscale IVUS
Greyscale and VH-IVUS data should be integrated. In addition to VH-IVUS, a complete report should also include full greyscale quantification: EEM, lumen, and plaque&media area; plaque burden (plaque&media divided by EEM); remodelling (lesion EEM compared to a pre-determined reference EEM); eccentricity (based on maximum and minimum plaque&media thickness); and calcium (arc, length, and location).
When assessing remodelling, the EEM CSA of a single, pre-specified lesion site cross-section should be compared to a pre-defined reference. For non-bifurcation lesions, it is recommended that the reference segment be the single frame (or three consecutive frames) with least plaque burden within the same segment as the lesion. If the lesion extends over more than one segment, then the single, pre-specified lesion site cross-section should be compared to the pre-defined reference within the same segment.
In the case of a bifurcation lesion, if the image slice with the minimum lumen area is proximal to the carina, then a proximal reference should be used to calculate remodelling. If the image slice with the minimum lumen area is distal to the carina, then a distal reference should be used to calculate remodelling.
Remodelling should be reported as a continuous plot over the length of the coronary segment based on the reference segments that are selected.