Abstract
Aims: To demonstrate the feasibility and potential usefulness of an offline fusion of matched optical coherence tomography (OCT) and intravascular ultrasound (IVUS)/virtual histology (IVUS-VH) images.
Methods and results: A total of nine matched OCT, IVUS, and IVUS-VH cross-sections were fused according to a methodology described in this report. On the basis of the fused images, an OCT-IVUS-VH tissue classification algorithm is proposed taking into account the individual strength of both techniques.
Conclusions: Offline fusion of co-registered IVUS and OCT is feasible and combines the strengths of both imaging modalities, potentially improving the diagnostic accuracy of plaque characterisation.
Introduction
The gold standard for the assessment of human coronary atherosclerosis is histology. By nature, histology remains restricted to post-mortem studies and animal models, which do not reflect anatomy under pressurised conditions in vivo and does not provide longitudinal information as it relates to disease progression or regression within the same individual and lacks transferability of animal data to humans1. Therefore, in vivo imaging modalities that allow a diagnostic accuracy similar to histology are in demand. Intravascular imaging techniques currently provide the highest resolution of all available coronary imaging modalities2 and can contribute to the understanding of mechanisms underlying the progression of coronary artery disease; evaluate pharmaceutical effects on progression and regression of atherosclerosis3; and can potentially guide interventional therapy with the aim of improving outcomes4.
Two intracoronary technologies are predominantly used for research and clinical application, namely intravascular ultrasound (IVUS) and optical coherence tomography (OCT), both of which have previously been validated against histology5-11. The applied imaging physics differ fundamentally: IVUS, which has been available since the early 1990s, is based on the backscattering of ultrasound waves at a frequency of millions of cycles per second. When extracting information from the ultrasonic signal, two physical characteristics can be utilised: first, the amplitude of the reflected ultrasound wave, which is used to create the greyscale (GS) image; and second, the radio-frequency signal, which is the basis for virtual histology (IVUS-VH), a technique that aims to assess plaque composition, also validated in previous studies7. The axial resolution of IVUS is in the range of 80-200 µm depending on the sound frequency, and the penetration depth amounts to 8-10 mm. As opposed to IVUS, OCT is a relatively novel technique, available for clinical use since 2005 (CE approval of time-domain OCT). It is based on the use of near-infrared light, with a wavelength specifically chosen of around 1,300 nm in order to reduce the light absorption of different tissues to a minimum. The axial resolution of OCT is in the range of 10 µm, an order of magnitude higher than IVUS, allowing for the identification of certain features shown to be related to plaque vulnerability. The high resolution, however, comes at the cost of a limited tissue penetration, which amounts to 1-2 mm11,12. Consequently, OCT provides a detailed assessment of features close to the lumen surface, whereas IVUS offers a cross-section of the entire vessel wall. In view of the fundamental differences in imaging physics resulting in different information gained by IVUS and OCT, a combination of these techniques may improve the assessment of coronary atherosclerosis in a synergistic manner. As the sensitivity and specificity for assessing the tissue composition of atherosclerotic lesions varies for the two technologies, a combined approach may further enhance the diagnostic precision. At present, there is neither a dedicated imaging probe that would allow a simultaneous in vivo IVUS-OCT assessment, nor specific software enabling an offline fusion of matched IVUS and OCT images. It is against this background that we describe here our methodological approach to fuse co-registered IVUS and OCT images, in order to achieve a comprehensive in vivo assessment of human atherosclerosis.
Methods
Definitions
CO-REGISTRATION Co-registration refers to the recording of an identical region of interest (ROI) within a coronary artery by two different imaging technologies. To date, a simultaneous co-registration of IVUS and OCT images, using a single bimodal imaging catheter, cannot be obtained in vivo. Consequently, separate acquisition of IVUS and OCT images in a serial fashion is necessary. Serial imaging, however, impacts importantly on the matching process, as common landmarks have to predefined and identified.
MATCHING Matching relies on the identification of corresponding frames from two separately acquired pullbacks. Matching is initiated by the identification of common landmarks, such as side branches, bifurcations or large calcifications, and the precision of the matching increases with the number of common landmarks identified. Matching can be achieved manually, or semi-automatically using dedicated software13.
FUSION Fusion refers to the offline merging of two fully matched cross-sections that were acquired using two different imaging techniques. In this report we describe the methodological procedures and feasibility of manual matching and fusion of IVUS (IVUS-GS or IVUS-VH) and OCT images to create combined tissue maps, which in the future may lead to the development of dedicated fusion software to analyse co-registered images.
IMAGE ACQUISITION
OCT images were acquired using the C7 frequency domain OCT system (LightLab Imaging/St. Jude Medical, Westford, MA, USA). The Dragonfly™ OCT catheter (LightLab Imaging/St. Jude Medical) was advanced over a conventional guidewire, distal to the distal landmark of interest (typically a side branch), and care was taken to document the catheter position angiographically. After intracoronary administration of 100 µg nitroglycerine, blood was displaced using a non-ionic contrast agent (Xenetics®; Guerbet S.A., Villepinte, France) at 4-6 ml/sec. When sufficient blood clearance was achieved, imaging pullback was initiated at a rate of 20 mm/sec. After successful OCT imaging and verification of target landmarks on the OCT pullback, the Eagle-Eye® Gold 20 MHz IVUS probe (Volcano Corp., San Diego, CA, USA) was positioned at the same starting point, which was documented angiographically. After another administration of 100 µg nitroglycerine, catheter pullback was initiated at a standard rate of 0.5 mm/sec, and continued beyond the proximal landmark. Images were stored for later offline analysis.
POST-ACQUISITION IMAGE PROCESSING
MATCHING OF PULLBACKS AND DEFINITION OF ROI The OCT data was loaded into a dedicated offline workstation with proprietary software from LightLab Imaging/St. Jude, whereas IVUS data was loaded into the QCU-CMSTM software (Medis, Leiden, The Netherlands) on a separate computer next to the OCT workstation. As a first step, the most proximal side branch was identified in both OCT and IVUS pullbacks, and the cross-sectional rotation of the OCT pullback was adapted according to the orientation of the IVUS pullback. Subsequently, as many common side branches as possible were identified, and the most proximal and distal common side branches were used to define the matched ROI.
MATCHING OF CROSS-SECTIONS Within the matched ROI, a subsegment of interest (coronary artery plaque) was identified by OCT, and side branches within or adjacent to this segment were located in both OCT and IVUS pullbacks. Subsequently, matched cross-sections of interest were identified, again using common landmarks such as: small side branches; a certain position and configuration of calcifications; and/or a characteristic lumen shape and circumferential profile of the plaque thickness. Finally, a 1 mm calibration line was inserted in order to allow for size adaptation prior to the fusion, and the selected cross-sections were exported in JPEG format.
FUSION OF CROSS-SECTIONS Cross-sections were uploaded in Adobe® Photoshop® (Adobe Systems Incorporated, San Jose, CA, USA) and the matched IVUS-GS, IVUS-VH and OCT images placed next to each other. Thereafter, the following steps were undertaken:
1. The size of OCT and IVUS images was adjusted by matching the calibration line of 1 mm.
2. The two-dimensional orientation of the cross-sections was fine-tuned by rotating the images using cross-sectional landmarks according to the following hierarchy: a) side branch; b) calcification; c) lumen shape; d) circumferential plaque configuration (distance between lumen and external elastic membrane).
3. To optimise the overlay of IVUS on top of OCT images, the transparency function of Adobe Photoshop was used to allow the simultaneous visibility of the structures in the underlying OCT image. As a suitable default setting for overlaying IVUS on top of OCT images, a transparency of 60-70% for the IVUS-GS images, and 70-80% for the IVUS-VH images, was used (Figure 1, Figure 3 and Figure 5).
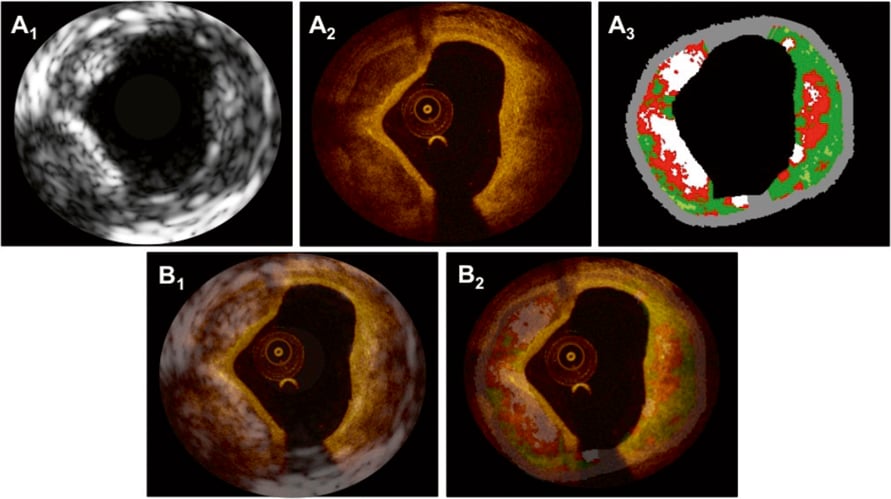
Figure 1. In panels A1-3 matched cross-sections obtained by IVUS-GS (A1), OCT (A2) and IVUS-VH (A3) depict fibrocalcific plaque in the left half of the vessel, and a necrotic core/lipid pool at the opposite side of the calcification. Superimposition of IVUS-GS on top of OCT and IVUS-VH on top of OCT is presented in panels B1 and B2, respectively.
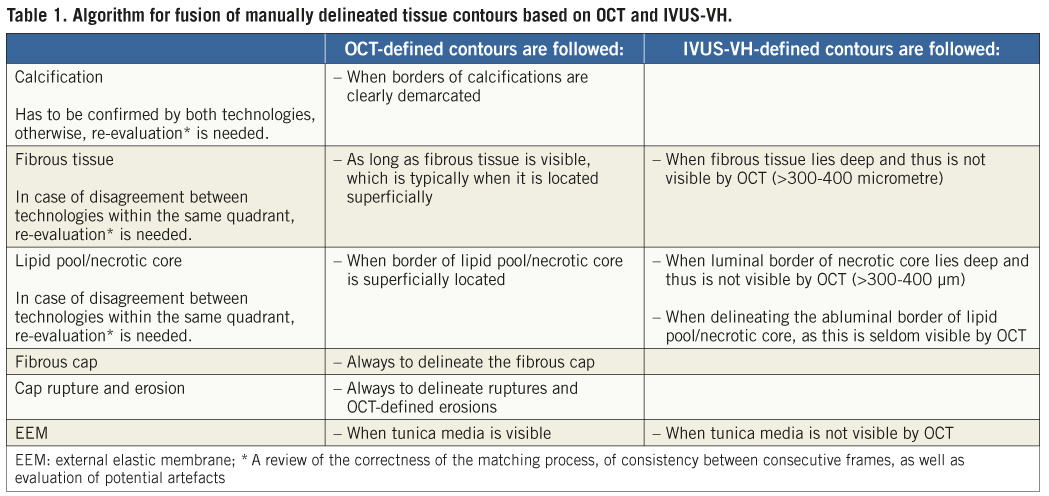
4. Using information from the matched original OCT and IVUS-VH images (Figure 2A, Figure 4A and Figure 6A), the contours of all visible tissue compartments as well as the external elastic membrane (EEM) were delineated and coloured using the following colour codes: white=calcific tissue by OCT/dense calcium by IVUS-VH; green=fibrous tissue by OCT/fibrous and fibro-fatty tissue by IVUS-VH; red=necrotic/lipid tissue by OCT/necrotic core by IVUS-VH; and grey=media by OCT/media stripe, i.e., EEM, by IVUS-VH (Figure 2B, Figure 4B and Figure 6B). The tissue composition in OCT images was assessed using previously validated criteria14.
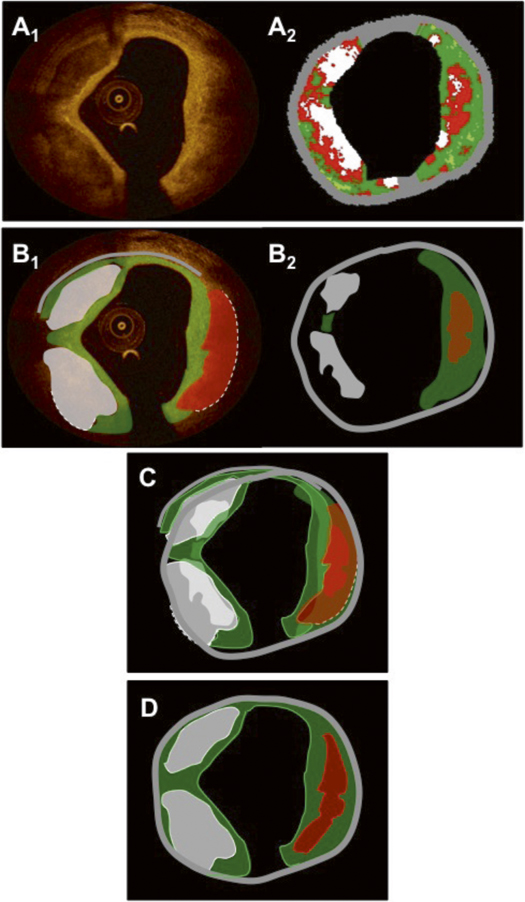
Figure 2. Panels A1 and A2 show the same matched OCT and IVUS-VH images as in Figure 1. Panels B1 and B2 show the resulting tissue maps after delineation of the visible tissue compartments according to validated criteria. Green indicates fibrous/fibro-fatty tissue; white, calcific tissue; red, lipid tissue/necrotic core; and grey, media/EEM. The dotted lines in the OCT image in panel B1 indicate that the deep contours of the lipid/necrotic region at 1-5 o’clock and the calcific pool at 6-9 o’clock cannot be accurately delineated. Of note, the necrotic tissue displayed by the software behind the calcifications in panel A2 has been excluded in the tissue map in panel B2, as it is known that this information is not reliable. Panel C shows the superimposed tissue maps from panels B1-2 in which many features coincide; however, they have different sizes and shapes due to different imaging physics. Of note, the IVUS-VH displays a necrotic core with direct contact to the lumen suggestive of an IVUS-VH TCFA, which is in contradiction with the OCT that displays a thick fibrous cap, suggesting an OCT ThCFA. As OCT is considered to be superior in terms of superficially-located tissue, the final diagnosis using a fused approach is a calcified ThCFA. The final fused result after weighting of the individual components in the tissue maps, according to the algorithm in Table 1, is shown in panel D.
5. The delineated compartments derived from the two technologies were then superimposed and displayed simultaneously in a fused schematic image (Figure 2C, Figure 4C and Figure 6C).
6. For the final presentation of the schematic fused cross-sections, the information from the technology having a “superior” accuracy for a respective feature outweighed the information from the technology with the “inferior” accuracy, and was placed on top of it. The algorithm considered is outlined in Table 1.
Results
We selected in total three matched coronary artery cross-sections showing various plaque morphologies from co-registered IVUS and OCT pullbacks obtained from patients undergoing a study including both IVUS and OCT (NCT00962416). Below follows an explanation of the findings from the isolated and fused images.
Example 1. Calcified thick-cap fibroatheroma
UNFUSED MATCHED IMAGES The OCT cross-section in Figure 1A2 shows two sharply delineated signal-poor, low-attenuation foci at 6-9 and 9-11 o’clock, suggestive of calcific pools. The cores of these calcifications exhibit a homogeneous appearance and are covered by a relatively thin (80 µm) homogeneous signal-rich layer of even thickness, consistent with fibrous tissue. Opposite the calcification, a diffusely demarcated signal-poor zone with high light attenuation is seen, indicative of a lipid pool. This is covered by a signal-rich fibrous cap that measures >200 µm, defining this part of the cross-section as an OCT-derived calcified thick-cap fibroatheroma.
Figure 1A1 shows the matched IVUS-GS image depicting two hypoechoic pools suggesting calcific areas. Of note, the calcific pool at 6-9 o’clock is inducing an acoustic shadowing which prevents visualisation of the deep contour of the calcification. With the exception of the region with acoustic shadowing, the external elastic membrane delineating the plaque border is clearly visible throughout the circumference.
Based on the radio-frequency signal, the corresponding IVUS-VH cross-section in Figure 1A3 displays the two calcific pools in white. Depending on the extent of acoustic shadowing, tissue characterisation using radio-frequency data from behind the calcifications is less reliable8. The zone at the opposite side of the calcification is displayed as necrotic core with direct contact to the lumen, indicative of an IVUS-VH derived calcified thin-cap fibroatheroma, which challenges the findings by OCT.
FUSED IMAGES In this example, matching and fusion was facilitated by the presence of the two calcific pools as well as the specific lumen shape and characteristic plaque thickness profile (thin intima from 11-1 o’clock). Superimposition of IVUS-GS/VH on top of OCT is shown in Figure 1B1-2. Of note, both the lumen shape and size, and the calcific pools overlay each other with a high agreement. The information that is added by OCT as compared to IVUS includes the following: firstly, the fibrous cap overlying the calcific pools cannot be visualised using IVUS as the thickness is below the resolution of the technique; secondly, the abluminal border of the calcific pools and therefore the area of the calcification is not assessable using IVUS due to the acoustic shadowing, which is however in part possible with OCT. Conversely, the limited penetration of the optical signal does not allow for the visualisation of the EEM, when it is in the far-field of the source of light (Figure 1A2, 7-8 o’clock) or concealed behind highly attenuating tissue (Figure 1A2, 1-6 o’clock). OCT therefore precludes the determination of the total plaque volume and of the remodelling index (information that is available by IVUS). Figure 2 shows how the schematic tissue information can be combined and fused by individual weighting of the information obtained by OCT and IVUS-VH according to the steps described above and the algorithm presented in Table 1. IVUS-VH displays a thin-cap fibroatheroma with necrotic core in contact to the lumen, whereas a thick fibrous cap (>200 µm) is depicted by OCT, suggesting an OCT-derived thin-cap fibroatheroma (TCFA). According to a combined algorithm (see also discussion section), the final diagnosis corresponds to a VH-OCT derived calcified thick-cap fibroatheroma.
Example 2. Thin-cap fibroatheroma (TCFA)
UNFUSED MATCHED IMAGES Figure 3A2 shows an OCT cross-section displaying a circumferential signal-poor region, diffusely demarcated luminally, with a fast signal drop-off, suggestive of lipid/necrotic tissue. The region is covered by a highly reflective thin layer (minimal thickness 40 µm) – a thin fibrous cap – which is fissured at 6 o’clock and lifted from the underlying tissue from 5-8 o’clock. Taken together, the findings suggest a ruptured TCFA. IVUS-GS in Figure 3A1 shows concentric plaque with a zone of relatively high echogenicity from 6-12 o’clock. The corresponding IVUS-VH confirms a large area of confluent necrotic core from 6-1 o’clock, abutting the lumen at >30 degrees, thus corresponding to a VH-derived TCFA.
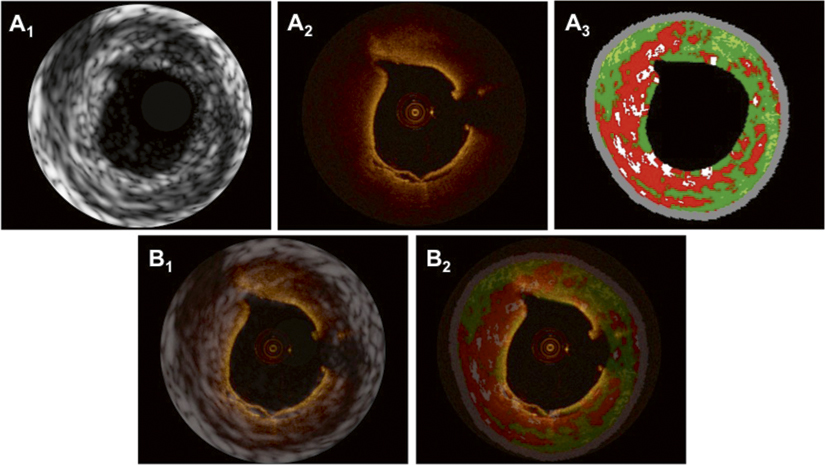
Figure 3. In panels A1-3, matched cross-sections obtained by IVUS-GS (A1), OCT (A2) and IVUS-VH (A3) show a thin-cap fibroatheroma (TCFA) with a large necrotic core/lipid pool abutting to the lumen in panel A3, and rupture of the thin fibrous plaque at 6 o’clock in panel A2. Superimposition of IVUS-GS on top of OCT and IVUS-VH on top of OCT is presented in panels B1 and B2, respectively.
FUSED IMAGES In this case, cross-sectional fusion was facilitated by the presence of the small side branch at 11 o’clock, together with the oval lumen shape. The superimposed OCT and IVUS images are shown in Figure 3B1,2. This example illustrates the limitation of OCT in visualising the EEM behind a thick highly light-attenuating lipid/necrotic core. At the same time, however, the figures demonstrate that the combination of OCT with IVUS allows for delineation of the EEM and thus assessment of the total plaque volume. IVUS, on the other hand, is limited by its resolution, which is clearly evident in this example by the inability to visualise the thin fibrous cap and, specifically, the site of plaque rupture. Nevertheless, the superimposed image demonstrates that the IVUS-VH derived necrotic core is in contact with the lumen at the localisation of the ruptured plaque, indicating that the technology has the capability to recognise a TCFA although a detailed surface assessment is not possible. In the OCT image at three o’clock, there is a discontinuity in the fibrous cap, which is partially obscured by the shadowing of the guidewire. Figure 4 shows the delineation of tissue compartments in OCT creating a schematic tissue map, which is then fused with that provided by IVUS-VH. Of note, the deep border of the lipid/necrotic core cannot be delineated by OCT, which is highlighted with a dotted line. For the final fused image in Figure 4D, the delineation of lipid/necrotic core features was based on OCT for the luminal contour and on IVUS-VH for the abluminal border, while the information on deeply located fibrous tissue and EEM border was derived from IVUS-VH, all according to the algorithm presented in Table 1.
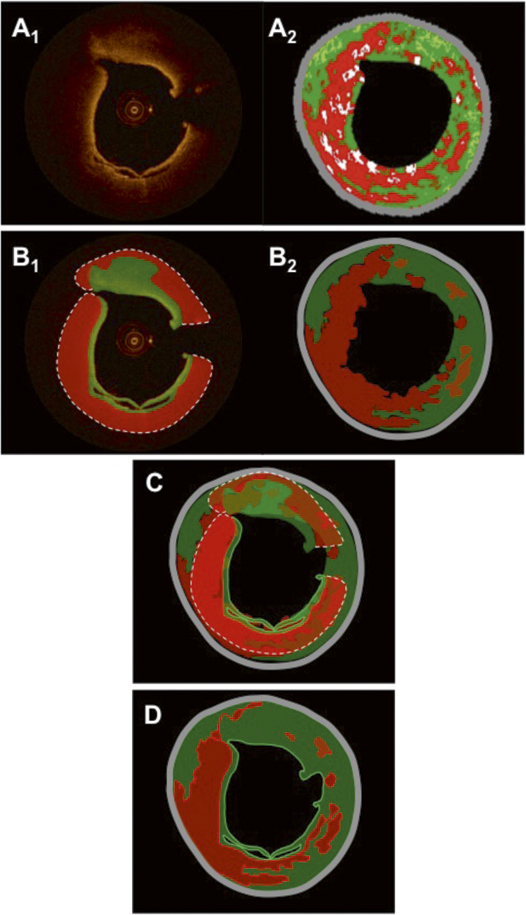
Figure 4. Panels A1 and A2 show the same matched OCT and IVUS-VH images as in Figure 3. Panels B1 and B2 show the resulting tissue maps after manual delineation of the visible tissue compartments according to validated criteria. Green indicates fibrous/fibro-fatty tissue; red, lipid tissue/necrotic core; and grey, media/EEM. The dotted line in the OCT image in panel B1 indicates that the deep contour of the lipid/necrotic region cannot be accurately delineated. Panel C shows the superimposed tissue maps from panel B1-2 in which the necrotic core and parts of fibrous features coincide. The final fused result after weighting of the individual components and contours in the tissue maps, according to the algorithm in Table 1, is shown in panel D.
EXAMPLE 3. THICK-CAP FIBROATHEROMA (ThCFA)
Unfused matched images The OCT cross-section in Figure 5A2 reveals a deeply located low-signal area at 2-6 o’clock covered by a thick homogeneous signal-rich layer, suggestive of an OCT-derived ThCFA. Due to the limited tissue penetration, the media can only be appreciated at the site of the discrete intimal thickening from 9-1 o’clock. IVUS-GS, however (Figure 5A1), provides a well-defined overview of the deeper parts of the vessel wall allowing for the assessment of the EEM area. IVUS-VH indicates plaque composed of >10% confluent necrotic core without contact with the lumen, suggesting an IVUS-VH derived ThCFA.15 Of note, the intimal thickening as seen by OCT between 9-1 o’clock is not displayed by IVUS-VH, as the thickness of the intima (~200 µm by OCT) does not exceed the default setting of the thickness of the medial stripe on IVUS-VH (250 µm)16.
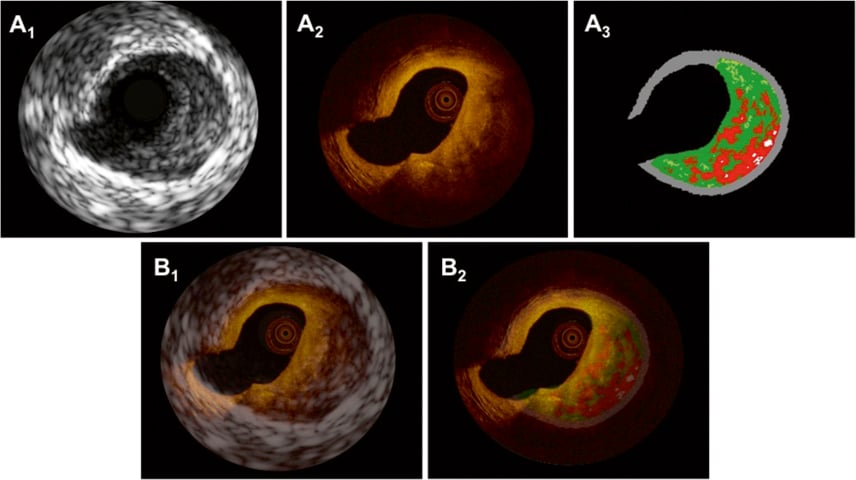
Figure 5. In panels A1-3, matched cross-sections obtained by IVUS-GS (A1), OCT (A2) and IVUS-VH (A3) display a thick-cap fibroatheroma (ThCFA) with a necrotic core/lipid pool covered by a thick cap (>200 µm by OCT) at 4 o’clock. Superimposition of IVUS-GS on top of OCT and IVUS-VH on top of OCT is shown in panels B1 and B2, respectively.
FUSED IMAGES Cross-sectional matching, superimposition (Figure 5B1,2) and fusion (Figure 6) were, in this example, facilitated by the presence of a large side branch at 7-9 o’clock in conjunction with the eccentric profile of the plaque. The information added by IVUS-GS in this example mainly includes the delineation of the EEM, but also the indication of necrotic core/lipid pool at the site corresponding to the signal-poor region in OCT, thus further supporting the diagnosis of a ThCFA. This is of importance as, whether the signal-poor region in the OCT image is mainly caused by light attenuation by the thick fibrotic layer, or is rather due to the attenuating effects of deep lipid/necrotic core, can be discussed. Both may play a role in this case, the argument for the latter being that a slight increase in the signal can be appreciated deep in the vessel wall around 3-4 o’clock, indicating that light still reaches this part of the vessel wall and that attenuation is thus caused by both. Figure 6 shows schematically how tissue compartments were delineated by OCT, and how the combined OCT and IVUS-VH information was weighed to create a fused tissue map, based on the algorithm shown in Table 1.
Discussion
To our knowledge, this is the first report demonstrating the feasibility of an offline fusion of co-registered OCT and IVUS-GS/VH images. A few studies have been published on the combined use of IVUS and OCT for the assessment of coronary atherosclerosis, yet none of them used an offline fusion approach17-19. The examples presented here illustrate the advantages of combining complementary information from two technologies with differing physical properties, resulting in an optimised assessment of volumetric and structural characteristics of human atherosclerosis. Consequently, fusing co-registered matched IVUS and OCT images offers the following advantages.
Identification of tunica media and assessment of plaque volume
The identification of the medial layer by OCT relies on the penetration of light through the entire intima, which is determined by several factors. First, tissue penetration in general relates to the intrinsic properties of the OCT light such that increasing the wavelength would increase the penetration depth; however, this would come at the cost of resolution. Second, the penetration depth of OCT depends on the optical properties of the tissues, namely absorption and backscatter, which determine to what degree light is attenuated along the scan line. Accordingly, lipid and necrotic tissue attenuate the light significantly, whereas fibrous and calcified tissues allow a deeper penetration. However, the extent of the vessel wall finally visualised also depends on the thickness of the plaque. Third, the imaging depth is to some extent also affected by the position of the imaging catheter in the lumen, which is related to vessel tortuosity. Consequently, marginalisation of the catheter results in a poorer delivery of light to the part of the vessel circumference located farthest away20.
As opposed to OCT, IVUS technology uses longer wavelengths, which, in the absence of large calcifications, enables it to detect the interface (i.e., the external elastic membrane) between the media and adventitia. In this way, IVUS permits assessment of the total plaque volume as well as vessel remodelling, which is of particular importance in the study of plaque progression and regression21. In Figure 3 and Figure 5 we demonstrated how the overlay of IVUS on top of OCT facilitates the location of the EEM behind highly attenuating tissue in the OCT cross-section.
Lipid pools and necrotic cores
Lipid pools and necrotic cores are recognised by OCT as diffusely demarcated signal-poor regions. In addition to precluding delineation of the media, they also prevent the evaluation of other potentially present tissues types. This is illustrated in Figure 5 where evaluation of the deep tissue at 1-7 o’clock is not possible by OCT (Figure 5A2). However, IVUS-VH (Figure 5A3) suggests that fibrous tissue is present behind the necrotic core at 2 o’clock. Fusion of OCT and IVUS-VH information in this example offers a more accurate characterisation of the vessel wall composition. Notwithstanding, we wish to emphasise that additional studies need to compare directly a fused analysis of co-registered IVUS and OCT images against histology in order to determine whether this technique results in higher diagnostic precision, and whether it can eliminate misinterpretations of OCT related to the limited penetration depth. We would also like to mention that, for the fusion of OCT and IVUS-VH images showing lipid/necrotic content, a general requirement should include the co-localisation of this feature to some extent in both technologies. In case of disagreement, potential causes, such as imaging artefacts or insufficient matching, should be excluded prior to fusion of the images.
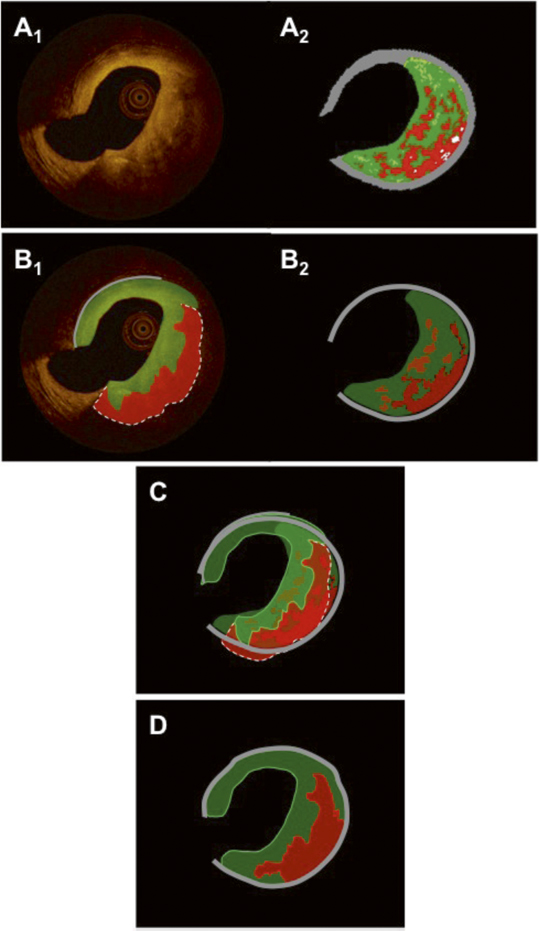
Figure 6. Panels A1 and A2 show the same matched OCT and IVUS-VH images as in Figure 5. Panels B1 and B2 show the resulting tissue maps after manual delineation of the visible tissue compartments according to validated criteria. Green indicates fibrous/fibro-fatty tissue; red, lipid tissue/necrotic core; and grey, media/EEM. The dotted line in the OCT image in panel B1 indicates that the deep contour of the lipid/necrotic region cannot be reliably traced. Panel C shows the superimposed tissue maps from panels B1-2 in which the necrotic core and parts of fibrous features coincide. The final fused result after weighting of the individual components and contours in the tissue maps, according to the algorithm in Table 1, is shown in panel D. Similar cross-sections as in Figure 5 are shown (OCT and IVUS-VH). A colour-coded tissue map was derived from the original OCT image. (B1). The dotted line indicates that the abluminal border zone of the necrotic core/lipid pool is not precisely traceable. In panel C, the tissue maps of OCT and IVUS-VH are fused and in panel D the final fusion is executed under the assumptions made in Table 1.
Calcifications
IVUS has a high sensitivity and specificity for the detection of calcifications8. However, as calcium is a potent ultrasound reflector, calcific deposits produce an acoustic shadowing, preventing the assessment of the configuration as well as the thickness and volume of calcific pools22. Occasionally, dense fibrous tissue may, by IVUS, produce an echo-dense signal and mimic a calcification. By OCT, calcific pools are in general well-defined and not associated with shadowing. This allows an accurate delineation and volumetric assessment, as long as they are not located too deep, as demonstrated in Figure 1 and Figure 2. In addition, the differentiation between dense fibrous tissue and calcifications is readily possible, as the attenuation and backscattering signal of the two tissue types are quite different10. However, when deeply located, calcifications may be confused with lipid pools and vice versa, as suggested by Manfrini and co-workers23 and, in these cases, IVUS may potentially aid in differentiation of the two. Taken together, fusion of the complementary information added by IVUS and OCT may improve the accuracy for the detection and quantification of calcium.
Assessment of vulnerability
One of the major objectives in cardiovascular medicine is the prospective identification of lesions that may later cause myocardial infarction or cardiac death. The histological lesion type suggested to be responsible for the majority of thrombosis-related cardiac deaths is the ruptured TCFA, composed of a necrotic core with an overlying thin fibrous cap, measuring <65 µm in 95% of these TCFA21. While the detection of lipid and necrotic tissue is unreliable with IVUS-GS due to a high inter- and intra-observer variability22, analysis of radio-frequency data (IVUS-VH) has proved to be useful for the identification of necrotic core8. As visualisation of the fibrous cap is not possible due to a limited resolution, a consensus was reached, stating that a TCFA can be diagnosed by IVUS-VH when the amount of confluent necrotic core exceeds 10% and is in direct contact with the lumen for >30 degrees of the circumference15,24.
As compared to IVUS, OCT has sufficient axial resolution to assess directly the cap thickness overlying signal-poor diffusely demarcated lipid pools/necrotic cores14,25, as well as to allow the evaluation of the structural integrity of the cap, as illustrated in Figure 3. Nevertheless, it should not be neglected that several features can obscure a correct TCFA diagnosis, including plaque-related components (e.g., macrophage accumulation) and various artefacts, which can mimic the appearance of a TCFA.
The fused approach in the setting of detecting TCFA potentially permits a more specific identification of this vulnerable plaque type, and may therefore increase the prognostic accuracy for future events. In this regard, the following criteria may be requested for the combined diagnosis of a vulnerable TCFA following fusion of OCT and IVUS: 1) IVUS-VH – presence of >10% confluent necrotic core; 2) OCT – presence of a diffusely demarcated signal-poor region, covered by a signal-rich fibrous cap <65 µm thick; 3) the findings of necrotic core by VH and lipid pool/necrotic core by OCT should naturally coincide within the same quadrant. It remains to be defined whether a summary of additional vulnerability criteria within the fused image (e.g., IVUS: remodelling index26, calcific nodules27; OCT: micro-channels28, calcific nodules, intra-plaque haemorrhages29, plaque rupture and erosions30) could further increase the accuracy to predict future events.
Combined OCT-IVUS probes
The major limitation of the methodology applied for fusion of IVUS and OCT is related to the sequential assessment of OCT and IVUS using two separate probes, as this necessitates a laborious matching procedure prior to offline fusion. Simultaneous assessment with the use of a combined IVUS-OCT catheter has recently been reported by Yin et al31,32. This group of engineers have demonstrated the feasibility of a simultaneous IVUS-OCT assessment, a “true” co-registration, in pathology specimens free of blood. To date, the need for full blood clearance during the OCT image acquisition constitutes the main limiting step for in vivo application of a combined IVUS-OCT probe for simultaneous acquisition. While blood prevents light transmission, it serves as an ideal medium to transmit ultrasound waves. Consequently, as blood clearance during the OCT pullback requires a short pullback time (to date 20 mm/sec) in order to reduce ischaemia, IVUS necessitates a much slower pullback speed (0.5-1.0 mm/sec).
Limitations
The images presented in this report were selected on the basis of their illustrative and didactic character, and it remains to be shown whether fusion is feasible in a broad spectrum of co-registered, matched cross-sections. As the imaging was performed in vivo, we were unable to investigate the diagnostic accuracy of a fused approach in comparison with histology. Finally, we have not used any imaging software specifically validated to create fused images. Therefore, the display of the presented images is purely exploratory, but may serve as a preamble for the further development of a dedicated software application. The distinction between necrotic core and lipid pool using OCT has not yet been validated. For this reason, we do not attempt to differentiate between the two tissue types, accepting that the fusion of VH necrotic core and OCT lipid pool/necrotic core cannot entirely correspond.
Conclusion
Offline fusion of co-registered IVUS and OCT is feasible and combines the strengths of both imaging modalities, potentially improving the diagnostic accuracy of plaque characterisation and offering an ideal platform to elaborate on new diagnostic algorithms that consider the individual strengths of both technologies. Offline fusion demonstrates the potential usefulness of a combined IVUS-OCT device that would allow for a simultaneous image acquisition and an online fusion.
Acknowledgements
L. Räber is the recipient of a research fellowship (SPUM) funded by the Swiss National Science Foundation, Bern, Switzerland. All images are courtesy of S. Windecker and L. Räber, Bern University Hospital, Bern, Switzerland.
Conflict of interest statement
The authors have no conflict of interest to declare.