Abstract
Aims: We aimed to assess the agreement between IVUS-NIRS and OCT to assess lipid plaques in patients with acute coronary syndromes or stable angina. In addition, the impact of both macrophages and calcifications was investigated.
Methods and results: Forty-three patients undergoing both IVUS-NIRS and OCT assessment of the culprit and/or non-culprit coronary lesions were enrolled. Cross-sections from lipid plaques, calcified plaques and normal-appearing vessel tracts were identified and matched with the two imaging techniques. Lipid arc was measured by both IVUS-NIRS and OCT. Macrophage presence and calcifications were also investigated with OCT. OCT detected a lipid plaque in 90 cross-sections (48.9%), with a sensitivity of 85.5% and a specificity of 69.7% as compared with IVUS-NIRS. The percentage of OCT false positive was 20.1% and of false negative was 4.9% for lipid plaque detection. The Pearson correlation coefficient for lipid arc was 0.675, p=0.0001. Macrophages were detected in 73% of OCT false positive cross-sections. Conversely, calcifications were present in 66.7% of OCT false negative cross-sections. The variability of lipid arc was independently associated with macrophages (beta=0.295, p=0.013).
Conclusions: Agreement between IVUS-NIRS and OCT for lipid plaque detection is suboptimal. The presence of macrophages and superficial calcifications on OCT negatively affects lipid detection.
Abbreviations
ACS: acute coronary syndromes
CI: confidence interval
IVUS-NIRS: intravascular ultrasound near-infrared spectroscopy
NSTEMI: non-ST-segment elevation myocardial infarction
OCT: optical coherence tomography
OR: odds ratio
PCI: percutaneous coronary intervention
ROC: receiver operating characteristic
SA: stable angina
SD: standard deviation
STEMI: ST-segment elevation myocardial infarction
UA: unstable angina
Introduction
Myocardial infarction is commonly caused by plaque rupture with subsequent thrombosis of a vulnerable plaque which is characterised by a large lipid content and a thin fibrous cap1. The correct identification and quantification of plaques with large lipid content is therefore a possible avenue to prevent myocardial infarction and sudden death2. Optical coherence tomography (OCT) is a high-resolution intravascular imaging technique capable of characterising coronary atherosclerosis. Although it has great potential to assess vulnerable plaques3, there are some reports showing that OCT accuracy in identifying necrotic lipid plaque may be suboptimal4,5 and that artefacts may lead to misinterpretation of OCT images6.
Intracoronary near-infrared spectroscopy (NIRS) can determine the chemical composition of atherosclerotic plaques, particularly lipid material, with high accuracy7,8. For this reason the study of lipid-rich plaque by means of intravascular ultrasound (IVUS) and NIRS combined in a single catheter represents an optimal solution to diagnose and quantify lipid plaques8,9. The aim of the study was to assess the agreement between IVUS-NIRS and OCT to assess lipid plaques.
Methods
STUDY POPULATION
From June 2014 to September 2015, forty-six consecutive patients presenting with either acute coronary syndromes (ACS) or stable angina (SA), scheduled for coronary angiography, were investigated using both IVUS-NIRS and OCT. All patients had to undergo both IVUS-NIRS and OCT assessment of the culprit/target and/or non-culprit/non-target coronary lesions at the index procedure and before stent implantation. Exclusion criteria were fever, malignancy, ostial left main and ostial right coronary involvement, extremely tortuous vessel or angiographic evidence of coronary dissection. The study was approved by the ethics committee of the hospital and all of the patients provided written informed consent at the time of the index procedure. The study was conducted according to the Declaration of Helsinki.
IVUS-NIRS AND OCT IMAGE ACQUISITION AND MATCHING PROCEDURE
Unfractionated heparin was administered during percutaneous coronary intervention (PCI), with a target activated clotting time of >250 seconds. A 0.014 inch guidewire was placed distally in the target vessel tract, and an intracoronary injection of 200 µg of nitroglycerine was given prior to IVUS-NIRS and OCT pullbacks.
A 3.2 Fr IVUS-NIRS catheter (LipiScan™ IVUS Coronary Imaging System; Infraredx, Burlington, MA, USA) was first employed to interrogate the target artery, at a speed of 0.5 mm/sec.
Subsequently, frequency domain OCT images were obtained in the same coronary segment, using a commercially available system (Dragonfly™; St. Jude Medical, St. Paul, MN, USA), at a pullback speed of 20 mm/s. During image acquisition, coronary blood flow was replaced by continuous flushing of contrast media, directly from the guiding catheter at a rate of 4 ml/s for the left system and 3 ml/s for the right coronary artery using an automated power injector, in order to create a virtually blood-free environment. To guarantee an optimal acquisition with both imaging techniques, the target lesions were treated with a gentle predilatation with undersized (1.5 mm) compliant balloons in case of severe coronary narrowing, and with manual thrombus aspiration in the presence of large thrombi in ACS patients. Acquired segments were located in the proximal coronary segments and had a minimum length of 50 mm.
IVUS-NIRS AND OCT IMAGE ANALYSES
Both IVUS-NIRS and OCT images were digitally stored and analysed off-line at the Rome Heart Research imaging core laboratory.
The matching procedure was conducted by an investigator (F. Prati) not involved in further analyses, who compared the IVUS-NIRS and OCT pullbacks side by side on separate screens. After having identified as anatomical landmarks the same side branch take-off in both pullbacks, coronary segments of interest containing a coronary plaque or a normal-appearing vessel tract were selected. To guarantee adequate alignment between the two techniques, only the cross-sections of the coronary segments of interest located at a distance less than 5 mm from anatomical landmarks were selected for matching (Figure 1).
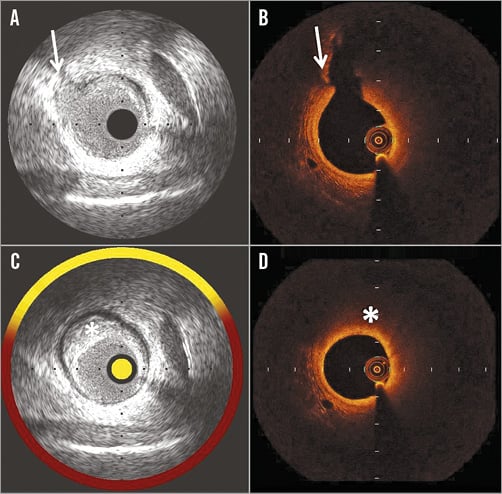
Figure 1. Example of cross-sections matching (A & B) and analysing (C & D) IVUS-NIRS and OCT images. A) IVUS shows a reference cross-section with an anatomical landmark (side branch take-off) indicated by an arrow. B) OCT showing the same reference cross-section with a side branch take-off (arrow). C) IVUS-NIRS cross-section with a lipid plaque (asterisk), identified for matching, and located 3 mm proximal to the reference cross-section (A). D) OCT shows the matched cross-section at the same distance (3 mm proximal) from the reference cross-section (B). A lipid plaque (asterisk) is shown.
The IVUS-NIRS-defined lipid arc was calculated using the colour-coded rim chemogram that surrounds the greyscale IVUS image. In the presence of a top 10th percentile probability value for lipid >0.98, the rim shows a yellow colour, tan for a probability value 0.84-0.97, orange for a value 0.57-0.84, and red for values <0.5710.
The lipid arc was calculated as the circumferential extent of yellow colour on the coded rim and a lipid plaque was defined as a plaque with a lipid arc extending for at least 90 degrees. If an OCT-imaged plaque contained a large lipid component (>90 degrees) plus calcium, according to the reader, the lesion was considered lipidic. Since, in the presence of small plaque burden, IVUS-NIRS may misinterpret pericardial fat for lipid material, a sub-analysis of plaques with an IVUS plaque burden greater than 40%11 was conducted. OCT analyses were performed with proprietary software after confirming proper calibration settings of the Z-offset.
The OCT-defined lipid arc was defined as the circumferential extent of lipid material imaged as a signal-poor region diffusely bordered by overlying signal-rich bands corresponding to a fibrous cap3,12,13. The delta lipid arc was calculated as the difference between the IVUS-NIRS- and OCT-defined lipid arcs. OCT-defined lipid plaque was defined as a plaque with a lipid arc greater than 90 degrees of the vessel circumference14.
OCT analysis also included luminal area, the presence of calcified plaque (imaged as well-delineated signal-poor regions with sharp borders)12 and normal-appearing coronary tract (imaged as three layers of tissue structure)15 and fibrous cap thickness.
Finally, the presence of macrophage clusters, which are imaged as strong linear images on plaque surface accompanied by high attenuation16, was confirmed applying a previously validated two-step algorithm using an OCT-derived tissue property software17.
INTRA-OBSERVER AND INTER-OBSERVER VARIABILITIES
After having selected the IVUS-NIRS and OCT pairs, image analyses were independently conducted by the two readers (L. Di Vito and V. Marco). The OCT readers were blinded to the results obtained with IVUS-NIRS.
The reproducibility of lipid plaque detection by OCT and IVUS-NIRS was addressed in all of the matched cross-sections. Lipid plaque detection was repeated by two independent observers to obtain the inter-observer variability. To determine the intra-observer variability, lipid plaque detection was analysed again by the same observer at least four weeks after the initial analysis.
STATISTICAL ANALYSIS
Statistical analysis was performed using SPSS, Version 17.0 (SPSS Inc., Chicago, IL, USA).
The sensitivity and specificity of OCT for lipid plaque detection were reported using both cross-section and vessel analysis levels. The vessel analysis was conducted defining a vessel as lipidic on IVUS-NIRS or OCT if one of the matched cross-sections of the entire vessel contained a lipid plaque. Categorical variables are presented as frequencies and were analysed with the chi-square test or Fisher’s exact test. The relationship between NIRS- and OCT-defined lipid arc was assessed by the Pearson correlation coefficient. Linear regression was performed to assess the impact of a set of factors on delta lipid arc (dependent variable). All the variables were entered en bloc into the model. The B coefficient and 95% confidence interval together with the beta coefficient were calculated for each independent variable. Logistic regression analysis was performed to assess the impact of four independent variables (macrophage and calcification presence, luminal area and lipid arc on OCT) on the presence of IVUS-NIRS-defined lipid plaque. The model was tested using Cox & Snell R-Square and Nagalkerke R-Square. A receiver operating characteristic (ROC) curve was constructed comparing the true positive rate (sensitivity) to the false positive rate of IVUS-NIRS-defined lipid plaques for identifying the best cut-off value for OCT lipid arc using Youden’s index. The sensitivity, specificity, negative predictive value, and positive predictive value were calculated using IVUS-NIRS analysis as the gold standard in order to identify the accuracy of OCT for identifying lipid plaques. Intra-observer and inter-observer differences were investigated with a kappa measure of agreement. A p-value <0.05 was considered significant.
Results
PATIENT FEATURES
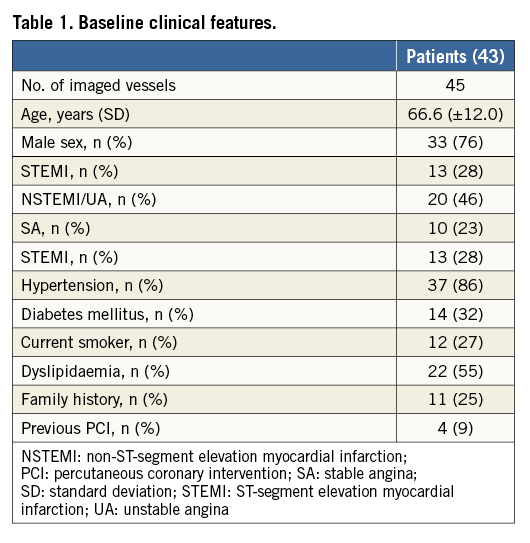
Of the 46 patients included in the study, two patients were excluded for suboptimal IVUS-NIRS images due to a large thrombus that affected OCT assessment despite removal attempts. An additional patient was excluded as readers were unable to guarantee an optimal matching of NIRS-IVUS and OCT images. Therefore, 43 cases entered the study. Most patients were male (76%), mainly treated for acute coronary syndromes (74%) (Table 1).
OCT ACCURACY FOR DETECTING LIPID PLAQUES AS COMPARED WITH IVUS-NIRS AT CROSS-SECTION ANALYSIS
An overall number of 184 paired OCT and IVUS-NIRS cross-sections were collected. IVUS-NIRS detected a lipid plaque in 62 (33.6%) out of 184 cross-sections. OCT detected a lipid plaque in 90 cross-sections (48.9%) (Table 2), with a sensitivity of 85.5% and a specificity of 69.7% (Table 3). The Pearson correlation coefficient between IVUS-NIRS-defined lipid arc and OCT-defined lipid arc, conducted for the entire number of paired cross-sections, was 0.675, p=0.0001 (Figure 2).
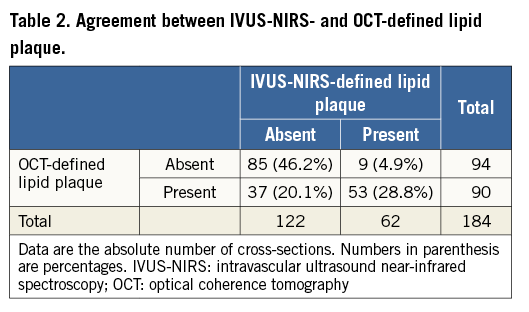
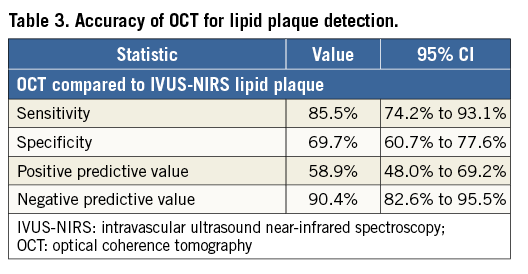
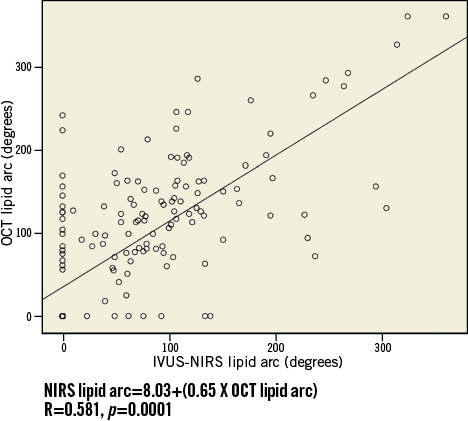
Figure 2. Correlation between IVUS-NIRS- and OCT-defined lipid arc measurements.
The mean value of lipid arc was 64.6±78.3 degrees for IVUS-NIRS and 85.9±85.8 degrees for OCT. The delta lipid arc was 40.6±50.9 degrees.
The Pearson correlation coefficient between IVUS-NIRS-defined lipid arc and fibrous cap thickness was -0.805, p=0.0001.
Twenty-one cross-sections of plaque had a small IVUS plaque burden (less than 40%), that could be misdiagnosed by NIRS. None of these cross-sections showed a lipid plaque by IVUS-NIRS.
OCT ACCURACY FOR DETECTING LIPID PLAQUES AS COMPARED WITH IVUS-NIRS AT VESSEL ANALYSIS
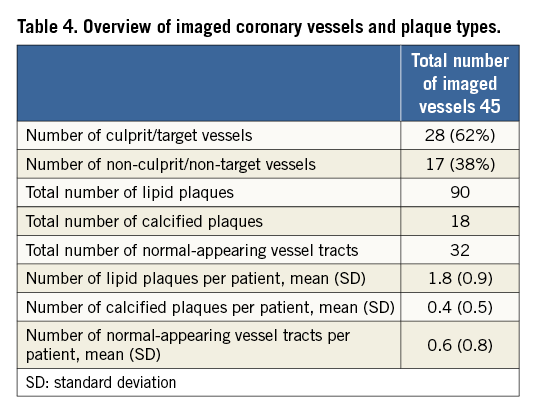
Forty-five vessels were imaged (Table 4). IVUS-NIRS detected vessels with lipids in 30 (66.7%) out of 45 imaged vessels, whilst OCT detected vessels with lipids in 37 (82.2%), with a sensitivity of 100% and a specificity of 53.3%.
IMPACT OF MACROPHAGE AND CALCIUM ON OCT LIPID PLAQUE DETECTION
Macrophage clusters were detected in 73% of the 27 OCT false positive cross-sections, in which a lipid plaque, that could not be seen on IVUS-NIRS, was visualised on OCT (Figure 3, Figure 4). Fibrous cap thickness was significantly lower in cross-sections with significant macrophage presence as compared to the others, being 148.5±48.8 µm and 175.2±53.9 µm, respectively, p=0.001.
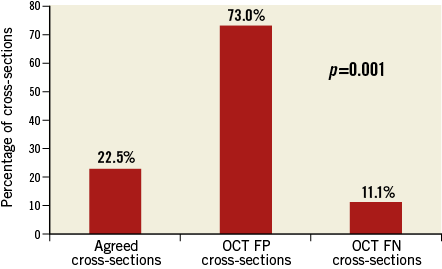
Figure 3. Prevalence of macrophage presence among agreed cross-sections and OCT false negative and OCT false positive cases. Macrophage presence was significantly higher in OCT FP cross-sections. FN: false negative; FP: false positive
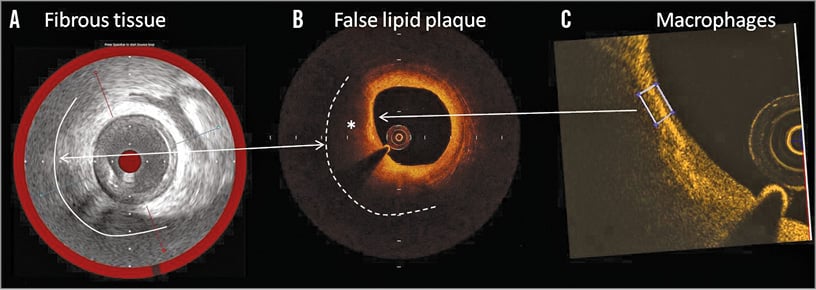
Figure 4. Example of an OCT false positive case for lipid detection. A) IVUS-NIRS shows a fibrotic plaque (white line) without lipid components as shown by the red coloured chemogram. B) The matched OCT cross-section shows a plaque with a highly attenuated signal (asterisk) indicative of a large lipid pool (white dashed line). C) Application in the same OCT cross-section of the OCT tissue property software to detect macrophages. A high 0.085 value of normalised standard deviation (white box) suggests the presence of macrophages.
Conversely, calcium was present in 66.7% of the OCT false negative cross-sections, in which IVUS-NIRS showed a lipid plaque that could not be seen on OCT (Figure 5, Figure 6).
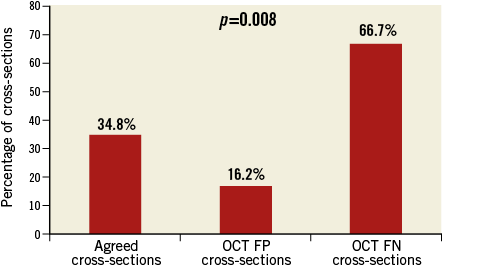
Figure 5. Prevalence of calcified plaques among agreed cross-sections and OCT false negative and OCT false positive cases. Calcified plaques were significantly higher in OCT FN cross-sections. FN: false negative; FP: false positive
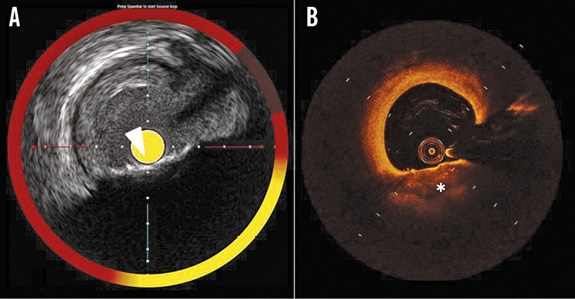
Figure 6. Example of an OCT false negative case for lipid detection. A) IVUS-NIRS shows a calcified plaque (arrowhead) with a deep lipid pool, as shown by the yellow coloured chemogram. B) The matched OCT cross-section shows a calcified plaque (asterisk) without lipids. The superficial calcification masks the deeper lipid pool.
Fifty-three cross-sections showed a lipid plaque using both techniques and were the true positive cases. In these cases, the lipid arc depicted by OCT was significantly greater than that depicted by IVUS-NIRS (175.9±68.7° and 158.1±70.9°, respectively, p=0.045). In the 53 true positive cases for lipid detection, 36 had a lipid arc difference between OCT and IVUS-NIRS greater than 10 degrees, and showed a significantly higher prevalence of macrophage as compared with the true positive cross-sections exhibiting a lipid arc difference less than 10 degrees (89.3% vs. 10.7%, respectively, p=0.001).
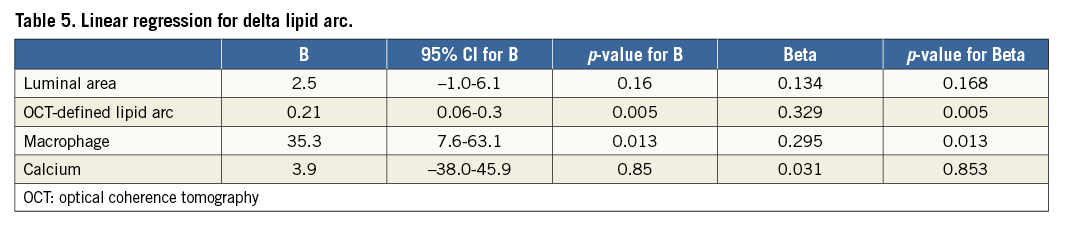
At linear regression analysis, the delta lipid arc was independently associated with significant macrophage presence (beta=0.295, p=0.013) and higher values of lipid arc (beta=0.329, p=0.005) (Table 5).
At logistic regression analysis, only two variables were independently associated with the presence of an IVUS-NIRS lipid plaque. The strongest predictor was the absence of macrophage as detected by OCT (OR=0.201, 95% CI: 0.070-0.583), followed by OCT lipid arc (OR=1.029, 95% CI: 1.020-1.038). The model explained between 36.7% (Cox & Snell R-Square) and 50.8% (Nagelkerke R-Square) of the variation of the dependent variable and correctly classified 87% of cases.
A ROC curve analysis was applied to assess the most accurate OCT lipid arc value able to identify IVUS-NIRS-defined lipid plaques. The OCT lipid arc had a significant area under the curve (0.852) (Figure 7). An OCT lipid arc value of 98 degrees was able to identify an IVUS-NIRS lipid plaque with a sensitivity of 80.6% and a specificity of 74.6%.
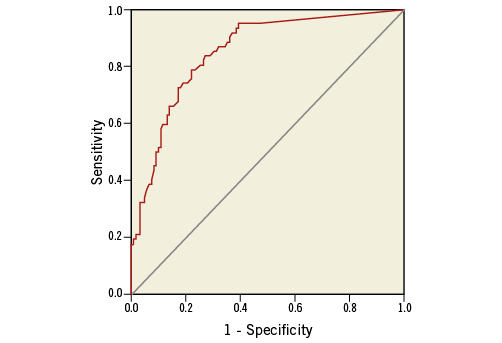
Figure 7. ROC curve of OCT lipid arc value for IVUS-NIRS-defined lipid plaque.
INTRA- AND INTER-OBSERVER AGREEMENT
We tested the degree of agreement for both OCT- and IVUS-NIRS-detected lipid plaques. The kappa measure of agreement for intra-observer agreement was 0.97 (p=0.0001) for OCT and 0.99 (p=0.0001) for IVUS-NIRS. Inter-observer variability for OCT and IVUS-NIRS was 0.93 (p=0.0001) and 0.96 (p=0.0001), respectively.
Discussion
The main findings of the study were the following:
1. Agreement between IVUS-NIRS and OCT for lipid plaque detection was suboptimal, with 20.1% false positive and 4.9% false negative cases.
2. The presence of macrophage clusters on OCT was significantly more common in false positive cases for lipid detection, whilst the presence of calcifications was significantly more common in false negative cases for lipid detection.
The main cause of acute coronary syndromes is the rupture of a vulnerable plaque with subsequent thrombus formation. With a resolution in the range of 20 µm, OCT enables the identification of important features of plaque vulnerability, such as the lumen area, circumferential extent of lipid pool, thickness of fibrous cap and inflammatory content12. OCT therefore has the potential to identify patients at risk of sudden death and myocardial infarction18. Furthermore, the identification of lipid plaques is precious information during interventional treatments, as the positioning of stent edges at sites with lipids may increase the risk of periprocedural complications2,19.
Yabushita et al were the first to show that OCT accuracy to identify lipid-necrotic plaques is suboptimal20. In fact, the authors reported a sensitivity and specificity ranging from 90% to 94% and 90% to 92%, respectively. Our in vivo study was designed to understand better the OCT ability to study lipid plaques, using IVUS-NIRS as the gold standard. IVUS-NIRS is a novel intracoronary imaging modality that combines intravascular ultrasound with near-infrared spectroscopy, detecting the presence of lipid components with high accuracy7,8. Importantly, we also explored the specific impact of tissue components such as macrophages and calcifications as imaged by OCT, that may have a role in limiting the accuracy of lipid plaque assessment.
We found that OCT can detect lipid plaques on IVUS-NIRS with a specificity of 69.7% and a sensitivity of 85.5%. Consistently, the overall correlation between the lipid arc calculated by OCT and IVUS-NIRS was modest.
ROLE OF MACROPHAGES AND LIPID POOLS AS CONFOUNDING VARIABLES
The present study revealed a low percentage of false negative cases of lipid plaque detection (4.9%) and a high percentage of false positive cases (20.1%), with macrophage clusters being detected in 73% of OCT false positive cases. Interestingly, macrophages were an obstacle for lipid plaque detection even in the subgroups of true positive results. In fact, a high prevalence of macrophage was identified in cross-sections with differences in lipid arc greater than 10 degrees.
This finding was not unexpected: in fact, dense macrophage infiltration, when imaged by OCT, tends to create a highly scattering layer that casts a dark shadow on the tissue behind, mimicking a lipid plaque5.
Our data are in line with those provided by Yonetsu et al who studied non-culprit plaques with OCT and IVUS-NIRS. They showed a non-optimal agreement between IVUS-NIRS lipid presence at the longitudinal chemogram and OCT identification of lipids with an 8% rate of both false positive and false negative cases10. Unlike Yonetsu et al, we applied a method based on the matching of the same coronary cross-section. This enabled the quantitative comparison of the circumferential extent of the lipid arc, with the two techniques proving the concept that, in general, OCT tends to overestimate lipid extent. Furthermore, our approach allowed us to investigate the impact of macrophages and calcium in those cases in which lipid pools were misdiagnosed. Calcifications were detected in 66.7% of OCT false negative results. The limited penetration depth of OCT (less than 1.0-1.5 mm in the presence of calcium) may be the reason why superficial calcifications can mask deep lipid pools, as previously suggested by Yabushita20.
The absence of macrophages predicted the correct OCT identification of an IVUS-NIRS lipid plaque.
As large pools of macrophages tend to have the same refraction index as lipid components21, in the present study we identified inflammatory cells, applying an algorithm that is based on two OCT-derived tissue property indices: the normalised standard deviation and the granulometry index17,22. This two-step algorithm has been validated previously, showing a sensitivity of 100% and a specificity of 96.8% for detecting a significant macrophage infiltration. Despite our efforts to identify and quantify macrophages better, we confirmed the previous findings, shedding light on the role of macrophage as a confounding variable to address and quantify lipid plaques.
Limitations
The present paper has some limitations. Firstly, there is no comparison with histology since this was an in vivo study. This may have led to a less accurate detection of macrophages. However, we applied a previously validated OCT-derived algorithm based on tissue property indices to make macrophage detection more reliable. Secondly, the matching between the IVUS-NIRS and OCT procedures is not easy; in fact, the pullback speed of OCT is much faster than that of IVUS-NIRS. To avoid a geographic mismatch, we performed an accurate matching based on the identification of anatomical landmarks. Thirdly, the enrolled population and the number of investigated lesions were relatively small, although the number of matched cross-sections was large enough to reach final conclusions. Fourthly, all patients first underwent IVUS-NIRS and subsequently OCT. The lack of an alternating sequence of imaging techniques may have induced a bias. Fifthly, IVUS-NIRS accuracy for identifying lipid plaques is suboptimal in the presence of a small amount of necrotic core8, as pericardial fat can be confused with lipid tissue. This should not have had an impact on the results as none of the OCT cross-sections with small plaque burden showed a lipid plaque by IVUS-NIRS. Sixthly, the role of superficial calcifications was not specifically investigated. However, superficial calcifications are thin plaque components that are unlikely to impair OCT analysis of deep lipid pools.
Conclusions
Agreement between IVUS-NIRS and OCT for lipid pool detection is suboptimal. The presence of macrophage clusters and superficial calcifications on OCT negatively affects lipid detection.
| Impact on daily practice Correct identification and quantification of lipid pools with OCT is very important during coronary interventions. The presence of residual lipid plaques, uncovered by the stent, is associated with an increased risk of periprocedural myocardial infarction. Also, the presence of lipids can influence the interventional strategy, suggesting a technical or pharmaceutical solution to avoid distal embolisation of lipid necrotic cores23-25. OCT is able to identify vulnerable plaques, characterised by large superficial lipid components. Thus, the precise assessment of lipid pools is key. Our findings further stress the current limitations of OCT technology to address lipid plaques, and highlight the confounding role of macrophages. This finding may help not to misinterpret plaque composition. |
Conflict of interest statement
The authors have no conflicts of interest to declare.