Abstract
Aims: Qualitative criteria for plaque tissue characterisation by OCT are well established, but quantitative methods lack systematic validation in vivo. High optical attenuation coefficient µt has been associated with unstable plaque features, such as lipid core. The purpose of this study was to validate optical coherence tomography (OCT) attenuation imaging for tissue characterisation in vivo, specifically to detect lipid core in coronary atherosclerotic plaques, and to evaluate quantitatively the ability of OCT attenuation imaging to differentiate thin-cap (TCFA) and thick-cap fibroatheroma (FA).
Methods and results: We prospectively enrolled 85 patients undergoing imaging of a native coronary segment by both OCT and near-infrared spectroscopy and intravascular ultrasound (NIRS-IVUS). Ninety-eight NIRS-positive 4 mm plaque segments were selected and matched to the OCT data. Two experienced OCT readers classified the plaque type using OCT criteria. A cap thickness of 65 μm was used to differentiate TCFA and FA. We computed an index of plaque attenuation (IPA) in the 4 mm blocks, and assessed the association of this index with plaque type. IPA differentiated between TCFA and FA (AUC=0.82 in ROC analysis; p<0.0001). LCBI was numerically, but not significantly, higher in TCFA compared to FA (p=0.097).
Conclusions: IPA is an unbiased reproducible measure of tissue optical properties. The fraction of pixels with attenuation coefficient ≥11 mm–1 can identify TCFA.
Introduction
Diagnosis and effective intervention on ischaemic heart disease benefits from early detection of coronary plaques that are likely to precipitate clinical events1. Plaque morphological features that have been associated with instability include a lipid-rich necrotic core, contained by a fragile layer of fibrous tissue and inflammation2. Forces exerted by variable blood pressure, or by intravascular devices used in percutaneous coronary interventions (PCI), may cause rupture of the fibrous cap, releasing thrombogenic material, and leading to acute coronary syndrome or periprocedural myocardial infarction (MI). Detection of lipid core plaques (LCP) has important implications for the guidance of coronary interventions, as LCP are a potential factor in periprocedural and future adverse events3-6. Intravascular optical coherence tomography (OCT) is gaining popularity as a tool for guidance of stent placement and optimisation7-9. Vessel wall composition can be assessed by qualitative interpretation of high-resolution images7,10. Quantification of tissue optical properties derived from OCT data may support image interpretation by user-independent tissue characterisation. The attenuation coefficient is a robust tissue optical parameter that has been proposed for tissue characterisation11,12. Necrotic core and macrophage infiltration, plaque features that are associated with impaired stability, have high attenuation compared to fibrous and calcified tissues13. Such analyses have recently been augmented with statistical image metrics to achieve tissue identification14.
A catheter-based intracoronary near-infrared reflection spectroscopy (NIRS) and intravascular ultrasound (IVUS) system has been used for lipid detection in vivo15,16. The analysis estimates the local probability for the presence of LCP in the wall of the artery. The system does not, however, provide information on the cap thickness, which is one of the important factors for determining plaque stability. Casuistry suggests17 that overall features (lipid by NIRS, high attenuation by OCT) coincide in images of diseased coronary arteries in patients. We have previously demonstrated the potential of optical attenuation coefficient by OCT as a tissue characterisation method in autopsy tissues13. To investigate atherosclerotic tissue characterisation in vivo, we conducted a clinical validation study by quantitative evaluation of the OCT-derived optical attenuation coefficient of LCP identified by NIRS-IVUS. Specifically, we investigated the potential of OCT attenuation imaging for differentiation of thin- and thick-cap fibroatheromas.
Methods
OC3T STUDY
The Optical Coherence Tomography Tissue Type (OC3T) study was a prospective single-centre study, performed at the Thoraxcenter, Erasmus MC, Rotterdam, The Netherlands. It enrolled 85 patients undergoing PCI for stable/unstable angina pectoris or acute MI. The study was carried out in accordance with the Declaration of Helsinki and was approved by the local ethical review committee. Patients with at least one coronary lesion requiring PCI were included in the study after providing written informed consent. At least 20 mm of native artery wall accessible to OCT and NIRS-IVUS imaging was required. Patients unable to provide written informed consent, under 18 years of age, with haemodynamic instability, cardiogenic shock and TIMI 0 flow at the target lesion were excluded.
Sequential OCT and NIRS-IVUS pullbacks were performed in a non-culprit native vessel segment. The imaging region was defined based on angiographic landmarks, such as side branch take-offs. The primary endpoint of the study was a quantification of the relation between OCT attenuation and plaque type, by OCT analysis and by correlation with NIRS.
NIRS-IVUS
The NIRS-IVUS images were acquired using a hybrid catheter (TVC Insight™ catheter; Infraredx, Burlington, MA, USA)16,18, in compliance with its instructions for use. An automated pullback (0.5 mm/s and 16 frames per second [fps]) acquired co-registered greyscale IVUS images with an estimated probability of LCP presence (pLCP) by NIRS, displayed as a colour-coded ring (yellow is high probability, red is low) (Figure 1A). A so-called “chemogram” displays the lipid probability as a fold-out map of the artery with co-ordinates of longitudinal and circumferential position (Figure 1B, upper panel).
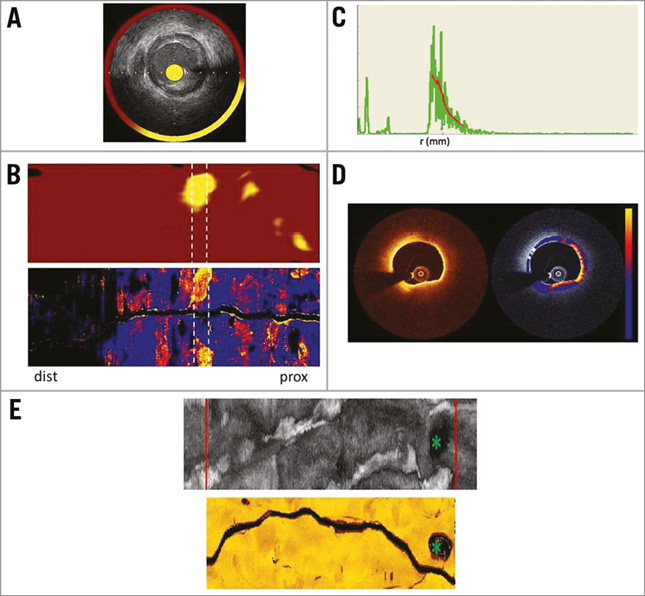
Figure 1. Image acquisition, registration, and display. A) Cross-sectional NIRS-IVUS image. B) Chemogram representing the probability of lipid in a coronary artery segment. White dotted lines indicate high LCBI4mm block in this pullback. Attenuation map of the same segment depicting the maximum attenuation coefficients in the entire vessel. White dotted lines indicate corresponding selected section. C) OCT A-line (green line) and fit with the signal model (red line). D) Cross-sectional image of OCT and the corresponding attenuation image (colour: blue-red-yellow representing 0-12 mm–1) overlaid on the OCT image (greyscale). E) IVUS and OCT fold-out map of a vessel with the largest side branch marked by green asterisk and the cropped region of the same physical length represented by red lines. dist: distal; prox: proximal
The lipid core burden index (LCBI) is a quantitative measure of coronary lipid, calculated as the fraction of chemogram pixels with pLCP >0.6 multiplied by a factor of 1,0004. LCBI represents the amount of LCP in the entire pullback on a 0-1,000 scale19. In addition to the overall LCBI, the LCBI4mm has been introduced4,5,20, which quantifies LCP in 4 mm segments.
OCT IMAGING AND IMAGE ANALYSIS
The OCT images were obtained with C7XR™ or Ilumien™ systems and the Dragonfly™ catheter (St. Jude Medical, St. Paul, MN, USA). Automated OCT pullback (20 mm/s and 100 fps) was performed during simultaneous iso-osmolar X-ray contrast medium (Visipaque 320; GE Healthcare, Little Chalfont, Buckinghamshire, UK) delivery through the guide catheter, using a power injector (Medrad® Mark V ProVis®; Bayer HealthCare LLC, Morristown, NJ, USA; typical flush rate 3.0 ml/s).
The resulting OCT images were then analysed, to quantify the attenuation coefficient of the tissues, by fitting a single scattering model to the OCT signal along each image line (Figure 1C)13:
![]() (1)
(1)
where T(r) accounts for catheter optics21, S(r) describes OCT system dependent signal changes with scan depth, and the parameter of interest is μt, the attenuation coefficient. The attenuation computation was performed in the polar image, outward from the edge of the lumen13,14. Custom software was implemented in MATLAB R2012b (The Mathworks, Inc., Natick, MA, USA), which generates an attenuation image for every OCT frame (Figure 1D). The accuracy of the extracted μt is approximately 1 mm−1 13.
To facilitate the comparison with NIRS-IVUS, we made a longitudinal map of the attenuation data similar to the chemogram. This display depicts tissue optical properties in the entire pullback, sampling a user-specified depth window for the maximum value of attenuation from the lumen border to the media, as shown in Figure 1B (lower panel). Such a map highlights lipid plaques and other strongly attenuating features in the entire pullback22 and corresponds well with a visual assessment of LCP in the OCT data by an expert reader23.
Analogous to the LCBI, we defined the index of plaque attenuation (IPA). IPA is the fraction of pixels in the attenuation map with an attenuation coefficient greater than a certain threshold x, multiplied by a factor of 1,000:
![]() (2)
(2)
IMAGE REGISTRATION AND SELECTION OF REGION OF INTEREST
Co-registration of the OCT- and NIRS-IVUS-derived data was achieved by “folding out” the OCT and IVUS pullbacks, as depicted in Figure 1E. The largest side branch within the imaged vessel segment was used as a landmark for longitudinal and angular registration. Subsequently, the maps were cropped to represent the same physical length (Figure 1E).
The regions of interest (ROIs) were selected from pullbacks with presence of lipid, i.e., LCBI >0. ROIs for analysis were selected as 4 mm sections with LCBI4mm >150. The threshold ensures presence of lipid in the majority of segments, but does allow small plaques to be analysed. In pullbacks with all LCBI4mm <150, the section with the highest LCBI4mm was selected. In the OCT data, we selected the 4 mm (20 frames) sections corresponding to the ROIs identified in the NIRS-IVUS pullbacks for attenuation analysis. In these OCT ROIs, we manually traced (using St. Jude Medical software) the contour separating the bright intima and dark media to exclude attenuation artefacts associated with the intima-media border. If the media was not visible in a region of an image, the contour in that sector was interpolated24. The media contour was used as the end of the sampling window per A-line for analysis of the maximum attenuation coefficient. Figure 1B depicts a matched chemogram and attenuation map.
PLAQUE CHARACTERISATION AND CAP MEASUREMENT
Two independent skilled readers (A. Karanasos and N.S. van Ditzhuijzen) analysed the plaque characteristics by OCT in all ROIs, after reviewing all 20 frames of each region. They classified plaque type and, if appropriate, performed a cap thickness measurement. The lesions were classified into fibrous, fibrocalcific (FC) and fibroatheroma (FA) using standard criteria7. Mixed plaques were classified as FA. In FAs, readers selected and measured the thinnest point of the cap in the ROI. Differences in plaque type and cap thickness, resulting from the freedom to choose the frame containing the thinnest cap25, were resolved by consensus. FA was classified according to cap thickness, using a threshold value of 65 µm to identify thin-cap fibroatheroma (TCFA)26.
STATISTICAL ANALYSIS
Continuous variables are presented as mean±SD, or median (interquartile range [IQR]), and nominal variables as n (%). A two-sided p-value (p<0.05) was used to establish significance. To establish the relation between lipid detected by NIRS and optical attenuation coefficient, we computed the correlation (Pearson’s r) between LCBI and IPAx for different values of x in all ROIs. We investigated the ability of LCBI and IPAx to distinguish between TCFA and FA by receiver operating curve (ROC) analysis, by varying the respective cut-off values, using the experts’ plaque classification as the gold standard. LCBI has not been validated for cap thickness; however, it is the only measurement available to the NIRS user and hence it is interesting to know whether a high LCBI is associated with high-risk plaque characteristics such as cap thickness.
Results
STUDY POPULATION AND PLAQUE CHARACTERISATION
A total of 85 patients who underwent both OCT and NIRS-IVUS imaging were included in the study between July 2012 and July 2013. The automated image analysis stringently requires all images in the segment of interest to be free of common image artefacts (e.g., blood in the OCT images), and demands a high accuracy in co-registration of OCT and NIRS-IVUS pullbacks. After the application of these criteria, 61 pullback data sets remained suitable and available for analysis. From the 61 patients’ data, the selection criteria resulted in 98 regions of 4 mm which formed the data set for analysis. The baseline characteristics of the analysed patients are shown in Table 1.
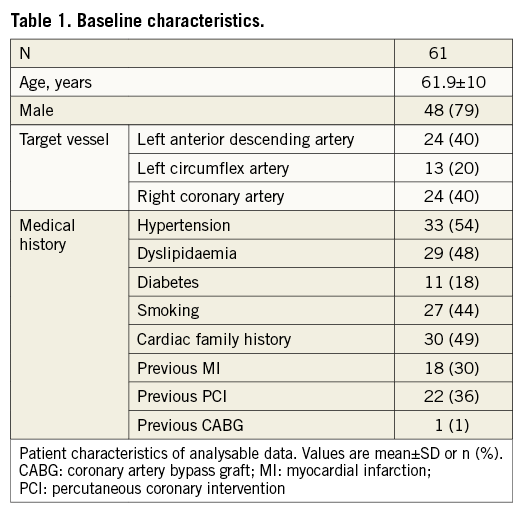
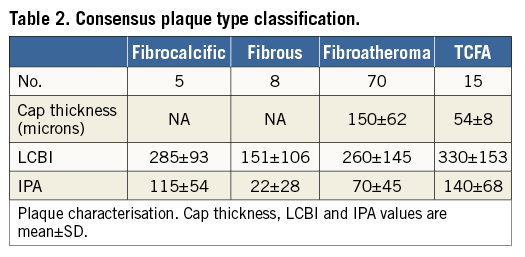
Table 2 presents the consensus plaque classification for all 98 segments of interest. Cap thickness measurements in the FA and TCFA categories and the LCBI and IPA values for all the categories are also listed.
DETECTION OF LIPID CORE PLAQUE AND THIN-CAP FIBROATHEROMA
The maximum correlation coefficient between LCBI4mm and IPAx was found for a threshold of x=6 mm–1, and equalled r=0.4.
Using the readers’ characterisation as classifier, ROC curves were made for IPA values with different attenuation thresholds x as well as for LCBI. IPA with a threshold x=11 mm−1 (denoted IPA11) was the strongest differentiator between FA and TCFA (AUC=0.825). Figure 2 shows the ROC curves for LCBI and IPA11. The optimal cut-off value of IPA11 is 110, minimising the distance between the curve and the upper corner of the graph27. IPA11 was significantly higher in TCFA compared to FA (p<0.0001) (Figure 3). Although the LCBI was also higher for TCFA than for FA, this difference did not reach significance (p=0.097). Table 2 shows the mean values with standard deviation for these variables.
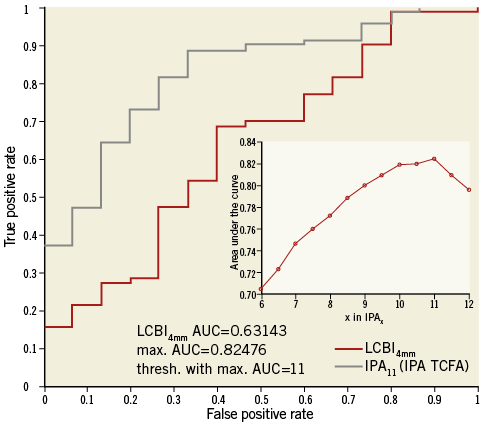
Figure 2. ROC curves for FA and TCFA differentiation. ROC curves of LCBI4mm and IPA11 for the differentiation between FA and TCFA. The inset plot shows the AUC for different thresholds “x” in IPAx. The AUC indicates that IPA11 has the optimal ability to differentiate FA and TCFA. AUC: area under the curve; FA: fibroatheroma; IPA: index of plaque attenuation; LCBI: lipid core burden index; TCFA: thin-cap fibroatheroma
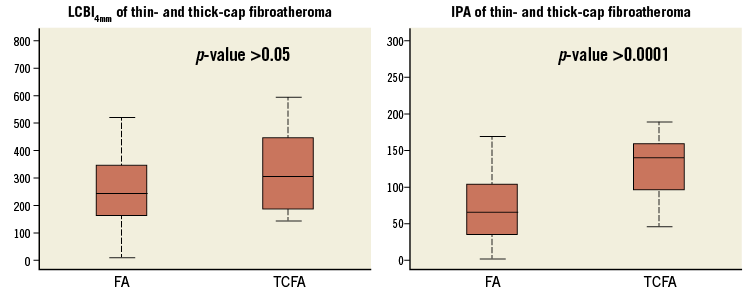
Figure 3. Box plot of LCBI and IPA values in thin-cap and thick-cap fibroatheromas. Median LCBI4mm was 242 (interquartile range [IQR]: 161-342) for FA, or TCFA 302 (IQR: 187-442) (p=0.10). Median IPA11 for FA was 60 (37-103) which was significantly lower than in TCFA (median 141 [98-159]; p<0.0001). IPA11 can significantly differentiate (p<0.0001) thin caps, unlike LCBI4mm (p>0.05). FA: fibroatheroma; IPA: index of plaque attenuation; LCBI: lipid core burden index; TCFA: thin-cap fibroatheroma
Discussion
This study introduces the index of plaque attenuation (IPA), a bias-free and reproducible summary measurement of attenuating structures in the coronary vessels. Highly attenuating features have been linked to histopathological markers of plaque vulnerability. This study aimed to validate optical attenuation as a plaque characterisation tool in vivo. The main finding of our study was that an OCT-derived marker of plaque attenuation, the fraction of image pixels with optical attenuation greater than 11 mm–1 (IPA11), can reliably differentiate between thin-cap and thick-cap FA. Lipid cores that lie deep in the vessel wall exhibit reduced attenuation in OCT images, which enables the discrimination of TCFA and FA by IPA11. The correlation between IPA and LCBI is modest, replicating the results based on comparative studies between qualitative OCT tissue characterisation and NIRS28. This finding indicates a limited specificity of optical attenuation to detect LCP overall. Fibrocalcific plaques in the data set also exhibit elevated IPA11, albeit significantly lower than TCFA (p=0.02). The contrast between FC and TCFA was similar for LCBI and IPA11, indicating lipid content in FC plaques. Previously published data on attenuation of purely (non-lipidic) calcified plaques show that these have low attenuation14,17. Our results reiterate that 4 mm LCBI was not designed to quantify cap thickness: it cannot reliably differentiate the thin-cap and thick-cap fibroatheroma.
The ability of NIRS-IVUS to detect the lipid core plaques that may cause periprocedural MI4 and STEMI20 has been shown before with the use of the maximum 4 mm LCBI to detect lipid core plaques, demonstrating how intravascular imaging can be a powerful tool to identify the lipid core plaques that may be unstable. Similarly, qualitative OCT assessment of plaque morphology offers potential to influence clinical decision making during PCI and risk assessment29, as with NIRS4. Automatic computation of OCT plaque attenuation can facilitate plaque characterisation in a complete pullback, without the need for time-consuming frame-by-frame inspection and manual measurements, which may have utility for interventional imaging. A realistic scenario for clinical implementation would run as follows: after acquisition, the lumen and media contours are segmented in the entire pullback automatically (this software is currently being developed in our institute30). Attenuation analysis is performed and shown in a carpet view (Figure 1B). Colour-coded IPA11 displayed on the longitudinal OCT section, similar to the block chemogram used in NIRS-IVUS, highlights the presence of TCFA, in sections with IPA11 >110. This information may then guide stent choice and placement. The utility of such a tool would need to be evaluated in a dedicated study enrolling a larger group of patients.
Limitations
This study has several limitations. The selection of plaques was based on the lipid positive regions identified with LCBI calculated from NIRS data. This means that the optical attenuation of non-lipid plaque was not included. Highly attenuating features that are not associated with LCP, such as superficial macrophage foam cells31, would reduce the specificity of OCT-based plaque detection. This is true also for qualitative OCT plaque characterisation, and is one of the major pitfalls in OCT image interpretation7,32. Attenuating features that are not associated with LCP also reduce the correlation between LCBI and IPA overall.
The spatial resolution and data complexity are quite different for NIRS and OCT. While NIRS is strictly not an imaging technology with a well-defined resolution, it is clear that the averaging kernel with which the vessel wall is sampled is much larger for NIRS than for OCT. Also, NIRS provides a single spectroscopic measurement per A-line. We reduced the information content of the OCT data to accommodate the validation of OCT attenuation by NIRS data. This simplification consisted of the reduction of the OCT measurements to a single value per A-line, and an area measurement of high attenuation per 4 mm segment. This procedure inevitably discards features that could be helpful in tissue characterisation. Further exploratory studies on clinical30 and ex vivo data are ongoing to address these limitations.
The pullback images, especially IVUS, suffer from longitudinal motion artefacts that result in imperfect co-registration33. Inclusion of multiple fiducial points may remedy this problem, but, as landmarks often appear multiple times in an IVUS pullback, this is a delicate procedure. Since we process the data in 4 mm blocks (larger than the anticipated mismatch), and do not require accurate circumferential image matching, the final effect on our quantitative data is limited.
Conclusion
We validated OCT-derived optical attenuation as a tissue characterisation tool. We expressed plaque attenuation in a local measure of highly attenuating tissue, the index of plaque attenuation (IPAx), where x is the threshold for high attenuation in mm–1. IPA11 can differentiate TCFA and FA with high sensitivity and specificity. This analysis might allow a fast and accurate TCFA detection in pullback data sets without requiring inspection of every individual frame.
Perspectives
COMPETENCY IN PATIENT CARE AND PROCEDURAL SKILLS
The newly introduced index of plaque attenuation enables a fast and reproducible interpretation of lesion type in the everyday clinical application of OCT.
TRANSLATIONAL OUTLOOK
Automated analysis of complete OCT pullbacks, which can indicate thin-cap lipid core plaques, can provide guidance in PCI.
| Impact on daily practice With the emergence of ever faster OCT systems, and the proven safety of multivessel scans, the amount of acquired data is growing. Comprehensive analysis of the data is often too time-consuming to be performed in a cathlab setting. The present study presents an algorithm that can support comprehensive interpretation of complete pullback data sets, by introducing a quantitative measure of tissue optics, the index of plaque attenuation, that points to areas with probably high-risk plaque. We foresee use of this parameter as a guide to the eye: regions with high IPA merit close (frame-by-frame) inspection, while low-IPA sections can potentially be inspected more cursorily. |
Guest Editor
This paper was guest edited by Takashi Akasaka, MD, PhD; Wakayama Medical University, Wakayama, Japan.
Acknowledgements
The authors acknowledge funding from the Dutch Heart Foundation (2010B064). The authors would also like to acknowledge Prof. Dr Yoshifumi Saijo, Dr Frank Gijsen, Dr Jolanda Wentzel and Dr Pieter Kruizinga for their contributions in the discussions. We thank Dr Thomas Johnson for critical commenting on the manuscript.
Conflict of interest statement
The Erasmus MC has a patent licensing agreement with Terumo Corporation. A.F.W. van der Steen and G. van Soest have the right to receive royalties as part of this agreement. The other authors have no conflicts of interest to declare. The Guest Editor has no conflicts of interest to declare.