Abstract
Background: Positive near-infrared spectroscopy (NIRS) signals might be encountered in areas without evident artery wall thickening, being typically perceived as artefacts.
Aims: We aimed to evaluate the utility of NIRS to identify artery wall regions associated with an increase in wall thickness (WT) as assessed by serial intravascular ultrasound (IVUS) and optical coherence tomography (OCT).
Methods: In this prospective, single-centre study, patients presenting with acute coronary syndrome (ACS) underwent NIRS-IVUS and OCT assessment of a non-culprit artery at baseline and 12-month follow-up. For each vessel, 1.5 mm segments were identified, matched and divided into 45 sectors. The relationship between the change in IVUS-based WT (DWT) and the presence of NIRS-positive signals and OCT-detected lipid was evaluated using linear mixed models.
Results: A total of 37 patients (38 vessels, 6,936 matched sectors) were analysed at baseline and 12 months. A total of 140/406 (34.5%) NIRS (+) sectors and 513/1,575 (32.6%) OCT-lipid (+) sectors were found to be located in thin (WT<0.5 mm) wall sectors. In the thin wall sectors, an increase in WT was significantly more pronounced in NIRS (+) vs NIRS (−) sectors (0.11 mm vs 0.06 mm, p<0.001). In the thick wall sectors, there was a decrease in WT observed that was less pronounced in the NIRS (+) versus NIRS (−) sectors (-0.08 mm vs −0.09 mm, p<0.001). Thin wall NIRS (+) OCT-lipid (+) sectors showed significant wall thickening (DWT=0.13 mm).
Conclusions: NIRS-positive signals in otherwise non-diseased arterial walls as assessed by IVUS could identify vessel wall regions prone to WT increase over 12-month follow-up. Our observations suggest that NIRS-positive signals in areas without evident wall thickening by IVUS should no longer be viewed as benign or imaging artefact.
Introduction
Intravascular ultrasound (IVUS) has emerged as the “gold standard” modality for assessing the evolution of coronary atherosclerosis12345678. Due to its penetration depth, IVUS allows for exact quantification of plaque volume and wall thickness (WT). Whereas greyscale IVUS is less sensitive in detecting plaque-specific predictors of progression such as lipids, the combined near-infrared spectroscopy (NIRS)-IVUS catheter allows for accurate detection of lipid content with exact co-localisation of volumetric assessment by IVUS. The added clinical value of NIRS was shown by several clinical studies linking lipid-rich plaque (LRP) to future cardiovascular events91011.
To date, little is known on the association between LRP as detected by NIRS, baseline WT and change in WT over time. The latter is of particular importance since NIRS-positive signals might be routinely recognised in areas without evident vessel wall thickening on IVUS. Such findings are considered benign or perceived as artefacts. However, pathophysiological work has indicated lipid influx as one of the earliest stages of atherosclerosis12. While the histopathology of the autopsied hearts revealed that non-fibroatheromas with NIRS-positive signals (vs non-fibroatheromas without NIRS-positive signals) were mostly pathological intimal thickening (50%), with a greater prevalence of histological lipid pool or calcified nodule13, the implications of positive NIRS signals, detected in otherwise non-diseased arteries as assessed by IVUS, have never been investigated in a prospective intravascular imaging study.
Our aim was to assess the change in WT in regions with NIRS-positive and NIRS-negative signals, with and without underlying plaque as detected by IVUS, using optical coherence tomography (OCT) to confirm the actual lipid presence within the artery wall.
We did so in a dedicated longitudinal follow-up study, with multimodality imaging of non-culprit arteries of patients presenting with acute coronary syndrome (ACS), and serial (baseline and 12-month) invasive imaging using NIRS-IVUS and OCT.
Methods
In this prospective, single-centre study, patients presenting with ACS successfully treated with percutaneous coronary intervention (PCI) underwent combined NIRS-IVUS and OCT assessment of a non-culprit coronary artery at baseline and at 12-month follow-up. All patients received guideline-recommended secondary prevention, including dual antiplatelet and lipid-lowering therapy14. Major exclusion criteria included: previous coronary artery bypass grafting, three-vessel disease, estimated glomerular filtration rate <50 ml/min, left ventricular ejection fraction <30% and atrial fibrillation. All patients provided written informed consent prior to enrolment. The study protocol was approved by the local ethics committee (MEC 2015-535, NL54519.078.15) and is registered (ISCRTN:43170100). The study was conducted in accordance with the Declaration of Helsinki (64th WMA general Assembly, Fortaleza, Brazil, October 2013) and the Medical Research Involving Human Subject Act (WMO).
NIRS-IVUS and OCT acquisition
A near-infrared intravascular ultrasound (NIRS-IVUS) pullback (TVC Insight Coronary Imaging Catheter; InfraRedX) (0.5 mm/s) and a 75 mm OCT acquisition (Dragonfly Optis Imaging Catheter; St. Jude Medical) (36 mm/s) were performed in the same non-stented non-culprit coronary segment with a minimum length of 30 mm and two readily identifiable side branches (diameter >1.5 mm). The study segment for invasive imaging was selected by the operator, based on the availability of optimal identifiable landmarks required for the matching of multimodality imaging data, the anticipated segment length and the feasibility of invasive local Doppler flow measurements in this cohort15.
IVUS analysis
First, IVUS-pullbacks were ECG-gated by selecting the frame recorded six frames before the R-peak, using in-house developed software (MATLAB V.2017B; Mathworks Inc.)16. As a result, changes in lumen size related to the movement of the catheter or pressure changes during the contraction of the heart were removed. The gated pullback had approximately one frame every 0.5 mm. Second, image analysis of the ECG-triggered IVUS pullbacks was performed using QCU-CMS software (Version 4.69; Division of Image Processing, Leiden University Medical Center); the external elastic membrane (EEM) and lumen borders were delineated semi-automatically. Vessel WT was determined as the distance between lumen and EEM contours. An intraobserver analysis was performed in a random sample of five IVUS pullbacks (748 frames) with at least two months interval between the initial and the repeated IVUS analysis. A good reproducibility of EEM area, lumen area, and plaque area (PA) was found with an interclass correlation coefficient of 0.996 (95% CI: 0.996–0.997), 0.983 (95% CI: 0.963–0.990), and 0.958 (95% CI: 0.939–0.970), respectively.
Since WT cannot be reliably quantified in regions with extensive calcification by IVUS1, sectors with calcifications >90° of the vessel circumference were excluded17. Likewise, sectors were excluded in case EEM was not reliably visualised by IVUS due to any other reasons (e.g., attenuation).
Subsequently, all IVUS-analysed wall sectors were stratified into thin (“plaque-free” WT<0.5 mm) or thick (“plaque-containing” WT ≥0.5 mm) wall sectors using the previously described WT cut-off value of 0.5 mm18.
OCT analysis
OCT pullbacks were analysed every millimetre (1 out of every 5 frames) using the QCU-CMS software following the previously published OCT analysis consensus standards1920. Lumen contours were delineated semi-automatically. Lipid-rich plaque or lipid-pool were identified manually by indicating the angles with the protractor on the lumen centre (Supplementary Appendix 1).
NIRS-IVUS and OCT matching and sector-level analyses
Baseline OCT data and segmented IVUS follow-up data were matched to the NIRS-IVUS baseline pullback, based on side branches visible in both modalities, both in longitudinal and axial direction. All matched pullbacks were divided into paired 1.5 mm segments and further divided into eight circumferential 45° sectors (Central Illustration). This division was selected to ensure maximal overlap of the baseline and follow-up IVUS data, thereby allowing a maximally detailed analysis of spatial heterogeneity of WT changes. Additionally in this study, in contrast to a cross-sectional plaque burden analysis used as a measure for disease burden (plaque area/vessel area ∗ 100), a relative PA (sectorial plaque area/sectorial vessel area sector ∗ 100%) was calculated15.
For each degree in circumference, the presence of NIRS-positive signals (a probability of 0.6 or higher for the presence of lipids), and the presence of OCT-detected lipid was determined. The sector was considered NIRS-positive or OCT-detected lipid positive in cases where the lipid content exceeded 50% of the sector area. Sectorial WT progression over the 12-month follow-up was defined as the difference between the 12-month and baseline WT (Central Illustration, Supplementary Figure 1, Supplementary Figure 2).
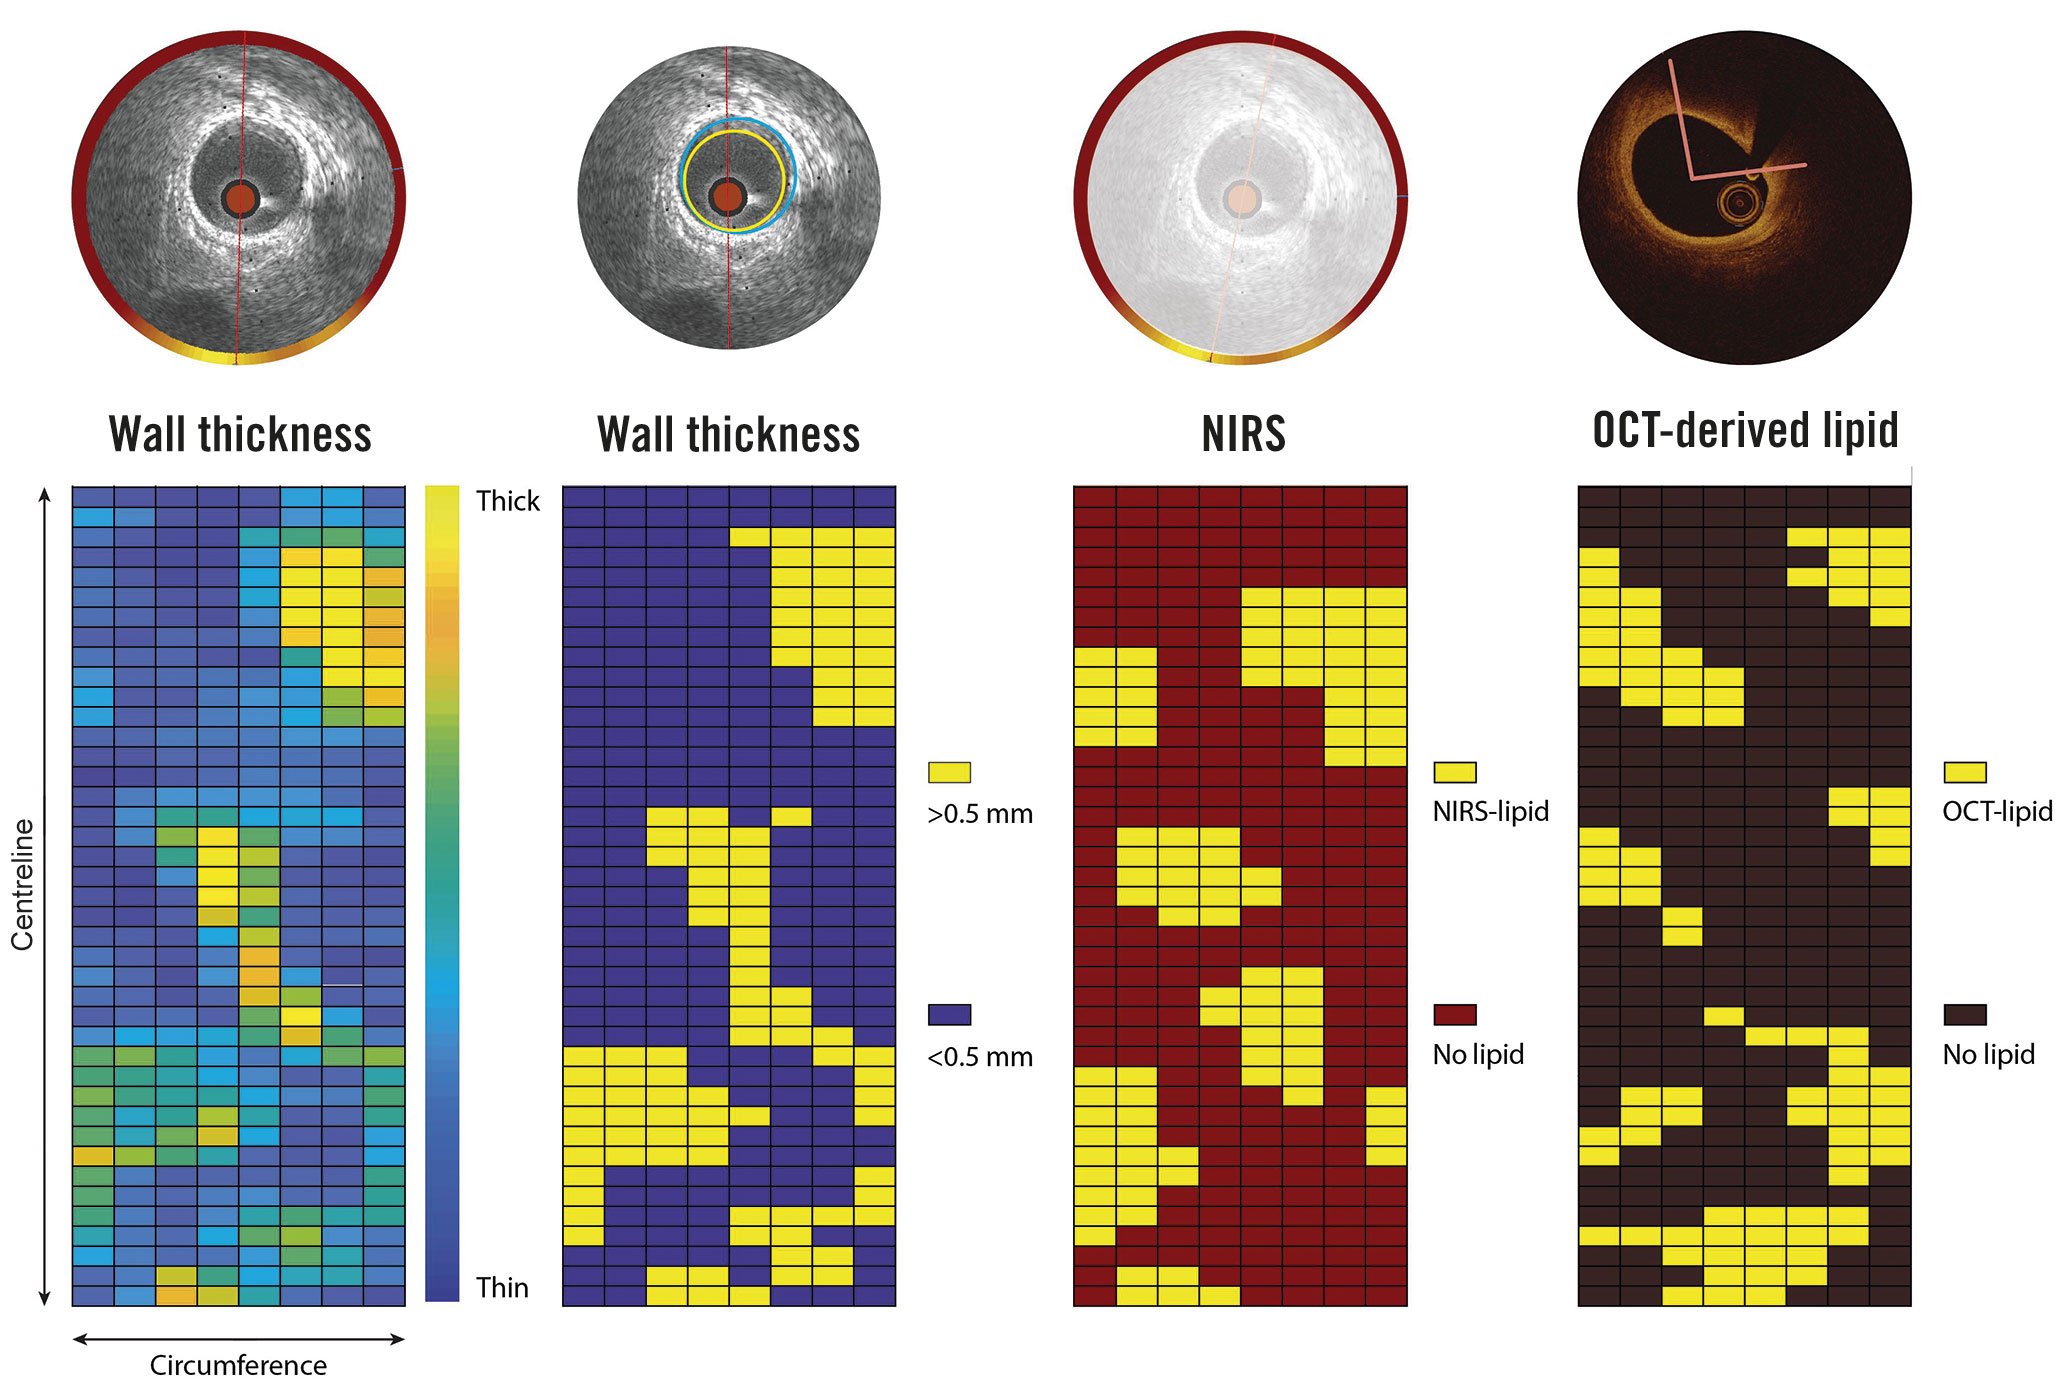
Central Illustration. Methodology of sectorial wall thickness quantification. A division into paired 1.5 mm segments of 45° sectors has been selected to ensure maximal overlap of the baseline and follow-up IVUS data, even in the presence of small registration errors (max ±1 IVUS frame), thereby maximally accounting for spatial heterogeneity in WT changes. NIRS: near-infrared spectroscopy; IVUS: intravascular ultrasound; OCT: optical coherence tomography; WT: wall thickness
Statistical analysis
Continuous variables with normal distribution are presented as mean±standard deviation (SD), data with non-normal distribution are presented as median (25th-75th percentile). Categorical variables are displayed as counts and percentages. Differences in frequency distributions were evaluated using χ2 tests. The association between the presence of lipid (by either NIRS or OCT) (independent variable) and the change in WT or sectorial PA (dependent variable) was analysed using linear mixed models. The presence of lipid was included as a fixed factor. To investigate the difference between plaque and plaque-free wall, the variable baseline WT was dichotomised (thin versus thick) and used as a fixed factor. Random effects were included to account for the presence of multiple sectors in each vessel. Moreover, an unstructured covariance and correlation matrix was used for the random effects to account for the covariances and correlations of the sectors. In figures presenting the association between the baseline NIRS signal or OCT-detected lipid and the change in WT (ΔWT), the estimated means and confidence intervals derived from these linear mixed models are presented. The Bonferroni correction was applied to adjust for multiple testing (repeating the analysis in above-described subgroups). Specifically, analyses were performed in the overall sectors as well as in the thin and thick wall sectors, as assessed by IVUS at baseline.
Statistical analyses were performed using the IBM SPSS Statistics 27.0 software. A two-sided p-value of <0.05 was considered as significant.
Results
Between March 2016 and March 2018, a total of 116 patients were screened based on preprocedural entry criteria and subsequently signed informed consent. Of them, 60 patients were excluded due to three-vessel disease or no anatomical landmarks in the non-stented/non-culprit vessel. Subsequently, a total of 56 patients with ACS were included in the study and underwent NIRS-IVUS and OCT assessment of a non-culprit coronary artery after successful treatment of the culprit lesion at baseline.
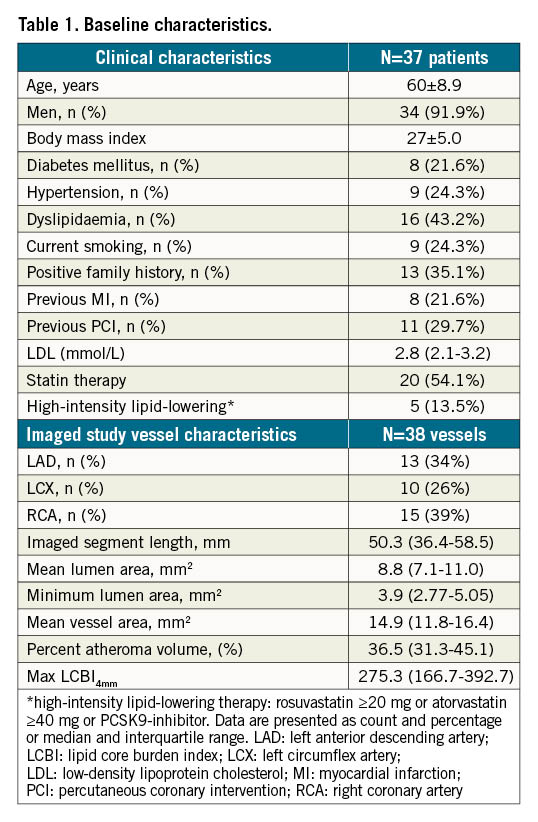
Three patients were excluded during the baseline procedure, four patients withdrew consent at the one-month follow-up, and eight patients refused consent for the one-year invasive imaging procedure. In one patient there was no possibility of matching between computed tomography and invasive imaging data. As a result, after successful treatment of the culprit lesion, a total of 40 patients with ACS underwent NIRS-IVUS and OCT assessment of a non-culprit coronary artery both at baseline and at 12-month follow-up. After excluding one patient due to insufficient quality NIRS data and two patients due to non-analysable OCT recordings, a total of 37 patients with 38 vessels were analysed at baseline and 12 months. Mean age was 60±8.9 years, 34 patients (91.7%) were male, 8 had diabetes (21.6%), and 16 (43.2%) presented with dyslipidaemia. The median low-density lipoprotein (LDL) level at time of enrolment was 2.8 (2.1-3.2) mmol/l. At baseline, 20 patients (54.1%) were on statin treatment (5 patients [13.5%] were on high-intensity lipid-lowering treatment) while at follow-up 33 patients (89.2%) were using lipid-lowering therapy (17 patients [45.9%] were on high-intensity lipid-lowering treatment). The baseline characteristics of the analysed population are detailed in Table 1.
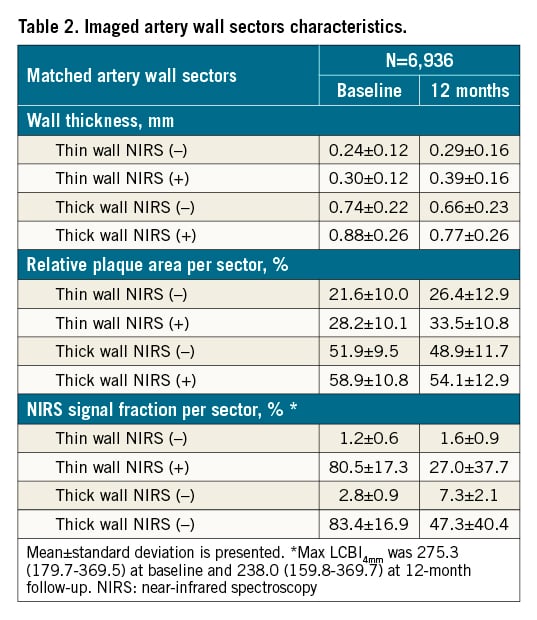
The median length of the analysed segment was 50.3 mm (36.4-58.5). After excluding sectors containing side branches or extensive (>90°) calcifications (Supplementary Table 1), 6,936 corresponding sectors were analysed at baseline and 12 months (Table 2). At baseline, calcifications (calcifications with the angle of <90°) were found in 123 (30.3%) out of 406 NIRS-positive sectors, whereas at 12-month follow-up calcifications were observed in a total of 122 (30.0%) out of 406 NIRS-positive sectors. Overall, there were 4,552 thin wall and 2,384 thick wall sectors identified by IVUS at baseline. The median baseline WT was 0.42 mm (0.17-0.61). NIRS- and OCT-lipid positivity was found in 140 (3.1%) and 513 (11.3%) of the 4,552 thin wall sectors, respectively.
Conversely, a total of 140/406 (34.5%) NIRS-positive sectors and 513/1,575 (32.6%) OCT-lipid positive sectors were found by IVUS to be located in sectors without vessel wall thickening at baseline (WT <0.5 mm) (Figure 1). The positive and negative predictive value of NIRS- versus OCT-detected lipid plaque is presented in the Supplementary Table 2.
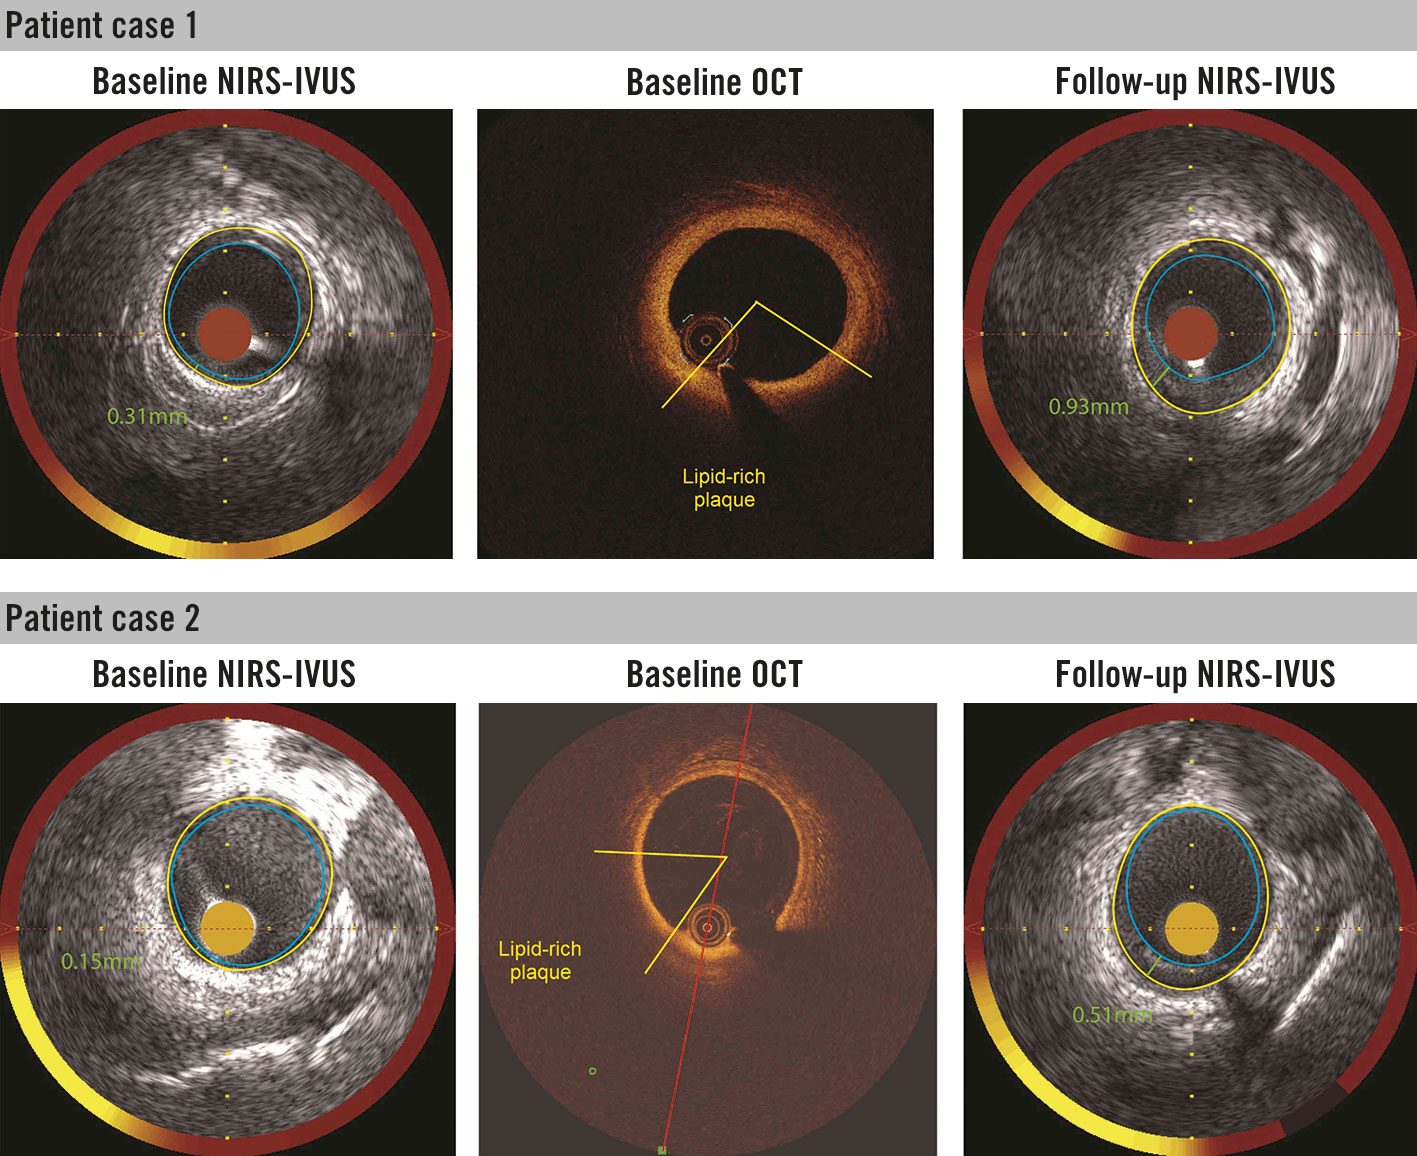
Figure 1. Presence of NIRS signal and lipid plaque by optical coherence tomography (OCT) in the plaque free wall region (wall thickness ≤0.5 mm) as assessed by IVUS at baseline. Corresponding (matched) NIRS-IVUS and OCT cross-sections are presented. Follow-up IVUS (at 12 months) revealed artery wall thickening in the baseline NIRS-positive and OCT-lipid positive sectors. IVUS: intravascular ultrasound; NIRS: near-infrared spectroscopy
Changes in wall thickness over 12-month follow-up
A total of 37 patients (38 vessels, 6,936 matched sectors) were analysed at baseline and 12 months. A total of 140/406 (34.5%) NIRS (+) sectors and 513/1,575 (32.6%) OCT-lipid (+) sectors were found to be located in the thin (WT<0.5 mm) wall sectors. In the thin wall sectors, an increase in WT was significantly more pronounced in NIRS (+) than in NIRS (−) sectors: 0.11 mm (95% CI: 0.08-0.13) vs 0.06 mm (95% CI: 0.05-0.08), p<0.001. In the thick wall sectors, a decrease was observed in WT that was less pronounced in NIRS (+) than in NIRS (−) sectors: −0.08 mm (95% CI: −0.10 - −0.05) vs −0.09 mm (95% CI: −0.10 - −0.07), p<0.001 (Figure 2).
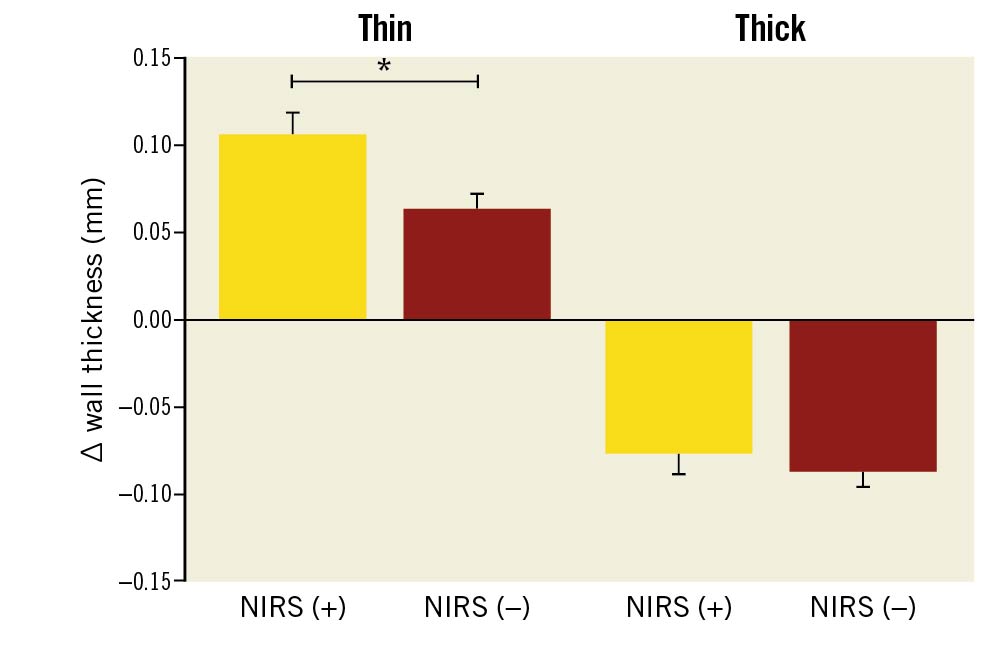
Figure 2. Wall thickness progression in thin and thick artery wall sectors, as assessed by IVUS at baseline, stratified for the presence and absence of NIRS signal. Yellow: NIRS-positive sectors (NIRS [+]); red: NIRS-negative sectors (NIRS [−]); thin (plaque-free) <0.5 mm wall thickness by IVUS; thick ≥0.5 mm wall thickness by IVUS. * p<0.001.
Similarly, the thin wall sectors with and OCT-detected lipids showed significantly greater WT increase than the thin wall sectors with no OCT-detected lipids: 0.11 mm (95% CI: 0.7-0.14) vs 0.6 mm (95% CI: 0.04-0.08), p<0.001 (Figure 3).
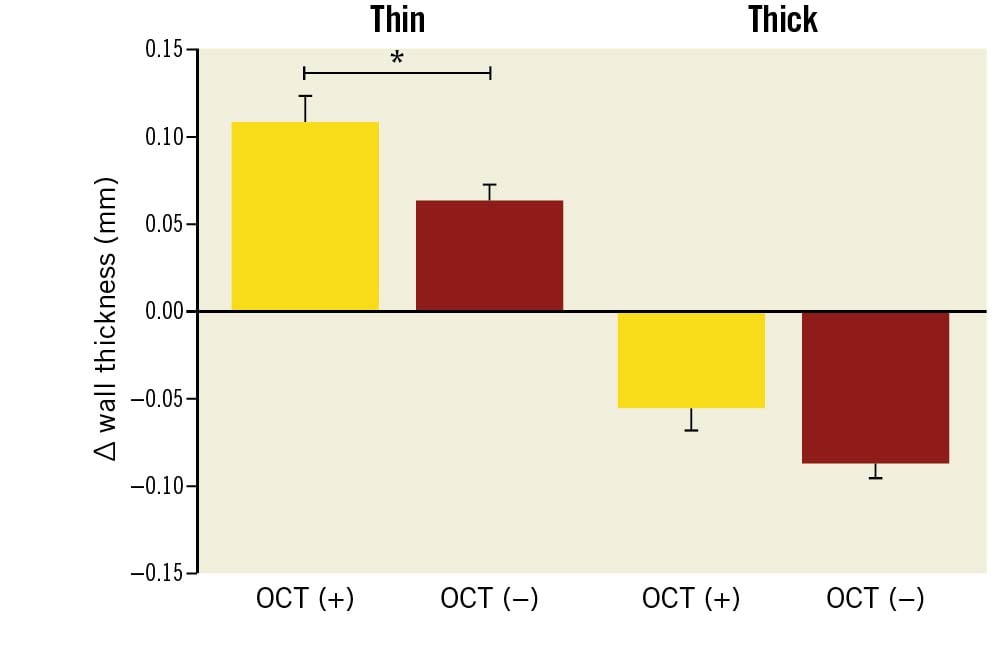
Figure 3. Wall thickness progression in thin and thick artery wall sectors, as assessed by IVUS at baseline, stratified for the presence and absence of OCT-detected lipid plaque. Yellow: OCT-lipid plaque positive sectors (OCT [+]); red: OCT-lipid plaque negative sectors (OCT [−]); thin (plaque-free) <0.5 mm wall thickness by IVUS; thick ≥0.5 mm wall thickness by IVUS. * p<0.001. IVUS: intravascular ultrasound; NIRS: near-infrared spectroscopy; OCT: optical coherence tomography
The thin wall NIRS (+) OCT-lipid (+) sectors showed significant wall thickening (∆WT=0.13 mm [95% CI: 0.08-0.17]) over 12 months of follow-up (Figure 4). Similar patterns were observed in the changes of relative PA per sector (Supplementary Appendix 2, Supplementary Figure 3-Supplementary Figure 5).
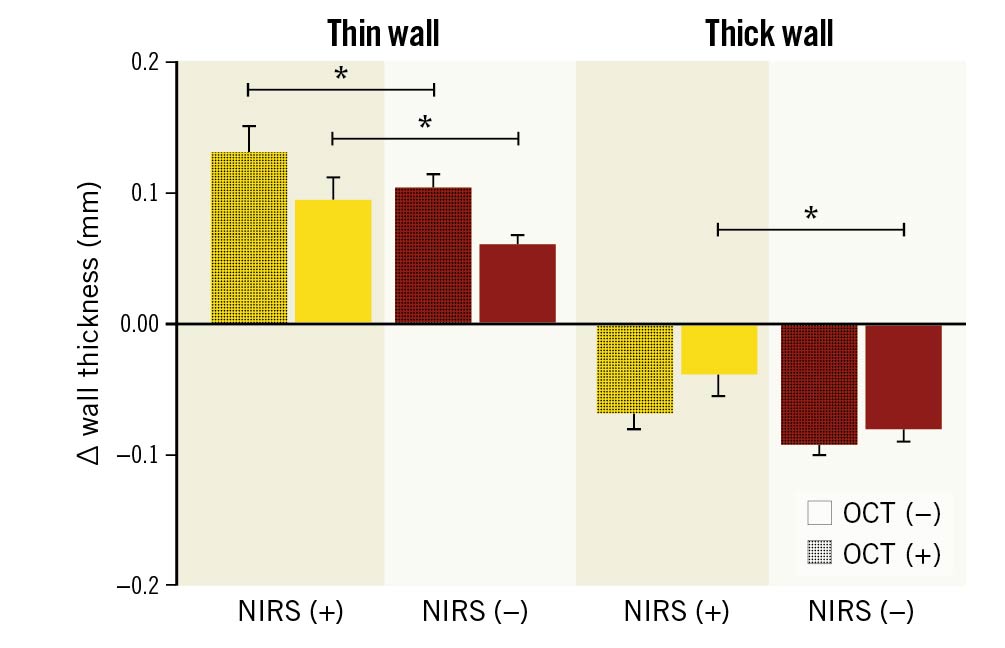
Figure 4. Wall thickness progression in thin and thick wall sectors, stratified by NIRS- and OCT-detected lipid plaque. Yellow: NIRS-positive sectors (NIRS [+]); red: NIRS-negative sectors (NIRS [−]); thin (plaque-free) <0.5 mm wall thickness by IVUS; thick; ≥0.5 mm wall thickness by IVUS. OCT (−) sectors that did not demonstrate lipid on OCT; OCT (+): sectors that demonstrated lipid on OCT; *p<0.001. IVUS: intravascular ultrasound; NIRS: near-infrared spectroscopy; OCT: optical coherence tomography
Analyses adjusted for high-intensity statin use, LDL level and presence of diabetes brought consistent results (Supplementary Table 3–Supplementary Table 6).
Discussion
The salient findings of this serial multimodality NIRS-IVUS and OCT imaging investigation could be summarised as follows:
- Surprisingly, nearly one-third of all identified NIRS-positive sectors and one-third of the overall OCT-detected lipid sectors were found in thin-wall non-culprit coronary artery regions, otherwise considered as “plaque-free” sectors by IVUS, with baseline WT <0.5 mm.
- NIRS signals imaged at baseline in thin artery wall regions were consistently associated with high WT increase at 12-month follow-up, suggesting that NIRS evaluation of non-culprit coronary arteries by IVUS could indicate the regions with ongoing plaque initiation (before any structural plaque features become detectable by IVUS).
To the best of our knowledge, this is the first in-human demonstration of the association between NIRS signals, OCT-confirmed lipid content and subsequent long-term plaque progression. Previously, Patel et al showed in diabetic and hypercholesterolaemic pigs that 88% of NIRS (+) lesions developed into a fibroatheroma over nine months of follow-up21. In the present study, baseline NIRS-positivity proved to be associated with more pronounced WT increase at 12 months in non-culprit segments of patients presenting with ACS. Interestingly, the observed WT increase in NIRS (+) regions was not restricted to regions with clearly visible plaque (WT >0.5 mm). Plaque growth was found to be significantly increased in NIRS (+) thin wall regions, to date typically perceived as non-diseased arteries by IVUS1. It therefore may be hypothesised that NIRS “chemically” captures the very early stages of plaque growth, characterised by intracellular lipid influx and accumulation12, even before it translates into the structural changes visible by IVUS1. These findings above could have important clinical implications given that NIRS signals in artery regions without IVUS-defined wall thickening are typically considered as “artefact”.
Considering the anticipated value of further division of the cross-sectional artery wall segments into sectors in the studies of coronary atherosclerosis22, we have chosen to evaluate plaque progression at a sector level, analysing the sectorial changes in WT as the outcome measure in this study. By doing so, significant granularity was added to our methods which allowed us to precisely characterise the local heterogeneity in plaque growth, extending the observations from prior studies that described changes in cross-sectional plaque burden only123452324.
The risk of major adverse cardiac events proved to increase with higher intraplaque lipid content. Patients with a maximum lipid core burden index in a 4 mm length of artery (maxLCBI4mm) ≥400 lesion, were at a four-fold higher risk of future events as compared to those with a maxLCBI4mm <40011. Recently, a cross-sectional in vivo analysis of the morphological features of NIRS-detected lipid-rich plaques showed that NIRS-positive plaques exhibit OCT and IVUS features of presumed plaque vulnerability, correlating positively with increasing lipid content25. Yamamoto et al previously reported that OCT-detected lipid component is a precursor for a rapid plaque progression24. Our work extends these observations by demonstrating that NIRS-positivity can act as a predictor of plaque growth in non-culprit coronary arteries of ACS patients, even in thin wall artery regions.
In the present study, NIRS (+) thin wall regions were apparent despite statin use at baseline in 54% of patients while the plaque growth at 12 months should be interpreted in light of the routine high-intensity statin recommendation post-ACS in all individuals; high-intensity statin therapy has been associated with plaque stabilisation or regression in previous studies. The latter might stimulate future research assessing the impact of more aggressive and costly lipid-lowering therapy including novel agents such as PCSK9 antagonists, even in case the positive NIRS signals are imaged within thin – apparently non-diseased – artery regions, as assessed by IVUS. In the present study, high-intensity statins or PCSK9 inhibitors were administered in less than half of the patients over the course of the study, indicating a potential for streamlined imaging-based uptitration of costly adjunctive lipid-lowering therapy. Nevertheless, the clinical benefits of such a therapeutic approach would need to be confirmed in a dedicated randomised trial.
Limitations
Although the presented study is the largest to date focusing on serial invasive imaging with combined use of NIRS-IVUS and OCT to study plaque progression, our findings warrant confirmation in larger studies. Despite IVUS’s ability to generate high-resolution images of the entire thickness of the coronary artery wall, permitting evaluation of the entire burden of atherosclerotic plaque, it has been shown that large calcification may hinder reliable assessment of wall thickness by IVUS1. Given the abovementioned considerations, artery wall regions with large calcium deposits (>90° of vessel circumference) have been excluded from the present analysis1726. As a result, our study was not designed to determine the association between the presence of calcifications at baseline and plaque progression26.
The threshold for the division of artery wall regions into 1.5 mm 45° sectors has been chosen to enhance matching accuracy. These matching/post-processing procedures were internally validated and demonstrated a high reproducibility and accuracy of sector matching; still, some minimal degree mismatch between the regions of interests analysed by the two intravascular imaging modalities, as well as the follow-up pullback, cannot be excluded.
Arguably, the lipid lowering therapy in our cohort was subpar per society guidelines that recommend high-dose statins in the context of ACS. Yet routine clinical follow-up was typically performed outside our tertiary care institution and might reflect real world practice in which more than 50% of patients treated with statins do not achieve their target LDL-C levels or cannot tolerate effective statin doses27.
Conclusions
NIRS-positive signals and OCT-detected lipid plaque components at baseline in non-culprit coronary arteries could identify wall regions prone to WT increase over 12-month follow-up. NIRS-positive signals and OCT-derived lipid plaque might be detected in otherwise non-diseased vessel wall arteries as assessed by IVUS, having a value as predictors of early plaque growth and plaque progression in non-culprit coronary arteries. Therefore, NIRS-positive signals in areas without evident wall thickening by IVUS should no longer be viewed as benign or imaging artefact in clinical practice.
Impact on daily practice
NIRS-positive signals in otherwise non-diseased arterial walls as assessed by IVUS – typically perceived as artefacts – could identify vessel wall regions prone for wall thickness increase over 12-month follow-up.
Such positive NIRS signals within the areas without evident artery wall thickening might represent a very early stage of coronary atherosclerosis and thus have a value as predictors of early plaque development in non-culprit coronary arteries.
Insights from this dedicated, serial, multimodality, intravascular imaging study improve the understanding of the natural course of coronary atherosclerosis and in this context, especially early stages of atherosclerosis could help to identify potential therapeutic targets.
NIRS-positive signals in areas without evident wall thickening by IVUS should no longer be viewed as benign or imaging artefact.
Funding
This work was supported by the European Research Council, Brussels, Belgium (grant number 310457).
Conflict of interest statement
M. Tomaniak acknowledges funding as the laureate of the European Society of Cardiology Research and Training Program in the form of the ESC 2018 Grant (T-2018-19628). N. Van Mieghem received research grant support from Medtronic, Abbott Vascular, Boston Scientific, Pulse Cath BV, Abiomed and Daiichi Sankyo. J. J. Wentzel was supported by a grant from ERC (310457). J. Daemen received institutional grant/research support from Astra Zeneca, Abbott Vascular, Boston Scientific, ACIST Medical, Medtronic, Microport, Pie Medical, and ReCor Medical. The other authors have no conflicts of interest to declare.
Supplementary data
To read the full content of this article, please download the PDF.