Abstract
Aims: We aimed to determine whether intravascular ultrasound (IVUS) and near infrared spectroscopy (NIRS) could identify arteries which would subsequently develop a thin-cap fibroatheroma (TCFA).
Methods and results: Three-vessel angiography, IVUS and NIRS evaluations were performed at three, six and nine months after induction of diabetes mellitus and hypercholesterolaemia in 13 Yorkshire pigs (n=37 arteries). In vivo total arterial plaque plus media (P+M) area, echo-attenuated plaque (AP) area by IVUS, and lipid core burden index (LCBI) by NIRS were compared to histology at nine months. P+M mean area increased over time (3 vs. 6 months p<0.01; 6 vs. 9 months p<0.01), as did the AP area and mean LCBI between three and six months (p<0.01). There were 69 TCFAs within 18 arteries. The mean LCBI at six months was greater in arteries containing a TCFA (77.8±17.4 vs. 34.3±11.4; p=0.04) as was the ∆LCBI from three to six months (55.3±16.9 vs. 3.3±16.0; p=0.03). Arteries which contained TCFA at nine months had greater AP area by IVUS at six months (p=0.007).
Conclusions: The early and persistent accumulation of total arterial lipid detected by NIRS was associated with the future development of TCFAs.
Abbreviations
AP: attenuated plaque
DM: diabetes mellitus
HC: hypercholesterolaemia
IVUS: intravascular ultrasound
LCBI: lipid core burden index
NIRS: near infrared spectroscopy
P+M: plaque plus media
TCFA: thin-cap fibroatheroma
ThCFA: thick-cap fibroatheroma
Introduction
Rupture of a thin-cap fibroatheroma (TCFA) is the dominant mechanism underlying acute coronary syndromes and ischaemic sudden death1. TCFAs possess a thin fibrous cap infiltrated by macrophages with rare smooth muscle cells, overlying a large necrotic core1. Coronary angiography cannot effectively identify histological hallmarks of high-risk lesions with a propensity for future instability. However, invasive diagnostic systems can lend insight into plaque structure, composition, and haemodynamic significance.
By measuring the wavelength-dependent interaction of electromagnetic radiation with matter, near infrared spectroscopy (NIRS) can measure the unique chemical signatures in tissue. The variable absorption and scattering tissue properties at various wavelengths yield a spectroscopic signature that can identify specific tissue compositions. Early work in the field demonstrated that NIR spectra could accurately characterise low-density lipoprotein cholesterol, cholesterol, and cholesterol esters in both animal models and humans2. Intravascular NIRS (InfraReDx Corp, Burlington, MA, USA) identifies lipid deposition within the arterial wall and has been shown to determine the presence of lipid core plaques accurately3.
We have previously demonstrated that the combination of NIRS and intravascular ultrasound (IVUS) detects and localises the presence of a high-risk coronary fibroatheroma, demonstrating increased inflammation and cellular apoptosis within the fibrous cap in diabetic/hypercholesterolaemic (DM/HC) pigs4. However, the rate of lipid accumulation at the arterial level and its relationship to the future development of TCFAs within that artery are unknown. An understanding of the development and natural history of the vulnerable artery may ultimately provide an improved ability to risk stratify patients, measure vascular response to novel pharmaceutical agents, and aid in targeting those arteries with an increased propensity for TCFA development. Hence, the goal of the current study was to identify vulnerable arteries which would develop TCFAs. The DM/HC porcine model, which develops high-risk human-like atherosclerotic lesions, was employed5,6, and progression of atherosclerosis was measured by IVUS and lipid deposition by NIRS.
Methods
ANIMAL MODEL
Invasive studies were performed in 13 male DM/HC-induced Yorkshire swine (25-30 kg; Archer Farms, Darlington, MD, USA) (Figure 1). DM, defined as a consistent blood glucose level >150 mg/dL, was successfully induced and maintained with a single intravenous injection of 125 mg/kg of the β-cell cytotoxin streptozotocin (Sicor Pharmaceuticals, Irvine, CA, USA). Animals were fed a diet containing 0.5% cholesterol, 5% lard and 1.5% sodium cholate (Animal Specialties and Provisions Inc., Quakertown, PA, USA) to achieve hypercholesterolaemia. Serum glucose and cholesterol levels and weight were monitored throughout the study. To reduce the risk of ketoacidosis, insulin was administered when the serum glucose level was >350 mg/dL6. The study was approved by the Institutional Animal Care and Use Committee (IACUC) of the University of Pennsylvania.
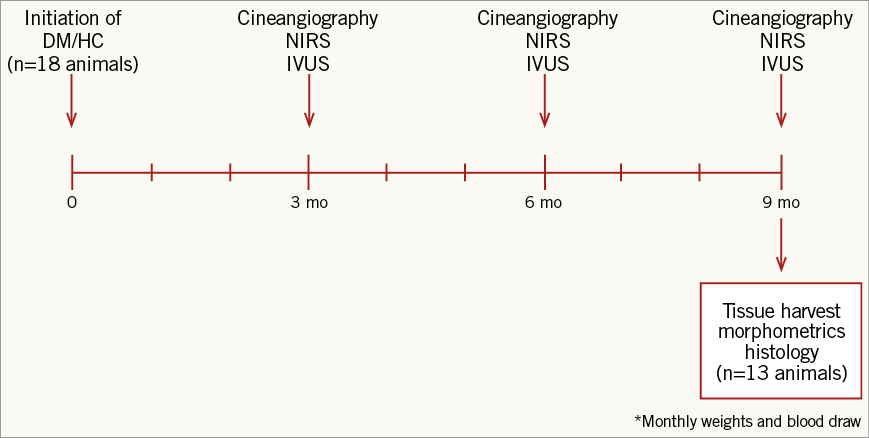
Figure 1. Study design. DM/HC: diabetes mellitus/hypercholesterolaemia; IVUS: intravascular ultrasound; NIRS: near infrared spectroscopy
IMAGING PROTOCOLS (APPENDIX)
Multivessel serial diagnostic coronary artery evaluation was performed at three, six and nine months following DM/HC induction. Animals were medicated with ketamine (2 mg/kg), medetomidine (0.1 mg/kg), atropine (0.04 mg/kg) and isofluorane to induce and maintain anaesthesia. Clopidogrel (75 mg) and aspirin (325 mg) were administered for three days prior to and continued for two days following intravascular procedures. Periprocedural intravenous heparin was administered to achieve an activated clotting time of >300 seconds. Selective cineangiography of the left and right coronary arteries was performed in two views before and after IVUS (Boston Scientific Corporation, Marlborough, MA, USA) and NIRS pullbacks were performed to identify and standardise imaging start and endpoints. The IVUS catheter was advanced to a distal side branch, the location noted, and a motorised pullback to the aorto-ostial junction was performed at a constant speed of 0.5 mm/s. A 3.2 Fr NIRS catheter was advanced to the identical distal side branch and spectral data were collected during automated motorised pullback to the ostium at 0.5 mm/s and 240 rpm.
TISSUE RETRIEVAL AND HISTOLOGICAL ANALYSIS (APPENDIX)
Following the nine-month in vivo evaluation, the animals were sacrificed with intravenous pentobarbital. The heart was rapidly removed and the coronary arteries were perfused at physiologic pressure with saline and then for >2 hours with 10% neutral buffered formalin. The arteries were cut into 5 mm blocks, with the distal ends marked and proximal ends sectioned for histology.
Statistical analysis
Comparison of continuous variables for two unmatched groups based on the presence or absence of TCFA was performed using univariate analysis of variance. Continuous variables measured over time (three, six and nine months) were analysed in pairwise fashion with analysis of variance. All p-values presented are two-tailed, and <0.05 was considered statistically significant. Analyses were performed with Stata 12.0 software (Stata Corp, College Station, TX, USA).
Results
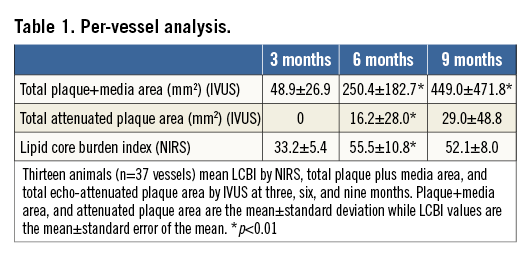
Results are shown for the 13 animals which underwent three invasive evaluations yielding 37 evaluated arteries. Following induction, there was a rapid rise in serum glucose and cholesterol levels with sustained elevations (Figure 2). A per-vessel IVUS analysis demonstrated a significant increase in P+M area at six- and nine-month time points (p<0.01). AP area increased from three to six months (p<0.01), remaining stable from six to nine months. Mean LCBI was 33.2±5.4, 55.5±10.8, and 52.1±8.0 at three, six, and nine months, respectively (3 vs. 6 months p=0.003; 6 vs. 9 months p=0.41) (Table 1). As animals grew, many coronary arteries lengthened. From six to nine months, 19 of the 37 arteries increased in length. Originally, 18 animals underwent DM/HC induction. Five died unexpectedly secondary to ischaemic sudden death, four of which demonstrated multivessel disease with superimposed thrombus.
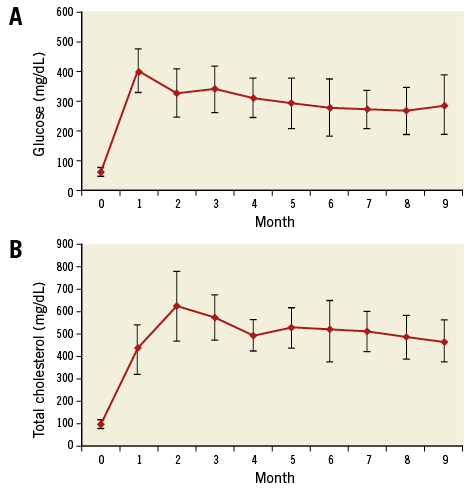
Figure 2. Induction and maintenance of diabetes mellitus and hypercholesterolaemia. Glucose (A) and total cholesterol (B) over time (mean±standard deviation).
Twenty-eight arteries contained a fibroatheroma (TCFA or ThCFA, n=137 sections) and nine did not. There was a mean of 4.9±3.2 histologic sections containing a fibroatheroma per artery, of which 2.5±3.1 were TCFAs. Arteries demonstrating a fibroatheroma had a significantly greater increase in LCBI between three and nine months (35.0±12.4 vs. 5.0±11.0, respectively; p=0.046). The nine-month LCBI was also higher among the vessels that contained a fibroatheroma (62.5±10.3 vs. 25.6±6.7; p=0.004). Intra-animal heterogeneity was evidenced in that four animals developed fibroatheromas in only one or two coronary arteries.
As TCFAs represent a higher-risk phenotype, we focused our analysis on their development. By histology, 18 arteries (69 sections) contained a TCFA possessing an average cap thickness of 65.6±23.9 µm. By IVUS, 52 TCFAs demonstrated negative remodelling at nine months (75.4%). The mean coronary artery P+M and AP areas based on the presence or absence of TCFA at nine months are shown in Figure 3. Mean P+M area increased in TCFA-containing arteries from 50.4±26.8 mm2 at three months, to 303.1±215.0 mm2 at six months, and 583.7±583.4 mm2 at nine months (3 vs. 6 months p=0.098; 6 vs. 9 months p=0.09). Arteries which contained a TCFA at nine months had a highly significant increase in AP area by IVUS from three to six months (0.0 mm2 vs. 28.9±35.6 mm2; p=0.007) and a non-significant increase from six to nine months (28.9±35.6 mm2 vs. 43.0±43.8 mm2; p=0.09). In arteries in which TCFAs were absent, there was no change in mean P+M or AP areas between three and nine months (Figure 3).
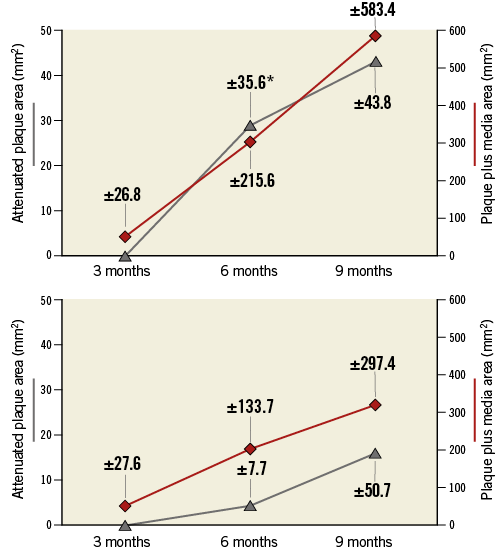
Figure 3. Intravascular ultrasound analysis. Echo-attenuated plaque and total arterial plaque+media areas by IVUS at three, six and nine months after DM/HC induction, based on the presence (A) or absence (B) of a thin-cap fibroatheroma at nine months by histology. The mean arterial attenuated plaque areas (grey line) are on the left-hand ordinate and mean arterial plaque+media area (red line) on the right-hand ordinate. Data point labels indicate standard deviation. Attenuated plaque area only increased significantly from three to six months in arteries which contained TCFA at nine months (*p=0.007).
The LCBI increased significantly in arteries containing ≥1 TCFA between three and six months (p=0.04), and remained stable between six and nine months (p=0.46). Notably, arteries that did not develop a TCFA (n=19) displayed similar LCBIs at all three time points (Figure 4). Compared to vessels in which a TCFA was absent at nine months, TCFA-containing arteries had a significantly greater mean LCBI (p=0.04) and mean ∆LCBI (p=0.03), respectively, at six months (Table 2). Chemograms of an artery which went on to develop multiple TCFAs and an artery which did not, along with corresponding histology at nine months, are displayed in Figure 5. The four animals excluded from the primary analysis which died suddenly from ischaemic sudden death were found to have multivessel disease with superimposed thrombus at necropsy. The chemograms of arteries from two animals which died suddenly before the six-month evaluation, along with corresponding histology, are displayed in Appendix Figure 1 and Appendix Figure 2, respectively, one demonstrating a thrombus which led to witnessed sudden death.
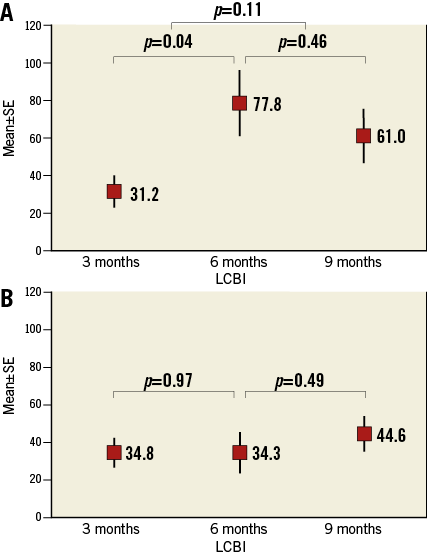
Figure 4. Early increase in lipid core burden index is associated with TCFA development. A) LCBI over time of arteries in which a TCFA was present at nine months (n=18). B) Arteries without a histologic TCFA (n=19). Mean±standard error of the mean plotted against time. LCBI: lipid core burden index
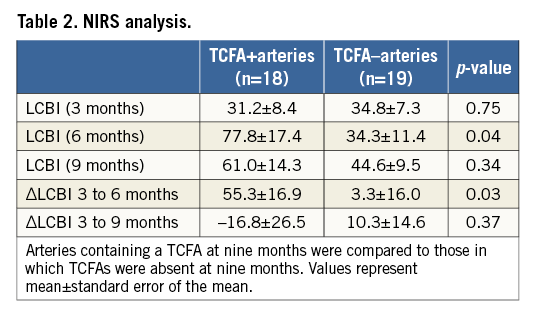
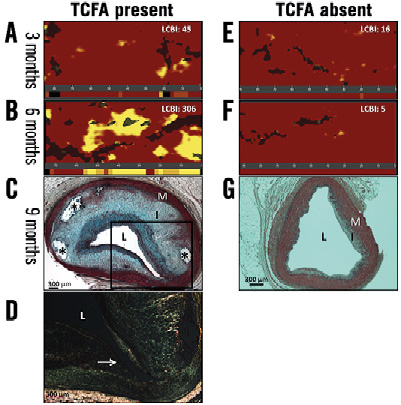
Figure 5. Comparative chemograms and histology of an artery which developed a TCFA versus one that did not develop a fibroatheroma. A) & B) Chemograms at three and six months of a TCFA-containing artery at nine months. The probability of lipid core plaque at the region of interest is displayed by using a colour scale where each pixel marked red indicates low probability and each yellow pixel a high probability. The black pixels of the chemogram are interference from the guidewire. The block chemogram is shown beneath each quantitative chemogram. There is an increase in lipid core plaque and LCBI from three to six months. C) Movat’s pentachrome stain of a TCFA from the interrogated artery at nine months. A thin fibrous cap over a dense necrotic core is outlined. D) Photomicrograph of an adjacent section stained with Picro-sirius at higher magnification of the outlined area in panel C. There is an absence of collagen in the fibrous cap (arrow). Under polarised light new collagen appears green while old collagen appears yellow or pink. E) & F) Chemograms and block chemograms at three and six months of an artery in which pathologic intimal thickening was present at nine months (G). The LCBI was stable over time. The artery in panel G has no fibrous cap, thus Picro-sirius red staining was not performed. *calcium deposit; I: intima; L: lumen; M: media
In 11 of the 18 TCFA-containing arteries, the LCBI increased from three to six months and remained stable from six to nine months. In a subgroup analysis of these 11 arteries, AP area increased from six to nine months in seven arteries. Additionally, a comparison of calcification and AP area at six and nine months demonstrated no significant difference in mean percent calcification (6 months: 53.3±27.6% vs. 9 months: 47.4±28.4%, p=0.48), mean calcium index (0.64±0.38 vs. 0.55±0.39, p=0.50), or mean percent AP area (9.4±5.4% vs. 7.7±5.2%, p=0.31). There was a non-significant increase in mean lumen area (6.9±0.94 mm2 vs. 8.1±2.3 mm2, p=0.17) from six to nine months.
Discussion
This is the first study to compare serial in vivo NIRS and IVUS with histological endpoints on a per-vessel analysis. The presented data show an association between early and rapid increases in lipid accumulation and subsequent arterial vulnerability as evidenced by the significant increase in TCFA development. In addition, arteries which developed TCFAs had larger echo-attenuated plaque areas at six months identifying putative necrotic core, a histological hallmark of more severe and higher-risk lesions7. Coronary vessels which did not develop TCFAs demonstrated stable and relatively unchanged LCBIs throughout the study. In addition, 75.4% of histologic TCFAs demonstrated negative remodelling by IVUS. Hence, the rapid increase in arterial lipid deposition as identified by NIRS predicted those vulnerable arteries which subsequently developed a TCFA. As such, this study establishes the time course of TCFA development in this animal model and suggests that the accumulation rate of arterial lipid has important prognostic significance.
Unstable coronary artery disease is a pan-coronary process, often with multiple high-risk lesions present within the same coronary artery. Using angioscopy, Asakura et al observed 3.2±1.7 non-culprit yellow plaques (denoting lipid-rich atheroma) per coronary artery in patients undergoing an evaluation following a myocardial infarction8. Ohtani et al, also using angioscopy, demonstrated that a higher number of yellow plaques predicted future development of an acute coronary syndrome (p=0.008). By multivariate analysis, only the number of yellow plaques and the presence of multivessel disease were independent risk factors for an acute coronary syndrome9. Using OCT, Kubo observed that 38% of patients who suffered a myocardial infarction had additional non-culprit TFCAs vs. 6% of those with stable angina10.
The present study supports the hypothesis that NIRS may play a role in the early identification of specific arteries with an increased propensity for future TCFA development and/or vulnerability. Assessment of culprit arteries of patients presenting with an acute coronary syndrome with NIRS have yielded similar results. Madder et al showed that non-culprit lipid-rich plaques were observed within the culprit vessel in 73.3% of patients presenting with an acute coronary syndrome, compared to only 17.6% in patients presenting with stable angina (p=0.002). Of patients presenting with an acute coronary syndrome, 84.4% had a target lesion lipid core plaque compared to 52.5% of patients presenting with stable angina11. Our findings further add to observations made in human studies of non-culprit arteries assessed by NIRS. Oemrawsingh et al observed prospectively that an elevated NIRS-derived coronary LCBI of non-culprit coronary arteries was associated with a fourfold increase in major adverse cardiac events in the following year12. Patients with non-culprit lesion LCBI values equal to or above a median of the sample had a cumulative one-year event rate (all-cause mortality, non-fatal ACS, stroke, and unplanned coronary revascularisation) of 16.7%, and the relationship between LCBI and primary endpoint was similar for stable angina and acute coronary syndrome patients. The current study shows that increased arterial lipid core plaque detected by NIRS is associated with the future development of TCFAs within those arteries leading to increased vulnerability.
We have previously shown, in this model, that NIRS positivity at nine months significantly correlated with the presence, at that point in time, of high-risk fibroatheromas with thinner fibrous caps, increased fibrous cap inflammation and higher rates of apoptosis, all signs associated with increased fibrous cap instability4. The current study extends those results by demonstrating that the rapid increase in lipid is associated with the future development of TCFAs on an arterial basis. Although NIRS can identify lipid-rich plaques, it cannot accurately determine fibrous cap thickness and therefore cannot differentiate between TCFAs and ThCFAs4. However, by using NIRS to determine LCBI, it is possible to identify those arteries with a fibroatheroma and/or an increased propensity for developing a TCFA. This would allow one to focus one’s attention utilising other technologies such as OCT, specifically to determine fibrous cap thickness and the natural history of such lesions insofar as lesions containing large necrotic cores and thin fibrous caps have an increased risk of future instability7. Identifying arteries with an increased propensity for the future development of high-risk lesions may ultimately improve risk stratification in patients in whom escalation of anti-atherosclerotic therapies or selective intervention may be of benefit. Utilising NIRS, Kini et al have demonstrated a reduction in 4 mm maximal segment LCBI in non-target lesions in response to short-term intensive statin therapy13. Hence, NIRS may be a valuable objective modality to assess how a diseased coronary artery responds to pharmacotherapy. In addition, PCI of lesions with higher lipid core plaques is associated with a higher risk of periprocedural myocardial infarction14.
The aetiology of the non-significant decrease in vessel LCBI between six and nine months after induction of DM/HC is unclear. The maximum depth of photon penetration of NIRS within atherosclerotic lesions is unknown, but it is believed to average about 1 mm, reflecting an unavoidable consequence of diffuse reflectance spectroscopy which measures a subtended area of lipid. Thus, decreased photon penetration may result in circumstances in which the NIRS algorithm reports stable or falsely negative LCBI over time in the presence of fibroatheromas with progressively deeper lipid pools, and/or calcified cores, expansive remodelling or in the setting of increasing lumen area. Notably, Gardner et al reported in ex vivo human coronary samples that false-negative readings were most frequently produced by lipid cores with extensive calcification and displacement of necrotic core lipid by calcium3. However, we did not detect a significant difference in calcification or lumen area by IVUS in TCFA-containing arteries in which the LCBI was stable from six to nine months. Changes in the chemical signature of necrotic cores can also result from a loss of lipid pool from undetected healed ruptures, or as a necrotic core became more necrotic and less lipemic. In a histopathologic correlation study, Pu et al demonstrated that IVUS echo-attenuated plaque had a specificity of 94.7% for the detection of a large lipid/necrotic core. However, there were a number of echo-attenuated plaques which had an LCBI approaching zero15. We noted that 19 of 37 interrogated arteries increased in length between six and nine months, of which 11 (of the 19) demonstrated a regression in the LCBI. This indicates that, as animals grew and vessels lengthened, the number of yellow pixels indicating lipid deposition remained relatively stable while the number of red pixels, indicating non-lipemic tissue, proportionally increased, thereby resulting in a reduced total arterial LCBI.
Limitations
Our study is limited by the fact that histology only examined 5 μm sections from a segment 5 mm in length. Given the burden of atheroma measured by IVUS across the study samples and arterial lengths, unexamined sections may have contained high-risk phenotypes. We observed large standard deviations in the mean AP area and P+M area between the two groups from six to nine months. Within individual animals there were arteries in which these values shrank or remained stable, while others had dramatic increases out of proportion to other animals or arteries, reflecting the dynamic nature of high-risk lesions. This has been shown clinically by Kubo et al and Zhao et al16,17, where phenotypic changes of coronary lesions over time were demonstrated in both stable and unstable non-culprit lesions. As such, the relatively small number of arteries assessed and the large standard deviation of lipid core area could reflect a type 2 error, though the burden of disease detected serially by IVUS and NIRS and histologically at necropsy would suggest otherwise.
Conclusions
The early development and persistence of arterial lipid core plaque between three and six months predicts the presence of at least one TCFA within that artery at nine months.
| Impact on daily practice NIRS LCBI identifies a vulnerable artery at risk for the future development of more clinically significant atherosclerotic lesions. |
Acknowledgements
The authors gratefully acknowledge the expert animal care and technical support of Harrilla Profka.
Conflict of interest statement
S. Madden is an employee of InfraReDx. The other authors have no conflicts of interest to declare.
SUPPLEMENTARY DATA
Appendix. Imaging protocols
IVUS ANALYSIS
All IVUS images (1 mm apart) were analysed in diastole and analysis was performed according to the clinical consensus document on IVUS18. Plaque plus media (P+M) area was determined by subtracting the luminal cross-sectional area from the external elastic lamina cross-sectional area. Echo-attenuated plaque (AP) area was measured and defined as the hypoechoic area within external elastic lamina boundaries. Total arterial atheroma area was estimated by summation of each P+M cross-sectional area (mm2) over the length of the artery. Total arterial AP area was estimated in a similar fashion. For each TCFA, an IVUS-derived remodelling index was calculated. If the lesion external elastic lamina area was greater than a reference external elastic lamina area, positive remodelling had occurred. Remodelling index <1 indicated negative remodelling. The reference external elastic lamina was defined as the largest external elastic lamina area within a 5 mm distance proximal or distal to the lesion. Calcification was assessed by two methods. For each measured image, a calcium grade was assigned which reflected the presence of calcium and degree of acoustic shadowing (0=no calcium, 1=calcium with acoustic shadowing <90°, 2=calcium shadowing ≥90°)19. If an image contained multiple calcium deposits, a grade was assigned after summation of all the angles of acoustic shadowing. A per-vessel calcium index for each pullback was derived by calculating the average calcium grade of all images. The degree of calcification was also expressed as the percent of artery containing any calcium.
NIRS ANALYSIS
The algorithm to detect lipid core plaque and derive a block chemogram for NIRS scans has been previously described and validated in ex vivo human coronary arteries20. For each pullback a chemogram, a block chemogram, and a lipid core burden index (LCBI) were determined. The probability of lipid core plaque for each scanned segment was displayed as a two-dimensional spatial map, or chemogram, with the x-axis indicating region of interest in millimetres, and the y-axis the circumferential position (0°-360°). On the chemogram, the algorithm displayed the probability of lipid core plaque at the region of interest by using a colour scale where each pixel marked red indicated low probability and each yellow pixel a high probability. The block chemogram provided a summary of data to enhance interpretation of the chemogram and displayed the probability that lipid core plaque was present for all measurements using the top 10th percentile pixel information of the corresponding 2 mm chemogram segment. If the algorithm probability was ≥0.98 that a lipid core plaque was present in that 2 mm block, the entire block was assigned yellow. The LCBI denotes the extent of lipid core plaque over the entire scanned artery segment computed as the fraction of valid pixels within the scanned region that exceeded a lipid core plaque probability of 0.6, multiplied by 1,000.
TISSUE RETRIEVAL AND HISTOLOGICAL ANALYSIS
All sections were stained with Movat’s pentachrome while adjacent 5 μm sections containing fibroatheromas were stained with Picro-sirius red. Picro-sirius red more clearly delineates the fibrous cap thickness by assessing collagen’s birefringence under a polarising light source4.
Sections were quantitatively analysed using Image-Pro Plus (Media Cybernetics, Rockville, MD, USA) to measure the P+M, intimal and necrotic core areas. The necrotic core was defined as those areas in which extracellular matrix was absent and replaced by necrotic debris using Movat’s and Picro-sirius red staining. The thickness of the thinnest cap segment was determined by Picro-sirius staining. From the Movat’s stained sections, fibroatheroma depth was assessed in two ways. Depth was measured from both the intimal border and the central point of the arterial lumen to the deepest abluminal TCFA edge. Sections were then classified using the modified AHA classification by two independent observers, blinded to both the IVUS and NIRS data, as either TCFA, thick-cap fibroatheroma (ThCFA), or non-fibroatheromas (pathological intimal thickening, intimal hyperplasia, and normal tissue)21.
TCFAs were defined as having a fibrous cap <100 µm.
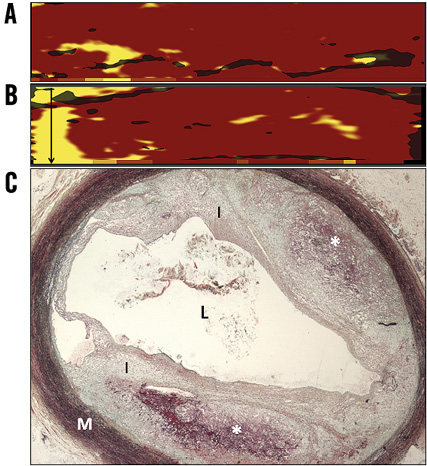
Appendix Figure 1. Chemograms and histology of a right coronary artery obtained from an animal that died suddenly between the three- and six-month diagnostic evaluations. A) Chemogram and block chemogram measured in vivo at three months. B) Post mortem chemogram and block chemogram obtained ex vivo. The quantity of NIRS-derived lipid core plaque increased between the three-month evaluation and the time of the animal’s sudden cardiac death, particularly in the proximal region of interest. Black arrow identifies region of interest in which a TCFA was detected at necropsy. C) Movat’s pentachrome stain of a TCFA detected at necropsy within the proximal right coronary artery with a thin fibrous cap over two areas of dense necrotic core containing intraplaque haemorrhage. Area of the lipid core plaque corresponds to the presence of a TCFA at necropsy. *necrotic core; I: intima; L: lumen; M: media; NIRS: near infrared spectroscopy; TCFA: thin-cap fibroatheroma
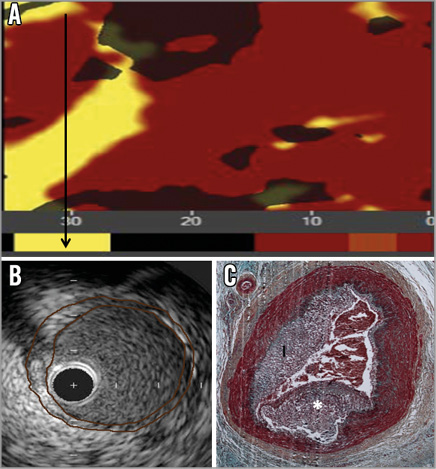
Appendix Figure 2. NIRS, IVUS, histology of culprit lesion in animal suffering sudden death 42 days after three-month NIRS/IVUS evaluation. A) Chemogram and block chemogram measured in vivo at three months. Black arrow identifies region of interest in which a coronary thrombosis was detected at necropsy. B) IVUS of region of interest. Culprit lesion is outlined. Note the substantial increase in lesion severity between the IVUS and death. C) Movat’s pentachrome stain of culprit coronary artery lesion notable for lumen thrombosis and atherosclerosis. *thrombus; I: intima; IVUS: intravascular ultrasound; NIRS: near infrared spectroscopy