Abstract
Optical coherence tomography (OCT) has been increasingly utilised to guide percutaneous coronary intervention (PCI). Despite the diagnostic utility of OCT, facilitated by its high resolution, the impact of intracoronary OCT on clinical practice has thus far been limited. Difficulty in transitioning from intravascular ultrasound (IVUS), complex image interpretation, lack of a standardised algorithm for PCI guidance, and paucity of data from prospective clinical trials have contributed to the modest adoption. Herein, we provide a comprehensive up-do-date overview on the utility of OCT in coronary artery disease, including technical details, device set-up, simplified OCT image interpretation, recognition of the imaging artefacts, and an algorithmic approach for using OCT in PCI guidance. We discuss the utility of OCT in acute coronary syndromes, provide a summary of the clinical trial data, list the work in progress, and discuss the future directions.
Introduction
Angiography, the cornerstone imaging modality in the cardiac catheterisation laboratory, has well-established limitations. These inherent limitations arise from angiography providing a lumenogram, depicting planar projections of the three-dimensional coronary tree, rather than imaging the vessel wall where the process of atherosclerosis manifests. Intravascular imaging – intravascular ultrasound (IVUS) and optical coherence tomography (OCT) – enables cross-sectional tomographic imaging of the coronary artery and provides additional information that is complementary to angiography. Intravascular imaging thus aids in the selection of treatment strategies and guidance of percutaneous coronary intervention (PCI). Registries1,2,3, randomised controlled trials4,5, and meta-analyses6,7 consistently support procedural and long-term benefits of intravascular imaging-guided PCI.
OCT in PCI
INTRAVASCULAR OCT: TECHNOLOGY, ADVANTAGES, LIMITATIONS, AND AVAILABLE IMAGING PLATFORMS
OCT utilises near-infrared light directed at the vessel wall through a rotating single optical fibre coupled with an imaging lens within a short-monorail imaging sheath. By measuring the amplitude and time delay of the backscattered light, OCT generates high-resolution, cross-sectional and three-dimensional volumetric images of the vessel microstructure. Due to the fast speed of light, interferometry is required for backscatter detection: this involves splitting the light into signal and reference beams, with the intensity of interference calculated according to the frequency differences between the two beams. Since blood strongly scatters light and attenuates the OCT signal, flushing is required to displace blood during OCT acquisition.
The shorter wavelength of the infrared light in OCT (1.3 μm) compared with ultrasound in IVUS (~40 μm at 40 MHz) confers greater axial resolution (10-20 μm versus 50-150 μm) but lower penetration depth (1-2 mm versus 5-6 mm), which limits OCT imaging, particularly in the presence of highly attenuating structures such as red thrombus or lipid/necrotic core.
Multiple intracoronary imaging OCT systems have been developed. Currently, the two systems most employed are the OPTIS™ system (Abbott Vascular, Santa Clara, CA, USA), which also provides combined angiographic and OCT visualisation (co-registration), and the Lunawave® system (Terumo, Tokyo, Japan). Numerous other established companies and start-ups have released products or are in the process of entering the market, including Argus, Avinger, Canon, Conavi Medical, Dyad Medical, Forssman Medical, Gentuity, Horimed, InnerMedical, OCT Medical Incorporated, SpectraWave, and Vivolight, amongst several others. Novasight Hybrid™ (Conavi Medical Inc., Toronto, Canada) and Dual Sensor (Terumo) are the available OCT/IVUS hybrid catheter systems that are in use for research purposes, with the potential to provide the combined strengths of OCT and IVUS in a single catheter in clinical practice8.
OCT IMAGE ACQUISITION: PRACTICAL STEPS
Commercial OCT imaging systems consist of an OCT imaging catheter, a drive motor operating control, and imaging software. To set up OCT, the imaging catheter is attached to the purge syringe and flushed with the same material planned for coronary flushing (to maintain consistency in the index of refraction) and attached to the drive motor operating control. Intracoronary nitroglycerine is given before OCT imaging to eliminate spasm that may be caused by catheter irritation (Supplementary Figure 1). In order to achieve clearance during catheter pullback, it is critical to engage the guiding catheter at the coronary ostium. Deep-seating of the guide is unnecessary and may be counterproductive, as contrast injection may eject the guide, leading to suboptimal flushing. The subsequent imaging steps can be summarised as the four Ps: position, purge, puff, and pullback. The rapid exchange OCT catheter is advanced on the coronary guidewire and positioned distal to the target lesion (~10 mm distally), the catheter is again purged, a small volume of flush is “puffed” through the guide catheter to evaluate clearance (if clarity is marginal, the engagement of the guide catheter with regard to the target vessel is checked and adjusted), and pullback is activated. In severely stenotic lesions where the OCT catheter may not cross the target lesion or the vessel clearance is expected to be poor, predilation should be performed. The contrast flush rate is set at 4 mL/sec for a total volume of 14-16 mL for the left coronary artery and 3 mL/sec for a total volume of 12-14 mL for the right coronary artery. If an automated injector is used, the pressure limit should be set at 300 psi or the nearest available. Contrast injection should stop immediately as the guide catheter is seen on the pullback to minimise contrast waste. Likewise, cine angiography should be performed during pullback to utilise contrast injection for angiography and for OCT co-registration if the feature is available. Although OCT acquisition, akin to any instrumentation in the coronary arteries, is not completely free of risk, nonetheless significant complications due to OCT acquisition are rare9 and can mostly be avoided by using meticulous techniques described in the present review.
PCI GUIDANCE
Pre-PCI assessment consists of quantitative and qualitative analysis. OCT can be used to identify the culprit lesion, assess lesion morphology to guide lesion preparation strategies10, and characterise the stent landing zones, thus allowing precise selection of the length and diameter of balloons and stents. As lack of a standardised algorithmic approach to OCT-guided PCI may be a factor in the limited adoption of the technology, procedural guidance during the PCI can be summarised with the mnemonic MLD MAX (morphology, length, diameter, medial dissection, apposition, expansion), fitting for the procedural goals of PCI.
PRE-PCI GUIDANCE
MORPHOLOGY
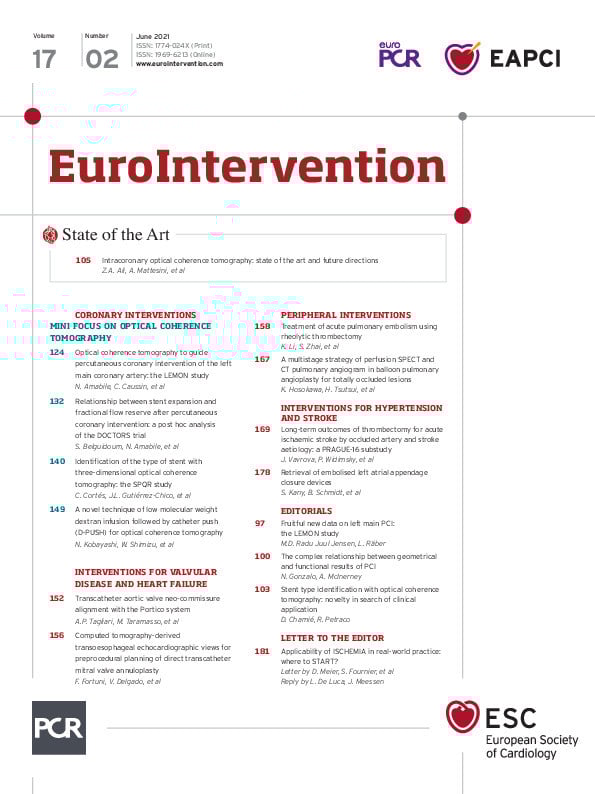
Detailed assessment of normal and diseased morphology in coronary arteries by OCT is feasible by understanding the optical attenuation characteristics of vascular tissue layers. The trilaminar appearance represents the light scattering reflected from the layers of the normal vessel. Loss of this architecture generates appearances that correlate with different types of atherosclerotic lesion. A simplified algorithm for OCT image interpretation in native coronary arteries is shown in Figure 1. This algorithm is useful in describing the most frequent pathological morphologies in the vessel wall that include low-attenuating, signal-rich lesions (fibrous plaques), high-attenuating, signal-poor regions covered with fibrous cap (lipid-rich plaques), low-attenuating, sharply delineated, signal-poor regions (calcific plaques), and those inside the lumen, including the low-attenuating white thrombus and the high-attenuating red thrombus that casts a shadow on the vessel wall.
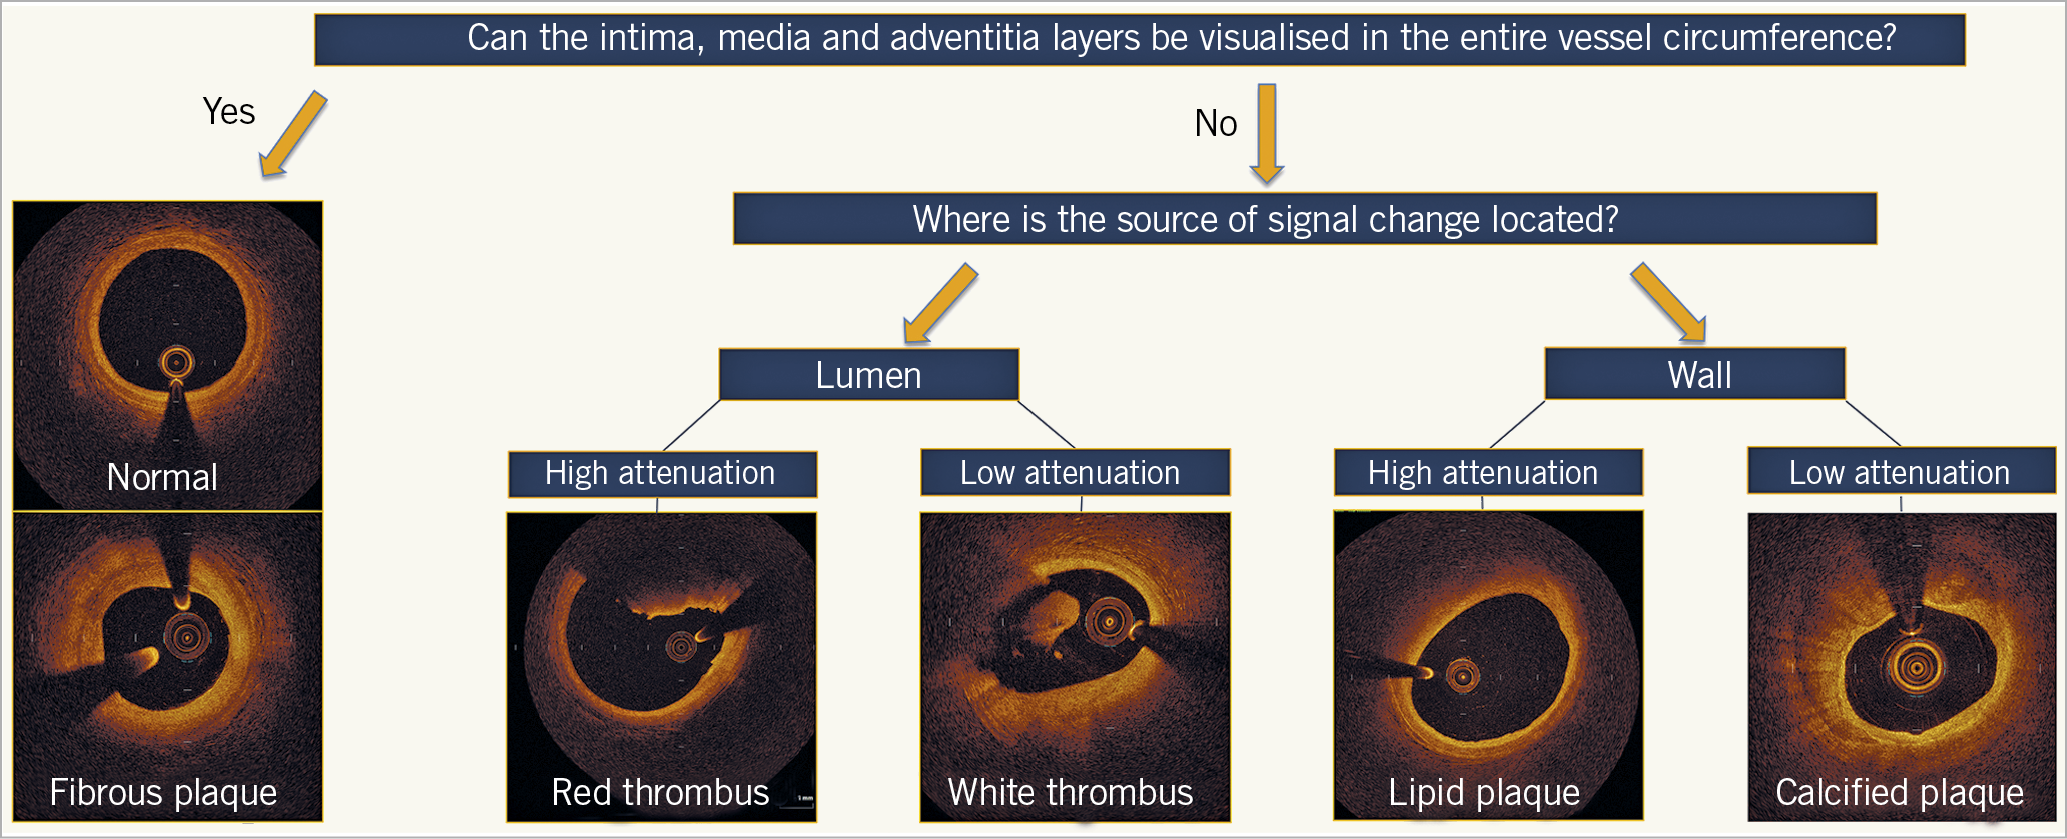
Figure 1. Algorithmic approach to optical coherence tomography image interpretation of common morphologies. The tri-laminar appearance of the normal vessel or fibrous plaque represents light scattering reflecting from the layers of the vessel without light attenuation. Hence, when the intima, media, and adventitia can be visualised for the entire vessel circumference, the cross-section represents either a normal segment or fibrous plaque; the latter of these can be differentiated by eccentric intimal thickening. The morphological characteristics of different plaque constituents exhibit different light attenuating properties. High attenuation occurs when there is complete absorbance of the near-infrared light, and low attenuation when the light is refracted, yet continues to allow visualisation of vessel characteristics towards the adventitia. When the source of the attenuation is in the lumen, high attenuation represents red thrombus and low attenuation represents white thrombus. When the source of the attenuation is in the vessel wall, high attenuation represents lipidic plaque, and low attenuation represents calcification.
Assessment of lesion morphology on OCT can guide lesion preparation. Predilatation with an undersized balloon or a direct stenting approach may be appropriate in the presence of largely fibrous or lipid-rich plaques, whereas, in moderate or severely calcified lesions, non-compliant balloon predilation, use of a cutting or scoring balloon, atherectomy, or intravascular lithotripsy can be considered. In calcified lesions, IVUS delineates the calcification arc but not its thickness because of reflection of ultrasound waves off calcium (Figure 2). In contrast, OCT allows determination of both calcification arc and thickness in most cases. An OCT-based scoring system has been devised and validated in calcified lesions to help determine which calcific morphologies lead to stent underexpansion11,12. The factors identified may be easily recalled as the “rule of 5s”: 1 point for maximum thickness >0.5 mm, 1 point for contiguous length of calcium >5 mm, and 1 point for maximum arc >50% of the circumference of the vessel (i.e., >180° of the circumference). There was significantly lower stent expansion in target lesions with a total score of ≥3 (all factors present), suggesting that calcium modification with atherectomy or intravascular lithotripsy may be needed, whereas stent expansion in lesions with scores of ≤2 was generally acceptable. In the absence of adjunctive therapies for lesion preparation, calcium fracture using balloon angioplasty was best predicted by a calcium angle of 225° and calcium thickness of 0.24 mm13. In the presence of a maximum calcium arc >50% of the vessel circumference, lesions with calcium fracture have better stent expansion than those without13. Hence, the presence of calcium fracture, easily identified by OCT (Supplementary Figure 2), may be a goal for lesion preparation prior to stenting. Nevertheless, the relationship between calcium fracture on OCT and stent expansion warrants further assessment in appropriately designed prospective studies.
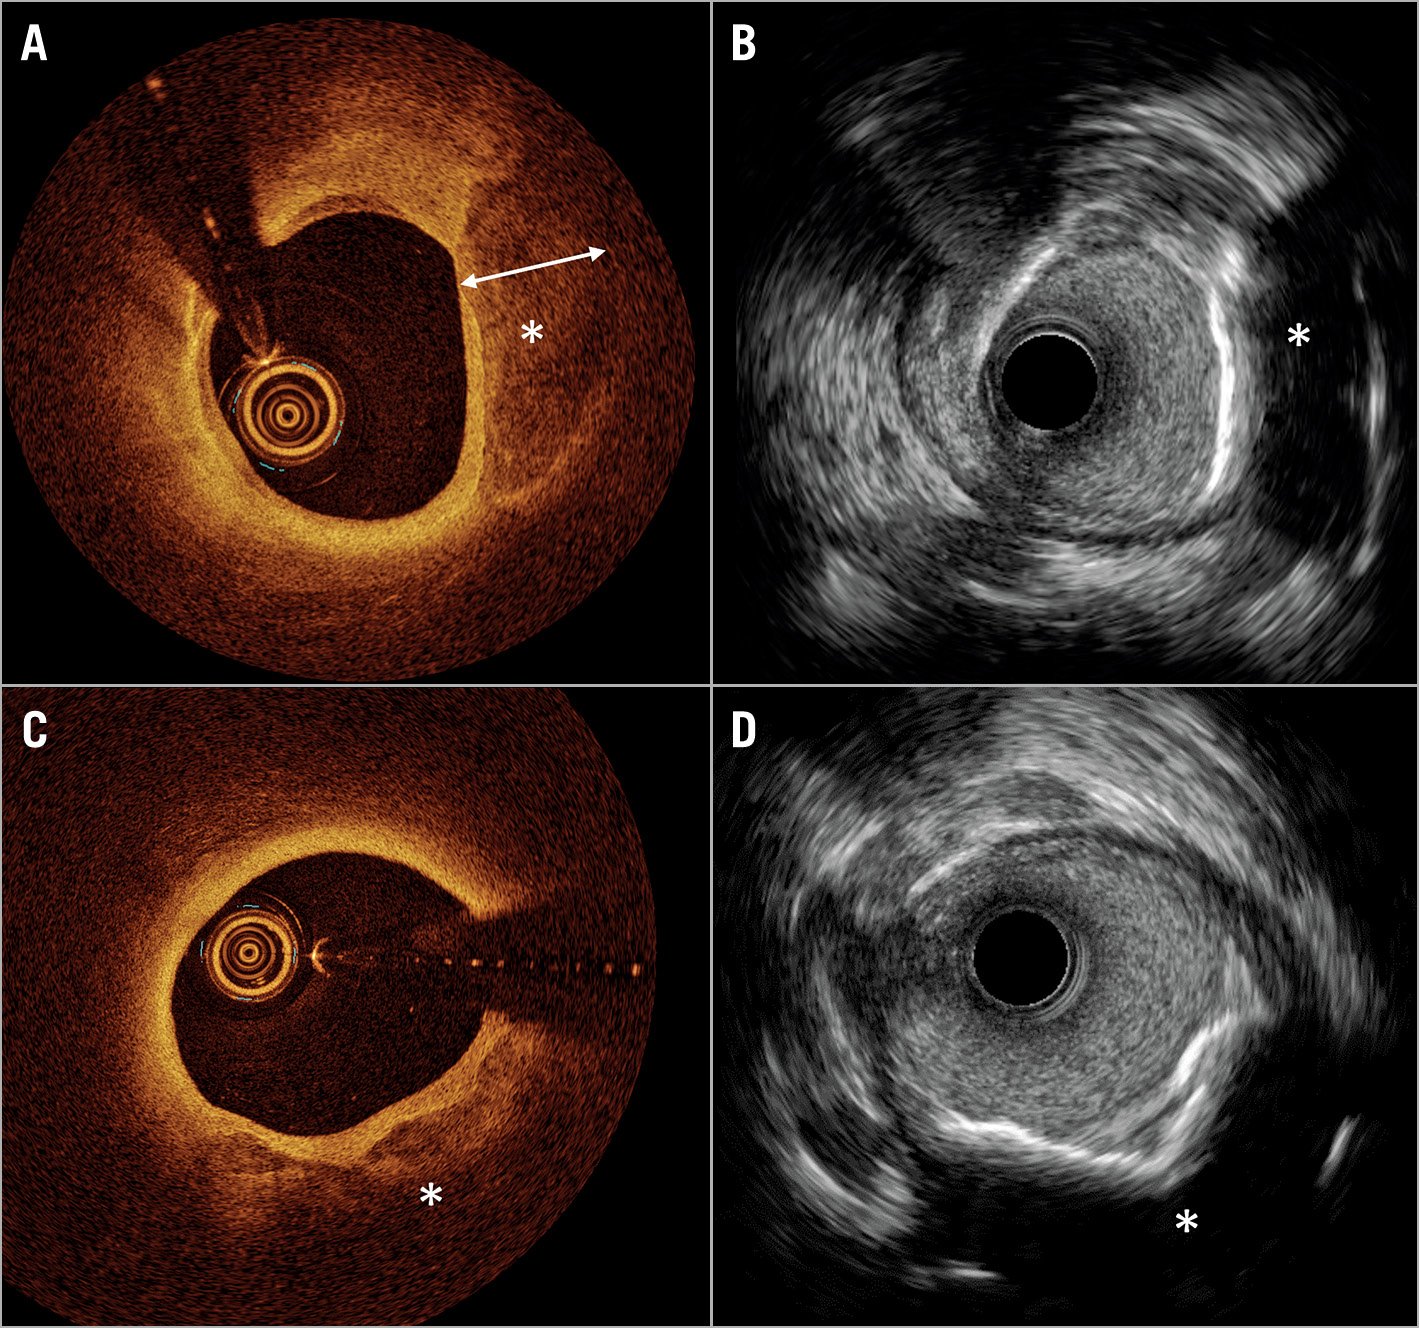
Figure 2. Comparison of coronary calcium imaging by optical coherence tomography and high-definition intravascular ultrasound. A) Optical coherence tomography (OCT) shows superficial calcium extending to the medial layer (*). The calcium (*), where thickness can be measured due to the optical properties of light penetration through the calcium crystal. B) Co-registered image on high-definition intravascular ultrasound (HD-IVUS) does not allow measurement of calcium thickness. C) OCT shows superficial calcium extending to the medial layer (*), where thickness cannot be measured due to the limited penetration depth of light. D) Co-registered image on HD-IVUS does not allow measurement of calcium thickness.
LENGTH
OCT software provides a two-dimensional lumenogram of the artery, incorporating multiplanar reconstruction of the three-dimensional data, referred to as the lumen profile. Initially, the largest lumens proximal to the lesion and distal to the lesion on the lumen profile are used to create a region of interest. By scrolling through the OCT cross-sections at these sites, the most “normal” appearing segments within 5 mm are selected as proximal and distal reference frames (i.e., segments where there is minimal atherosclerotic plaque and hence greatest visibility of the arterial medial [external elastic lamina – EEL] and adventitial layers). The length of the lesion is then automatically calculated by the OCT software. Often, this number will not correspond to a commercially available drug-eluting stent (DES), so either the proximal or distal reference frame, whichever is in a more normal segment, is adjusted to an available DES length (Supplementary Figure 3). This approach minimises stent edge problems, including geographic miss and presence of thin-cap fibroatheroma (TCFA) at reference segments, which may lead to significant dissections and increase the risk of early stent thrombosis and post-PCI target lesion failure14,15,16,17,18,19.
DIAMETER
A step-by-step guide for measurement of vessel diameter and selection of stent diameter is provided in Figure 3. Briefly, an EEL-guided device sizing strategy is preferable to a lumen-guided strategy as it leads to the selection of a larger device size (≈0.5 mm) and consequently a larger lumen area without an increase in post-procedural complications20,21,22. EEL measurements may be utilised if two separate diameter measurements can be made in two different locations in the arterial wall that are at least one quadrant of the arterial circumference apart from each other. Greater than 180° of EEL could be visualised in ~80% of cases in the ILUMIEN III trial21. EEL-based measurements should be rounded down to determine the device size. If EEL visualisation is insufficient, the mean lumen diameter, recorded from the automated lumen profile feature, is utilised for device sizing. Lumen-based measurements should be rounded up, between 0.25 and 0.5 mm, to determine the device size20. The distal measurements determine the stent size and post-dilation balloon size at the distal segment of the stent, and the proximal measurements determine the balloon size for post-dilation at the proximal segment of the stent.
Figure 3. Optical coherence tomography-guided algorithm for percutaneous coronary intervention. Vessel diameter should be assessed using the external elastic lamina (EEL)-EEL diameter at the reference segments, and rounded down to select interventional devices (balloons, stents). If the EEL cannot be identified, luminal measures are used and rounded up to 0.5 mm larger for selection of the devices. Optical coherence tomography (OCT)-guided optimisation strategies post stent implantation per EEL-based diameter measurement and per lumen-based diameter measurement are shown. For instance, if the distal EEL-EEL diameter measures 3.2 mm×3.1 mm (i.e., the mean EEL-based diameter is 3.15 mm), this number is rounded down to the next available stent size and post-dilation balloon to be used at the distal segment. Thus, a 3.0 mm stent and non-compliant balloon diameter is selected. If the proximal EEL cannot be visualised, the mean lumen diameter should be used for device sizing. For instance, if the mean proximal lumen diameter measures 3.4 mm, this number is rounded up to the next available balloon diameter (within up to 0.5 mm larger) for post-dilation. MLA: minimal lumen area; MSA: minimal stent area;
NC: non-compliant
ANGIOGRAPHIC CO-REGISTRATION
A software for automated real-time point-to-point correspondence between the coronary angiogram and OCT has been developed that reduces the errors in manual co-registration of angiography with OCT frames. The software presents the selected distal and proximal landing sites as markers on the co-registered angiography to guide precise stent implantation (Supplementary Figure 4), eliminating the perils of landing the stent edges in the angiographically normal appearing reference segments where plaque burden may be extensive23. In a randomised study, OCT-angiography co-registration aided in more precise stent deployment, eliminating large geographic miss (>5 mm), and resulted in a trend towards reducing major stent edge dissection compared to angiography guidance24. Similar findings were reported in observational studies reporting geographic miss with a length of ≈5 mm with angiography guidance, stent coverage guided by angiography alone missing OCT-identified lesions in 70% of patients25, and changes in the device landing zone and stent length prompted by OCT co-registration in ≈20% of patients26,27. OCT-angiography co-registration can also aid in rapid identification and targeted post-dilation of underexpanded stent segments, thus avoiding unnecessary post-dilation, especially near the stent edges where post-dilation may result in edge dissection28. More recently, identification and mapping of the side branch ostium to minimise protrusion of stent struts into the main branch while ensuring full coverage of the ostium of the side branch, so-called bifurcation and ostial OCT mapping (BOOM), has been described29.
POST-PCI GUIDANCE
After stent deployment, the steps to assess the results, optimise stent deployment, and correct complications can be summarised with the mnemonic MAX.
MEDIAL DISSECTION
Reference segments are assessed on post-PCI OCT pullback to check for medial dissection and intramural haematoma (Supplementary Figure 5). The superior resolution of OCT has been criticised for providing “too much” information, identifying dissections in up to 40% of PCI21, of which ≈80% were not detectable by angiography, with no clinical impact30. Indeed, most dissections detected by OCT heal without consequence one year following PCI19,31. More recently, however, studies have confirmed the presence of major stent edge dissection detected by OCT as a predictor of poor outcomes15,16,18,19. In the CLI-OPCI registry, a linear rim of tissue with a width >200 μm was considered a major dissection and was associated with a 2.5-fold hazard of major adverse cardiac events (death, myocardial infarction [MI], target lesion revascularisation) at the distal edge but not at the proximal edge16,18. In a detailed analysis of OCT-identified edge dissections, van Zandvoort et al19 reported that cavity depth at the distal edge, reference lumen area at the proximal edge, and overall dissection length were predictors of the device-oriented composite endpoint (cardiac death, target lesion MI, target vessel revascularisation) at one year. In keeping with these findings, the ongoing ILUMIEN IV study categorises major dissections as those with medial dissection ± intramural haematoma ≥60° in arc from the centre of the vessel and ≥3 mm in length from the edge of the stent. Given the acquisition of a blinded OCT in the angiographic arm of ILUMIEN IV, detailed insights into edge dissections that are associated with target vessel failure will be gained from the trial.
APPOSITION
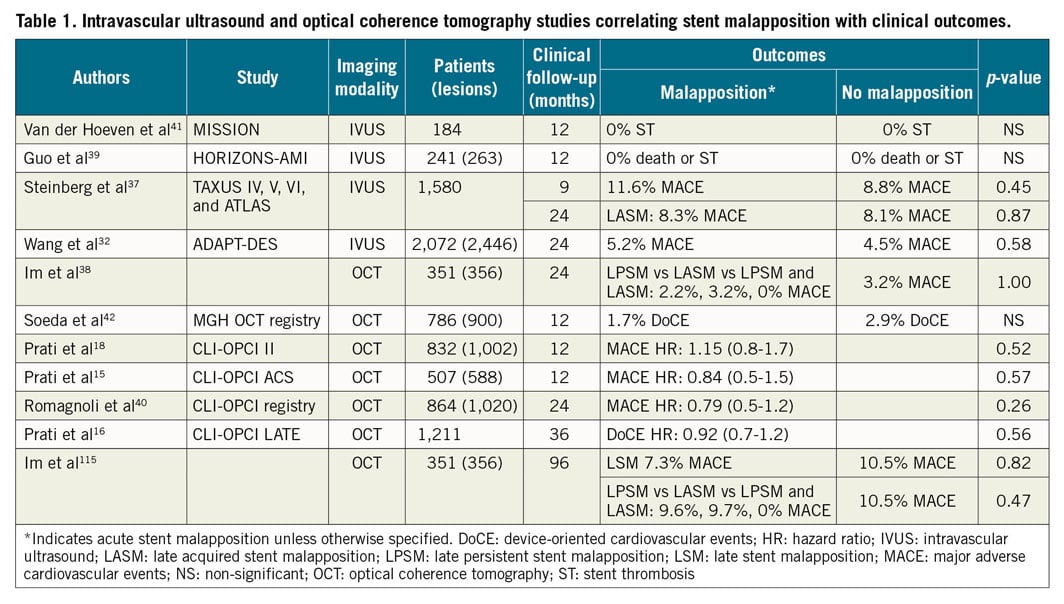
Stent malapposition, recognised as an entity with the advent of intravascular imaging, refers to the lack of full contact between stent struts and the vessel wall following PCI. Malapposition may be present immediately after placement of stents (acute stent malapposition) or it may develop later (late stent malapposition), which can in turn be categorised as late persistent malapposition (ongoing since the time of implantation) or late acquired malapposition. Acute stent malapposition is a common finding after implantation of DES, observed on average in 15% of stents by IVUS32 and at a higher rate of 50% by OCT18 due to the higher resolution of OCT, flushing of the lumen, and the ability for automatic detection of the malapposed struts (Supplementary Figure 6). The potential impact of acute stent malapposition on stent failure rates (i.e., in-stent restenosis and stent thrombosis) has been a matter of controversy33. While bench-top in vitro experiments34, pathophysiological examination35, and small intravascular imaging studies36 support a theoretical link between exposed, uncovered, malapposed struts and stent thrombosis, several larger intravascular imaging studies16,32,37,38 have shown no relationship between the presence and/or extent of acute stent malapposition and early, late, or very late stent thrombosis, or adverse events after DES implantation (Table 1),15,16,18,32,37,38,39,40,41,42. While acute stent malapposition without underexpansion is not associated with increased stent failure rates, proximal edge malapposition that may interfere with re-wiring, gross malapposition for long segments (>3 mm), or malapposition associated with underexpansion may need correction. As the force required to oppose stent struts is different to that required to expand the struts, high-pressure inflation of non-compliant balloons may not be necessary, with low-pressure inflation of semi-compliant balloons being sufficient.
EXPANSION
If the stent expands the lesion to diameters close to or equalling the diameter of the artery, the stent is considered adequately expanded (Supplementary Figure 7). The current European consensus is that a minimal stent area (MSA) ≥80% of the mean reference lumen area and/or >4.5 mm2 on OCT is considered acceptable18,43. Nonetheless, multiple criteria for adequate expansion have been proposed and tested43, with the common goal of maximising the MSA, a consistent predictor of long-term PCI outcomes3,44,45,46,47,48,49,50. OCT software provide automatic measurement of stent diameter and expansion and detection of underexpanded segments. AptiVue™ Imaging Software, used with the OPTIS™ Integrated System (both Abbott), provides two modes of expansion assessment: automatic comparison of the expansion to the closest respective proximal or distal reference in each half of the stented segment (dual reference mode) or automatic calculation of expansion based on an interpolation of the vessel size, considering OCT-detected side branches (tapered reference mode) (Supplementary Figure 7).
If stent underexpansion is identified on post-PCI OCT, the reference segments immediately outside the stent are used to re-measure the vessel size, preferentially by using EEL guidance, but lumen guidance is acceptable if the EEL is not visible (Figure 3). If the vessel size on post-PCI OCT has not changed compared with the measurements on pre-PCI OCT and the operator has pre-emptively post-dilated with a non-compliant balloon at ≥18 atm, the requirements for minimal stent expansion optimisation may have been met; further optimisation is at the discretion of the operator. If the vessel size has changed such that a new balloon diameter is recommended, high-pressure post-dilatation (≥18 atm) with non-compliant balloons sized to the target stent segment (EEL- or lumen-based according to the aforementioned algorithm for measurement) should be performed to match the optimisation criteria. If the subsequent OCT run shows persistent underexpansion, further optimisation for expansion is at the discretion of the operator. Both simple (higher inflation pressure, prolonged inflation) and advanced strategies (intravascular lithotripsy, excimer laser, the OPN ultra high-pressure balloon [SIS Medical, Frauenfeld, Switzerland]) for post-PCI optimisation may be considered when routine post-dilation is unsuccessful in improving stent expansion. Such optimisation should be performed considering that excimer laser with contrast injection (often required for stent optimisation in severely calcified lesions) and intravascular lithotripsy in implanted stents are “off-label” applications of these technologies. Overall, the potential benefit of further optimisation (e.g., in severe underexpansion) versus potential for harm (small incremental gain in expansion versus the risk of vessel perforation) needs to be carefully considered. While large studies of IVUS- versus angiography-guided PCI have shown that failure to meet the target expansion criteria is associated with worse outcomes5,45, whether not achieving the exact target optimisation criteria after performing the above steps is a reflection of inadequate optimisation or vessel anatomy and lesion characteristics is unclear.
Following OCT-guided optimisation of stent expansion, the proximal and distal reference segments, defined as the segments within 5 mm from the edges of the stent, are examined for inflow/outflow disease. If both the proximal and distal reference segments have a minimal lumen area (MLA) ≥4.5 mm2, no further treatment is necessary. If there is untreated disease at the reference segment, defined as a focal MLA <4.5 mm2 in either proximal or distal reference segments, additional DES should be implanted unless anatomically prohibitive (e.g., vessel tapering, distal diffuse disease, absence of a landing zone).
OCT IMAGE ARTEFACTS AND LIMITATIONS
For accurate OCT image interpretation, assessment of image quality and identifying artefacts are crucial. Some artefacts can be corrected with appropriate modifications to the imaging procedure.
OCT artefacts can be categorised as artefacts that originate from light propagation in the catheter, lumen, or vessel wall, and artefacts related to catheter location and movement (Figure 4). Some lumen or vessel constituents strongly attenuate the OCT light, causing the appearance of shadows that reduce the intensity of the OCT signal in the arterial wall. Inadequate blood clearance generates signal-rich areas within the lumen, causing interference that decreases the intensity of the OCT signal from the arterial wall (Figure 4A, Figure 4B). In addition, blood swirling, particularly at the beginning or end of a pullback, can be mistaken for thrombus or plaque erosion (Figure 4C, Figure 4D). Red thrombus attenuates the OCT light, while metallic stent struts and guidewires block incident OCT light, casting shadows on the vessel wall.
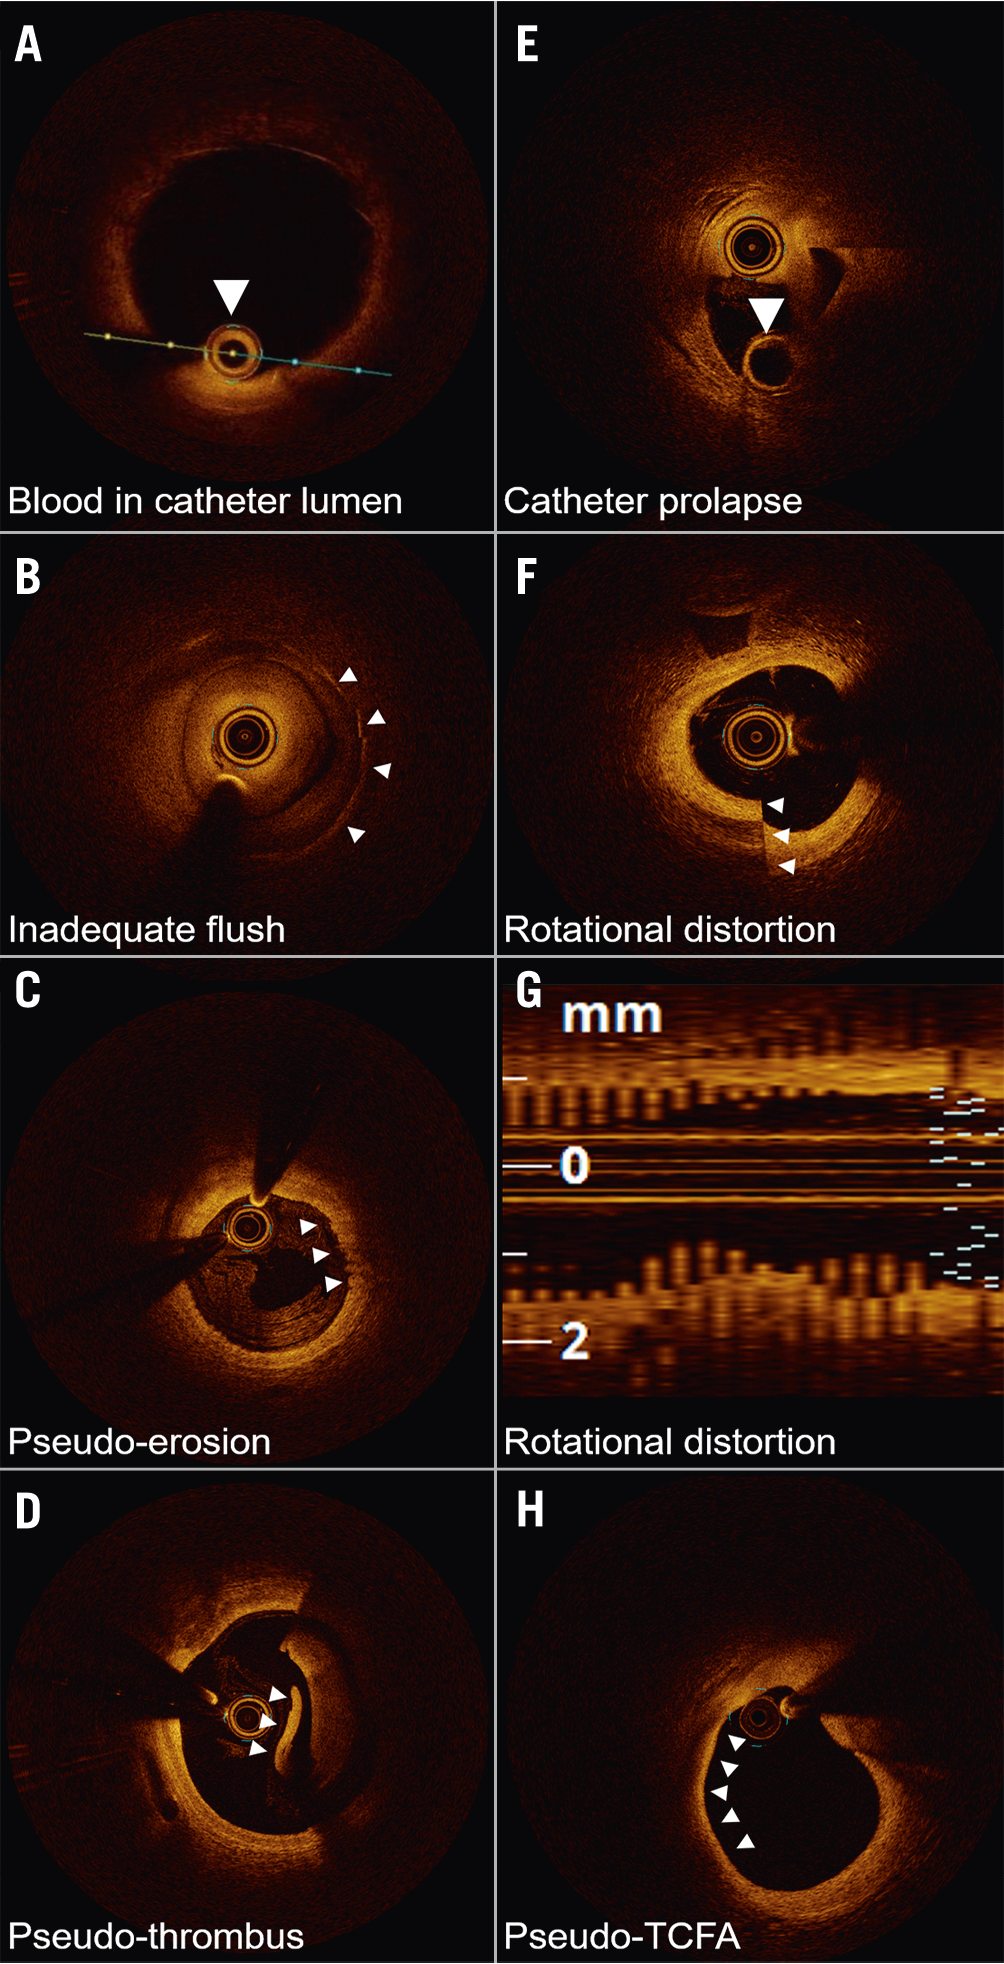
Figure 4. Optical coherence tomography imaging artefacts. A) Blood accumulation within the catheter (arrow) attenuates the near-infrared light transmission, obscuring the image. B) Poor flush, often occurring at the beginning or end of the optical coherence tomography (OCT) image acquisition, mimics the appearance of neointimal hyperplasia over the stent struts (arrows). C) Haematic components within flush media refract light, creating an artefactual appearance of an erosion (arrows). D) Poor flush clearance of blood gives the appearance of red thrombus. Layering pattern (arrowhead) suggests artefact. E) The OCT catheter is folded on itself, with imaging lens prolapsed over the empty rapid exchange port (arrow). F) Non-uniform rotational distortion demonstrating a split appearance, confirmed on the (G) longitudinal image demonstrating the classic saw-tooth pattern. H) Thin-cap fibroatheroma (TCFA) artefact is most commonly seen at bends in the artery wall or in large vessels where the distance required for the light to travel and poor tissue penetration generate the false appearances.
The catheter location within the vessel lumen and the vessel diameter can affect the OCT image. The catheter may prolapse on itself if undue force is used (Figure 4E). Additionally, movement of the imaging catheter, due to rotation and pullback speed, can alter the OCT image appearance. Non-uniform rotational distortion (NURD) is due to non-constant angular velocity of the monofibre optical catheter and appears as a blurring or smearing in the lateral direction. NURD occurs due to rotational resistance in the catheter due to a tortuous or narrow vessel, a tight haemostatic valve, or a crimped catheter sheath (Figure 4F, Figure 4G). When the imaging catheter is positioned close to the arterial wall such that the light is emitted parallel to the tissue surface, that part of the arterial wall may appear to attenuate the light when in reality the optical beam is not penetrating that region. This artefact may be confused with the appearance of TCFA, superficial accumulation of macrophages, lipid pool, or necrotic core (Figure 4H).
OCT has some recognised limitations. OCT performs poorly in assessing the aorto-ostial coronary segments. This weakness is due to difficulty in obtaining optimal blood clearance at the coronary ostia. Using techniques such as gentle withdrawal of the guiding catheter during contrast injection, while useful, does not always result in adequate clearance and acceptable image quality in coronary ostia. Some authors have reported their experience with OCT for PCI guidance in the left main coronary artery, which is feasible for lesions located at the mid segment and distal left main bifurcation but remains challenging at the ostium even in highly experienced hands51.
OCT: ACUTE CORONARY SYNDROMES
The high resolution of OCT enables identification of the details relevant to PCI strategy in acute coronary syndromes (ACS), such as plaque rupture, erosion, thrombotic debris, dissection, calcified nodules, calcium requiring lesion preparation, and TCFA52,53. This section will focus on morphological considerations in ACS.
The most common underlying culprit lesion for ACS in patients with obstructive atherosclerotic coronary disease is a ruptured lipid-rich plaque54,55. On OCT, ruptured plaque is identified by the presence of discontinuity in the fibrous cap that is associated with a cavity inside a lipid-rich plaque (Figure 5A-Figure 5E). Overhanging thrombotic material is often visualised in patients presenting acutely, but its presence is not mandatory for diagnosis since the early use of antithrombotic and antiplatelet drugs may dissolve the thrombus before coronary catheterisation is performed or thrombi may be mechanically removed if aspiration thrombectomy is performed. Although plaque rupture is the most frequent finding in ACS, pathologic studies have demonstrated the presence of plaque erosion in about 20-30% of patients (Figure 5F-Figure 5J),56. The ability to differentiate between plaque rupture and erosion is potentially helpful in guiding treatment strategies, perhaps with deferral of stenting in non-critical stenoses with plaque erosion (Figure 6),57, although randomised data are warranted before this approach can be broadly recommended.
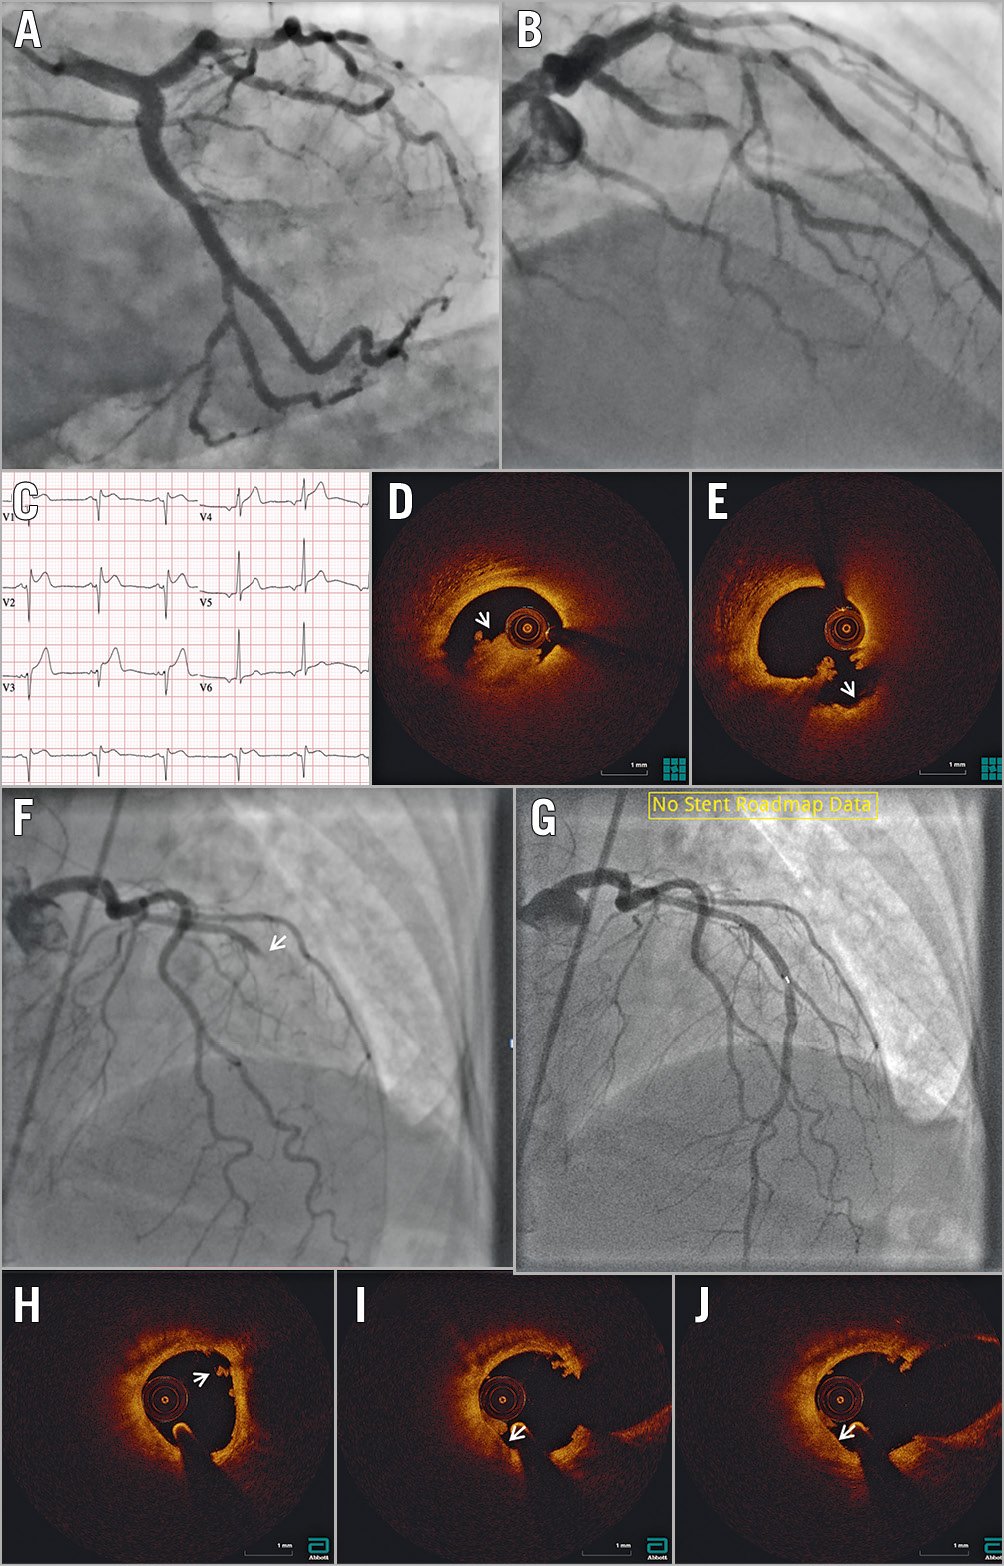
Figure 5. OCT in ST-segment elevation myocardial infarction. A) & B) Angiography does not identify a clear culprit lesion. C) Based on ST-segment elevation in the anterior leads, suggesting myocardial infarction with non-obstructive coronary arteries (MINOCA), optical coherence tomography (OCT) was performed in the left anterior descending coronary (LAD) artery, identifying (D) red thrombus (arrowhead) just proximal to the dominant septal. Following aspiration (E), repeat OCT shows the typical appearance of a crater with a smooth inner surface (arrowhead). F) Angiography identifies an occlusion at the mid-LAD segment (arrowhead). G) Following aspiration, repeat OCT with angiographic co-registration identifies (H) white thrombus (arrowhead) with no underlying plaque rupture. I) & J) Notably, white thrombus is adherent to a high attenuation thin-cap fibroatheroma (arrowhead), suggesting the possibility of erosion as the mechanism of MINOCA. The patient was started on dual antiplatelet therapy and the stent was not placed.
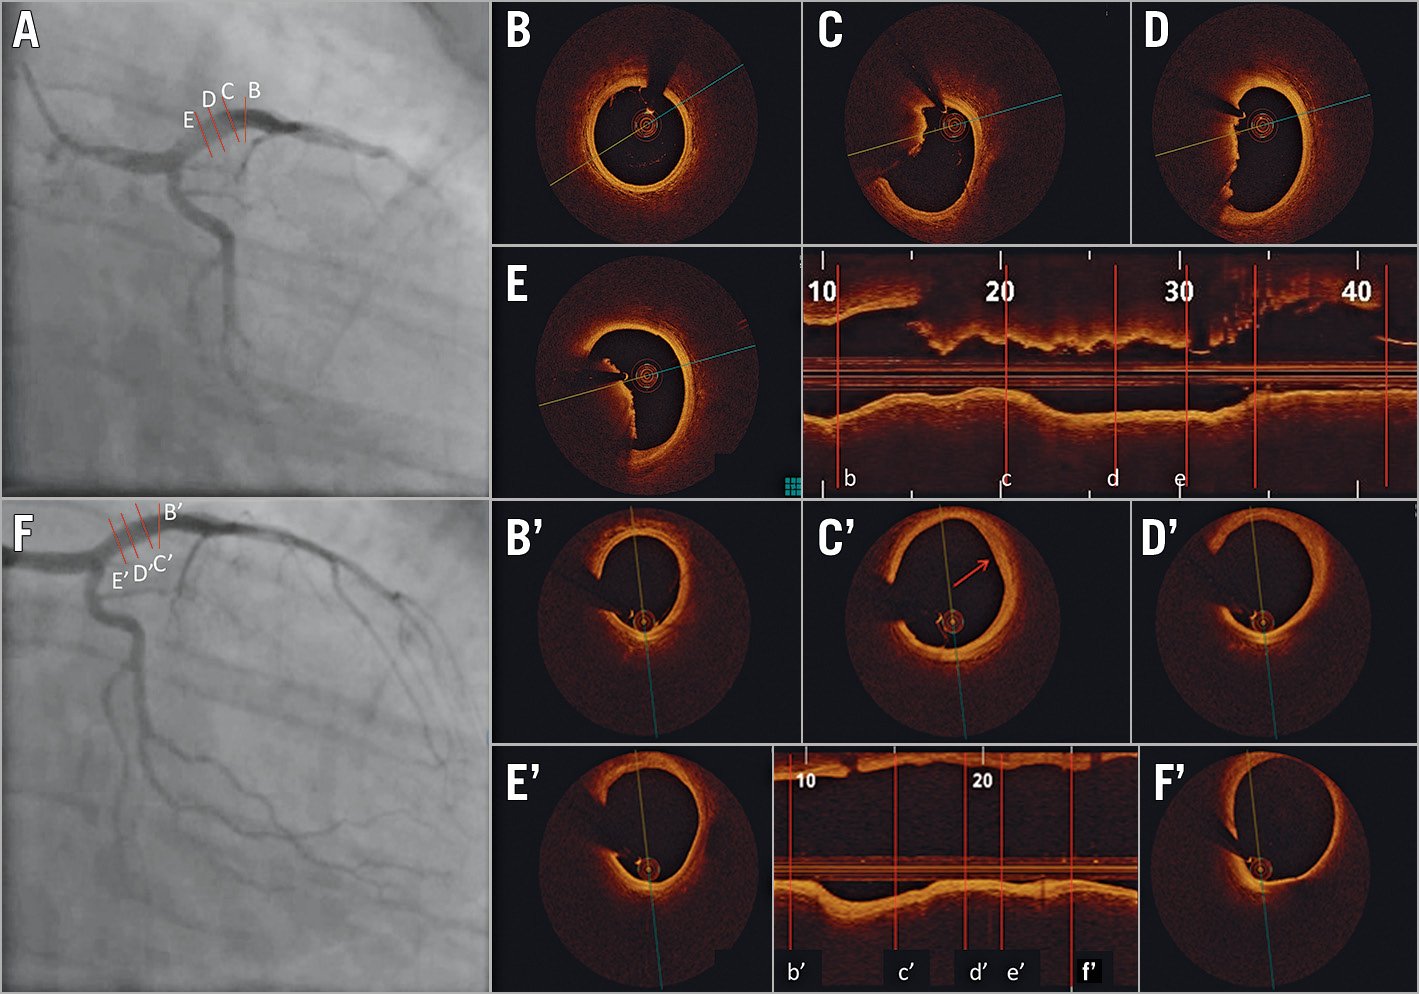
Figure 6. Acute coronary syndrome secondary to thrombotic lesion managed with medical therapy using optical coherence tomography guidance. A 33-year-old male current smoker presented to the emergency department with chest pain and positive cardiac biomarkers. A) Coronary angiography revealed haziness in the proximal left anterior descending (LAD) artery. Optical coherence tomography (OCT) on cross-sectional and longitudinal images (B, b) demonstrated a normal segment at the mid-LAD segment but with (C-E, c-e) large non-occlusive thrombus proximally (minimal lumen area: 9 mm2). The patient was treated with glycoprotein IIb/IIIa antagonists for 48 hours and was subsequently discharged on triple therapy with warfarin, aspirin, and clopidogrel. The patient returned for angiography and OCT six weeks later. On cross-sectional and longitudinal analysis of the images that were co-registered with the index OCT, there was (Bʹ, bʹ) a normal mid-LAD artery segment, and (Cʹ-F', cʹ-f') complete resolution of thrombus with a possible area of healed erosion (Cʹ, cʹ). Images courtesy of Mullasari Ajit Sankardas, MD, DM, FRCP.
The pivotal histopathological criterion to identify plaque erosion is the absence of endothelial lining over the underlying plaque. Despite its high spatial resolution, OCT is unable to evaluate the presence of endothelial disruption58. Diagnosis of plaque erosion on OCT is, therefore, based mainly on the exclusion of ruptured fibrous cap56. The most frequent subtle changes observed on OCT in plaque erosion are: (a) white thrombus on an intact fibrous cap, (b) no thrombus but presence of an irregular lumen surface, or (c) thrombus attenuating the underlying plaque in the absence of lipidic plaque or calcification immediately proximal or distal to the site of thrombus (Supplementary Figure 8). Plaque erosion may be defined as “definite” when there is visualised thrombus on an intact fibrous cap or “probable” in the absence of rupture or thrombus but with luminal irregularity present.
Calcified nodules are the least common cause of ACS. Both pathologic55 and imaging studies59 have confirmed the existence of calcified nodules and their clinical impact56,60. Recently, Sugiyama at al60 conducted a detailed analysis of calcified plaques on OCT in patients with ACS to study the prevalence of different morphologies of calcific plaques at the culprit lesion site. Calcification at the site of the culprit lesion was found in 157 out of 1,241 (12.7%) patients presenting with ACS in whom OCT assessment was undertaken prior to intervention. The authors identified three different plaque types at the site of culprit lesions (Supplementary Figure 9), namely eruptive calcified nodules, superficial calcific sheet, and calcified protrusion (with a prevalence of 25.5%, 67.4%, and 7.1%, respectively)60. Of these calcific plaque subtypes, eruptive calcified nodules are shown to be responsible for ACS in histopathologic studies, whereas calcific sheet and calcified protrusion are a part of the underlying fibroatheroma and are not shown to be the cause of ACS. Indeed, a recent study by Prati et al61 showed that calcified nodules with disruption of the fibrous cap versus those without were associated with an ≈6.5-fold higher risk of cardiac mortality. Nonetheless, all three calcific plaque types were associated with more periprocedural complications and suboptimal PCI results compared with non-calcified culprit plaques (Figure 7),60. Eruptive calcified nodules were frequently located in the right coronary artery (44.4%), whereas superficial calcific sheets were most frequently found in the left anterior descending artery (68.4%)60. The exact biology leading to the different types of calcified nodules remains controversial. One current hypothesis is that mechanical stress could fragment sheets of calcium, resulting in small nodules that are surrounded by fibrin that may eventually erupt through the plaque surface. Eruptive calcified nodules are frequently located in the mid right coronary artery where cyclic hinge movement may cause weakening of calcified plaques leading to fracture60,62.
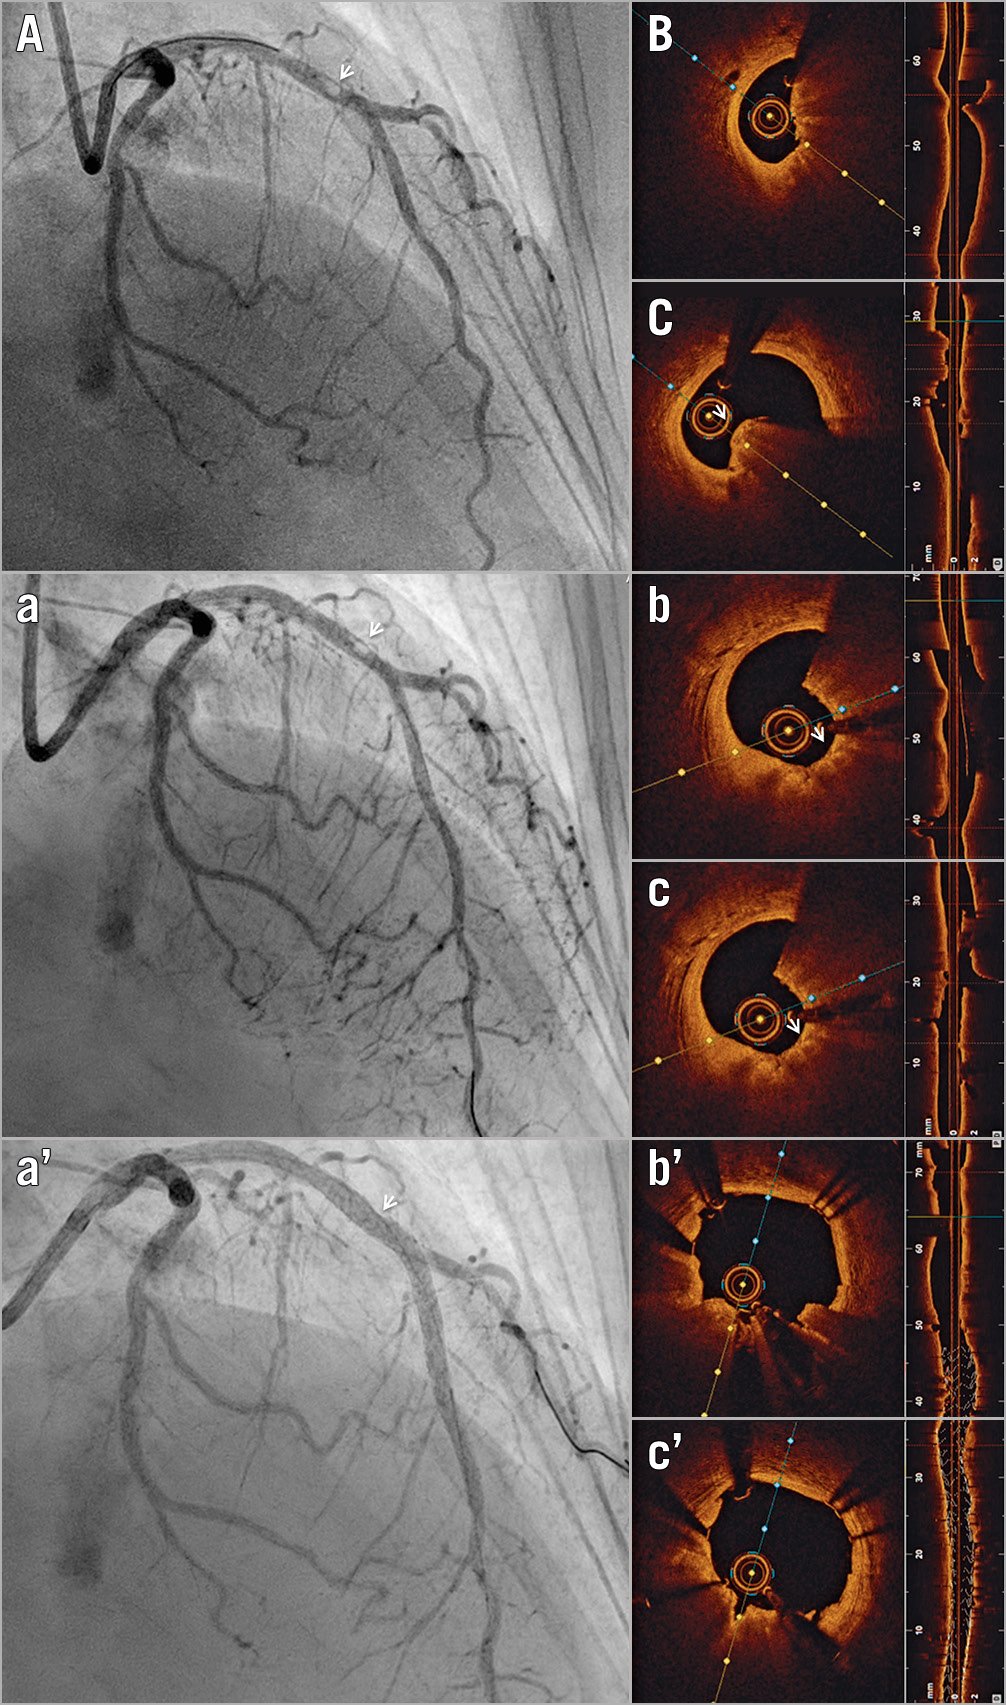
Figure 7. Optical coherence tomography-guided percutaneous coronary intervention on a calcific protruding nodule. A) Angiography shows a mid-left anterior descending (LAD) nodular obstruction (arrowhead). B) Optical coherence tomography (OCT) imaging reveals a small minimal lumen area and (C) confirms the aetiology of the obstruction to be a calcific protruding nodule (arrowhead). (a) Following rotational atherectomy, the lesion appears mildly less stenotic angiographically (arrowhead). (b, c) OCT imaging reveals significant debulking of the calcified nodule (arrowhead). Note the smooth polished surface in the direction of the catheter bias where the burr exerts its action. (aʹ) Final angiography shows mild residual diameter stenosis (arrowhead). (bʹ, cʹ) OCT imaging confirms further luminal gain and exclusion of the calcific nodule, with minimal eccentricity and malapposition.
Recently, OCT has been shown to be beneficial in the diagnostic work-up of MI with non-obstructive coronary arteries (MINOCA)63. In women with MINOCA (i.e., coronary artery disease with <50% diameter stenosis on angiography), a definite or possible culprit lesion was identified by OCT in 46% of the participants. The most common OCT findings were plaque rupture, intraplaque cavity, and layered plaque (Supplementary Figure 10). Similarly, in patients with non-ST-segment elevation ACS (NSTEACS) and multivessel disease, coronary angiography alone may be insufficient to identify the culprit lesions64. An identifiable culprit lesion may be absent in up to 30% of patients with NSTEACS, and >10% of patients may have multiple culprit lesions on angiography. Even in patients presenting with ST-segment elevation MI (STEMI), the culprit lesions may not be identifiable in up to 4-10% of cases by angiography alone65. OCT can be helpful in resolving the ambiguity regarding the culprit plaques in these instances.
Subclinical atherothrombosis and plaque healing may lead to rapid plaque progression. The histopathologic healed plaque has a layered appearance when imaged using OCT66,67,68,69. Layered plaques were identified in three quarters of patients with acute MI, especially in the culprit plaques of patients with ST-segment-elevation MI. Layered plaques had a limited, focal distribution in the left anterior descending artery and left circumflex artery but were more evenly distributed in the right coronary artery and were characterised by greater lumen narrowing at both culprit and non-culprit sites69.
Finally, spontaneous dissections and intramural haematoma are readily identified on OCT and are occasionally found in patients presenting with ACS with or without angiographically discrete lesions (Supplementary Figure 11),70.
OCT: HIGH-RISK PLAQUES
OCT has been used to identify lesions with high-risk features (i.e., “vulnerable plaques”) that may be associated with ACS, including TCFAs and inflamed plaques, which are identified with macrophage infiltration. Compared with IVUS-based modalities, the ability to measure cap thickness on OCT due to its superior resolution improves detection of TCFAs. Notably, while validated in prospective studies on the natural history of atherosclerosis71,72,73, TCFAs were removed from the high-risk plaque characteristics in the recent PROSPECT II74 and PROSPECT ABSORB75 studies, due to the diagnostic ambiguity that exists with regard to the identification of TCFAs on IVUS.
In the CLIMA study, in 1,003 patients undergoing OCT of the proximal left anterior descending artery, 37 patients (3.7%) suffered a “hard event” (25 cardiac deaths and 13 target segment MI) at one year76. When all four predefined high-risk plaque features (MLA <3.5 mm2, TCFA with cap thickness <75 μm, lipid arc >180°, and macrophage infiltration) were present, the hazard ratio for the primary endpoint was as high as 7.54. In a study of 1,474 patients, Xing et al77 reported that OCT-detected lipid-rich plaques were associated with a higher rate of major adverse cardiac events (cardiac death, acute MI, and ischaemia-driven revascularisation) compared with non-lipidic plaques at two years.
Nevertheless, several issues regarding the detection of vulnerable plaques by OCT and its prognostic value, particularly with TCFAs78,79, remain unresolved, including modest inter-observer agreement for cap thickness and lipid arc measurements80, artefacts mimicking lipid81, and exceedingly low event rates in patients with TCFAs77. Some features of vulnerable plaques, such as intraplaque haemorrhage, are not readily identifiable on OCT alone. Future studies are warranted to establish whether OCT alone or in combination with other imaging modalities82, such as hybrid IVUS/OCT8, near-infrared autofluorescence to detect necrotic core83 or intraplaque haemorrhage84, or near-infrared spectroscopy to detect lipid (Supplementary Figure 12), will have clinical impact.
It is plausible that detection of vulnerable plaques in selected patient populations, including patients at high risk of future events (e.g., with prior ACS or diabetics), may be of clinical significance. Indeed, in the OCT substudy of the COMPLETE trial, nearly 50% of patients had at least one obstructive non-culprit lesion containing TCFA. Obstructive lesions more commonly harboured vulnerable plaque morphology, including TCFA, high lipid burden, macrophages, and cholesterol crystals, than non-obstructive lesions. These findings were postulated to drive the benefit of routine PCI of the obstructive non-culprit lesions in patients with STEMI and multivessel disease85. In the recent COMBINE OCT-FFR study of diabetic patients with intermediate lesions and fractional flow reserve >0.80, the presence of TCFA (in 25% of lesions) was associated with a 4.7-fold increase in the primary endpoint of cardiac death, target vessel MI, target lesion revascularisation, or hospitalisation for angina (Combined optical coherence tomography and fractional flow reserve assessment to better predict adverse event outcomes in DM patients: COMBINE (OCT-FFR) study. Presented by E. Kedhi at TCT Connect 2020, 14 October 2020). This increase in event rates was driven mostly by higher rates of target lesion revascularisation and hospitalisation for angina, with a rate for target vessel MI of 4.1%.
OCT: SHORT- AND LONG-TERM ASSESSMENT OF STENTS
OCT is useful in surveillance of stents and bioresorbable scaffolds, particularly in assessment of neointima, neoatherosclerosis, resorption of scaffolds, and mechanisms of stent failure and stent thrombosis. Strut coverage is frequently used as a surrogate for healing around the stent struts, assuming that it represents endothelialisation; however, strut coverage may be due to fibrin86, and resolution of OCT is not adequate to visualise endothelial cells87.
Neointimal patterns on OCT have been correlated to specific tissue types, with the “homogenous pattern” often correlating with smooth muscle cells within collagenous and proteoglycan matrix, the “layered pattern” with healed neointimal rupture or erosion, and “high intensity with high attenuation” with superficial macrophage accumulation; nonetheless, each pattern may also correlate with other tissue types88. Hybrid imaging with OCT may overcome the limitations of OCT alone in determining the components of neointima and assessment of post-stenting healing82.
Chronic inflammation and impaired endothelial function with increased lipid uptake contribute to the development of late neointima within the stent struts, which is a mechanism for stent restenosis and late (>30 days) and very late (>12 months) stent thrombosis89,90,91,92. Strut malapposition and underexpansion were associated with acute stent thrombosis (<24 hours post PCI) and subacute stent thrombosis (1-30 days). It is important to note that OCT findings in stent thrombosis may be mechanistically related but, strictly speaking, causality cannot be inferred from registry data. Based on these observations, the European Society of Cardiology guidelines for revascularisation recommend that, in the cases of stent failure, OCT use should be considered to identify and correct the underlying mechanical factors93.
OCT VERSUS IVUS VERSUS ANGIOGRAPHY IN REGISTRIES AND RANDOMISED TRIALS
Evidence suggesting a clinical benefit for using IVUS for PCI guidance has been shown in several registries94, randomised trials4,95, and meta-analyses96,97. In randomised trials, IVUS guidance is associated with a reduction in major adverse cardiac events, and in meta-analyses, with reduced cardiovascular mortality, MI, and stent thrombosis compared with angiography guidance7. The differences between IVUS and OCT, their relative merits, and specific applications in different lesion types and clinical scenarios, have been reviewed previously98.
As OCT is a relatively new modality, it currently lacks the robust evidence that has accumulated for IVUS-guided PCI. Completed and enrolling trials of OCT-guided PCI are shown in Table 2. In the earliest studies, OCT was demonstrated to impact significantly on the procedural strategy. In the CLI-OPCI trial of 670 patients comparing angiography with an OCT-guided strategy, adverse features requiring further intervention were identified in 35% of cases on OCT99. Moreover, OCT guidance was associated with a significantly lower risk of MI or cardiac death at one year after adjustment for potential confounders.
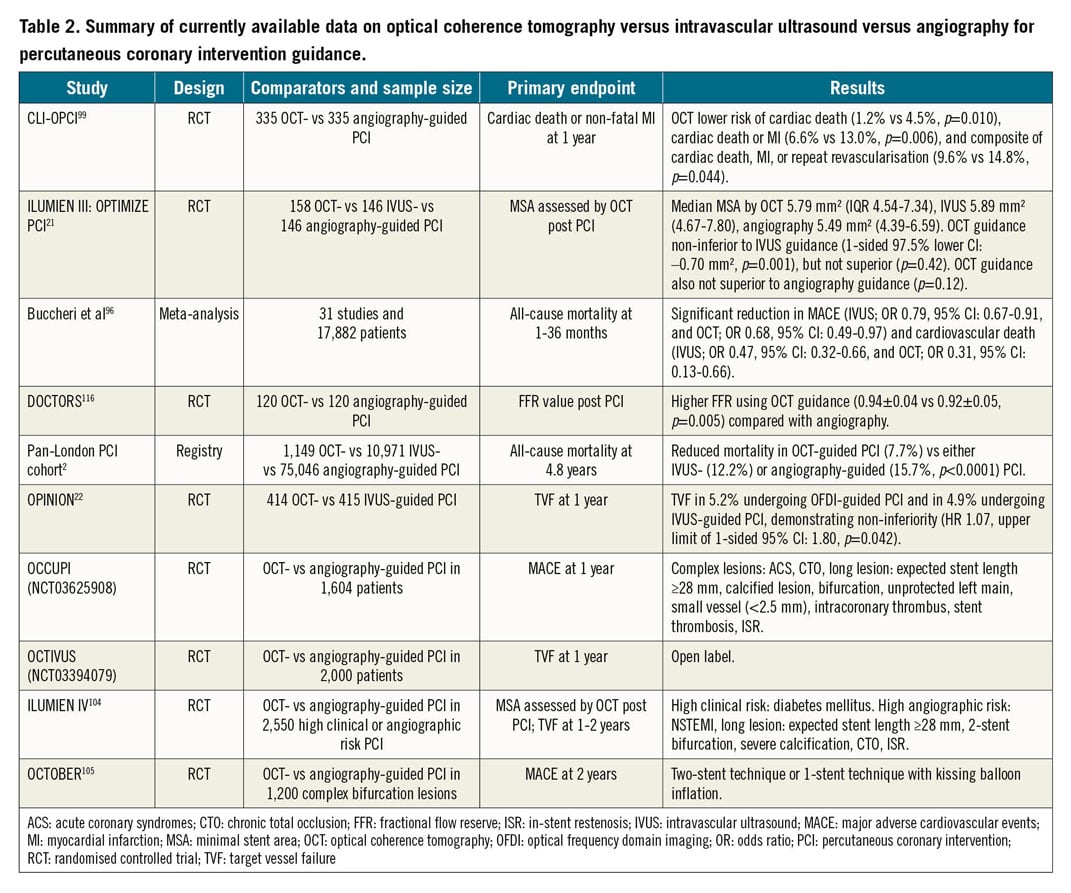
The OPINION trial22, which included 829 patients, was the first clinical outcomes-based randomised trial that compared OCT- and IVUS-guided PCI, with a primary endpoint of target vessel failure at one year. The primary endpoint did not differ between the two imaging modalities, with OCT demonstrating non-inferiority compared with IVUS. Similarly, the major secondary endpoint of angiographic binary restenosis was not different at eight months. One of the criticisms of the OPINION trial is that stent sizing with IVUS was guided by the EEL-based diameter measurements, whereas, with OCT, stents were selected based on lumen diameter measurements98. Compared with IVUS, visualisation of the EEL is more challenging on OCT, particularly in the presence of lipidic plaque. The OPINION trial and previous studies have shown that EEL-based stent sizing strategies result in the selection of larger diameter balloons and stents and more frequent post-dilation compared with lumen-based diameter measurements100,101. As lower MSA has consistently been shown to be a pre-eminent cause of late DES failure3,44,45,46,47,48,49,50, the difference in stent sizing strategy in these previous studies may have been a disadvantage for OCT in comparison with IVUS.
The ILUMIEN III trial21 compared OCT-, IVUS-, and angiography-guided PCI using an EEL-based sizing strategy in the OCT arm. In 450 patients, OCT-guided PCI was non-inferior to IVUS-guided PCI in terms of final MSA (but not superior to angiography); however, OCT-detected major stent edge dissections (dissection flap >60° or >3 mm in length) were less common in the OCT-guided arm versus the IVUS-guided arm. OCT guidance also resulted in more frequent post-dilation, larger maximum balloon size, and higher balloon pressure in comparison to angiography guidance alone. One-year clinical outcomes comparing the three groups were similar, although the trial was grossly underpowered to detect any differences102. Similar findings were recently reported in the smaller MISTIC-I trial (n=109)103.
Insights into the potential benefit for OCT guidance to improve clinical outcomes come from a much larger population of patients in a network meta-analysis of 17,882 patients82. In this analysis, important reductions in both major adverse cardiac events and cardiovascular mortality using OCT- or IVUS-guided versus angiography-guided PCI were identified. Data supporting the utility of OCT guidance in PCI are also provided from the large Pan-London PCI cohort registry2. In 123,764 patients who underwent PCI in London between 2005 and 2015, OCT was used in 1,149 (1.3%) and IVUS in 10,971 (12.6%) patients. OCT-guided procedures were associated with greater procedural success rates and reduced rates of in-hospital major adverse cardiac events. A significant difference in mortality was observed between patients who underwent OCT-guided PCI (7.7%) compared with patients who underwent either IVUS-guided (12.2%) or angiography-guided (15.7%) PCI (p<0.0001). These results persisted after propensity matching in the OCT versus angiography guidance cohorts (hazard ratio [HR] 0.39, 95% confidence interval [CI]: 0.21-0.77; p=0.0008).
The ILUMIEN IV104 and OCTOBER trials105 are two large ongoing randomised trials that aim to determine the clinical impact of OCT-guided versus angiography-guided PCI. ILUMIEN IV is a prospective, single-blind, global, multicentre randomised trial comparing OCT-defined EEL-based PCI guidance to angiography-guided PCI in complex patients and coronary lesions. The OCTOBER trial will compare two-year clinical outcomes after OCT-guided versus angiography-guided revascularisation in patients requiring complex bifurcation stent implantation (Supplementary Figure 13).
OCT in progress and future iterations
Blood clearance needed for OCT image acquisition increases the radiocontrast burden, which is undesirable in patients with renal disease. Several alternative flushing agents have been investigated106. Low-molecular-weight dextran produces image quality comparable to radiocontrast107,108; however, dextran is excreted from the kidneys and has the potential to cause renal injury by the same mechanism as contrast108. Carbon dioxide has been used for peripheral angiography109; however, it is unsuitable for coronary imaging due to precipitation of myocardial ischaemia. Although a clear crystalloid solution such as Ringer’s solution has been used in the older occlusive OCT acquisition technique, and more recently normal saline has been shown to produce images with similar quality to contrast OCT acquisitions (Figure 8),110, problems with blood mixing and potential for precipitation of arrhythmia with non-contrast flushes exist. Alternative non-contrast flush media with similar biocompatibility, viscosity, blood clearance capability, and optical transparency are needed to address this issue and are being investigated.
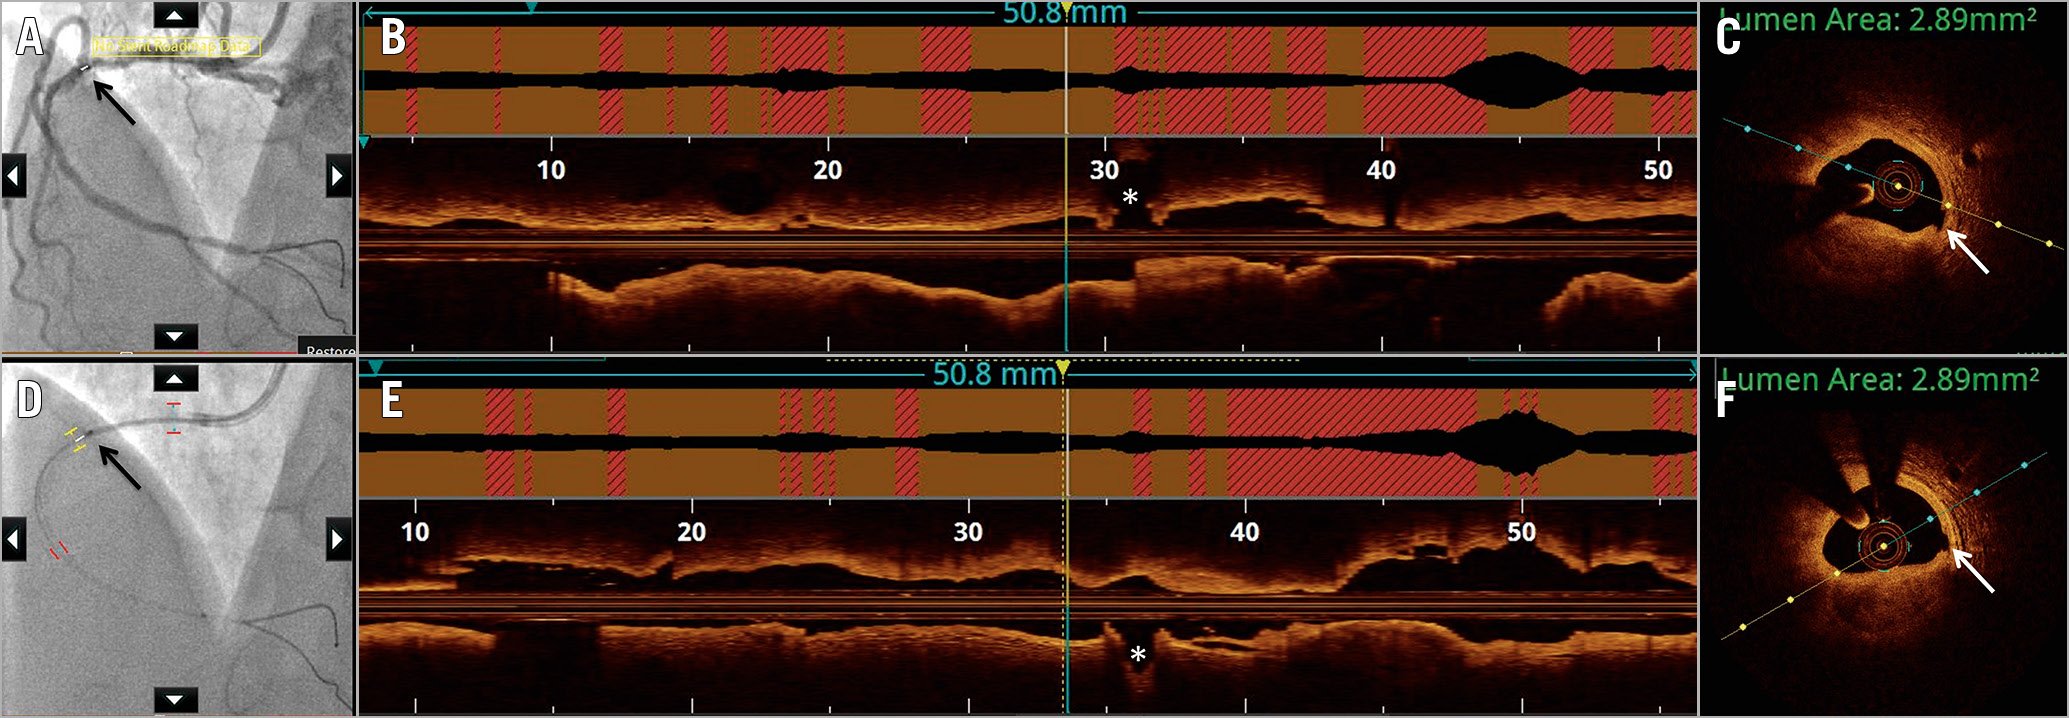
Figure 8. Saline as flush medium for image acquisition by optical coherence tomography. Optical coherence tomography (OCT) images acquired using the standard radiocontrast to displace blood (A-C) are compared with image acquisition by saline (D-F). A) Angiographic co-registration (white bar and black arrow) with corresponding segment on longitudinal frame on OCT (yellow and blue vertical lines), just proximal to the acute marginal branch (asterisk) (B). C) A cross-sectional frame with luminal area measured at 2.89 mm2 due to stenosis by nodular calcification. Note the small intimal disruption (white arrow). D) Co-registration (black bar and black arrow) with OCT acquired using saline at the same location as the radiocontrast acquisition, proximal to the acute marginal branch (asterisk) (E). F) The cross-sectional area at the same OCT frame as in (C) also measures 2.89 mm2, with calcification and small intimal disruption (white arrow) similarly identifiable.
Ongoing developments have focused on engineering new OCT systems to increase the speed of OCT acquisition (e.g., within a single cardiac cycle with full sampling both cross-sectionally and longitudinally)111, spatial resolution (e.g., “micro OCT” with ~2 μm isotropic resolution, capable of identifying cellular [macrophages, endothelial cells] and sub-cellular [extracellular cholesterol crystals] structures112), and penetration depth. Further studies are needed to validate these new advances and their putative clinical impact.
Although intravascular imaging and intracoronary physiology are often grouped together, there is a dichotomy between the use of imaging and that of physiology to guide PCI in clinical practice. Which modality has a greater clinical utility is a matter of great debate. A recent trial113 compared OCT guidance versus fractional flow reserve guidance in patients with angiographically intermediate coronary lesions in a single-centre, prospective, 1:1 randomised trial. In 350 patients, the primary endpoint of major adverse cardiac events or significant angina at 13 months occurred in 14.8% of patients in the physiology arm and in 8.0% in the OCT arm (p=0.048)113. In this regard, OCT-based flow ratios may provide the benefit of both modalities combined. The optical flow ratio has been developed and validated against fractional flow reserve to determine the functional significance of coronary stenosis (Figure 9),114. The currently enrolling FUSION trial (NCT04356027) will assess the accuracy of off-line, OCT-based virtual flow reserve against fractional flow reserve on the ILUMIEN™ OPTIS™ platform (Abbott Vascular).
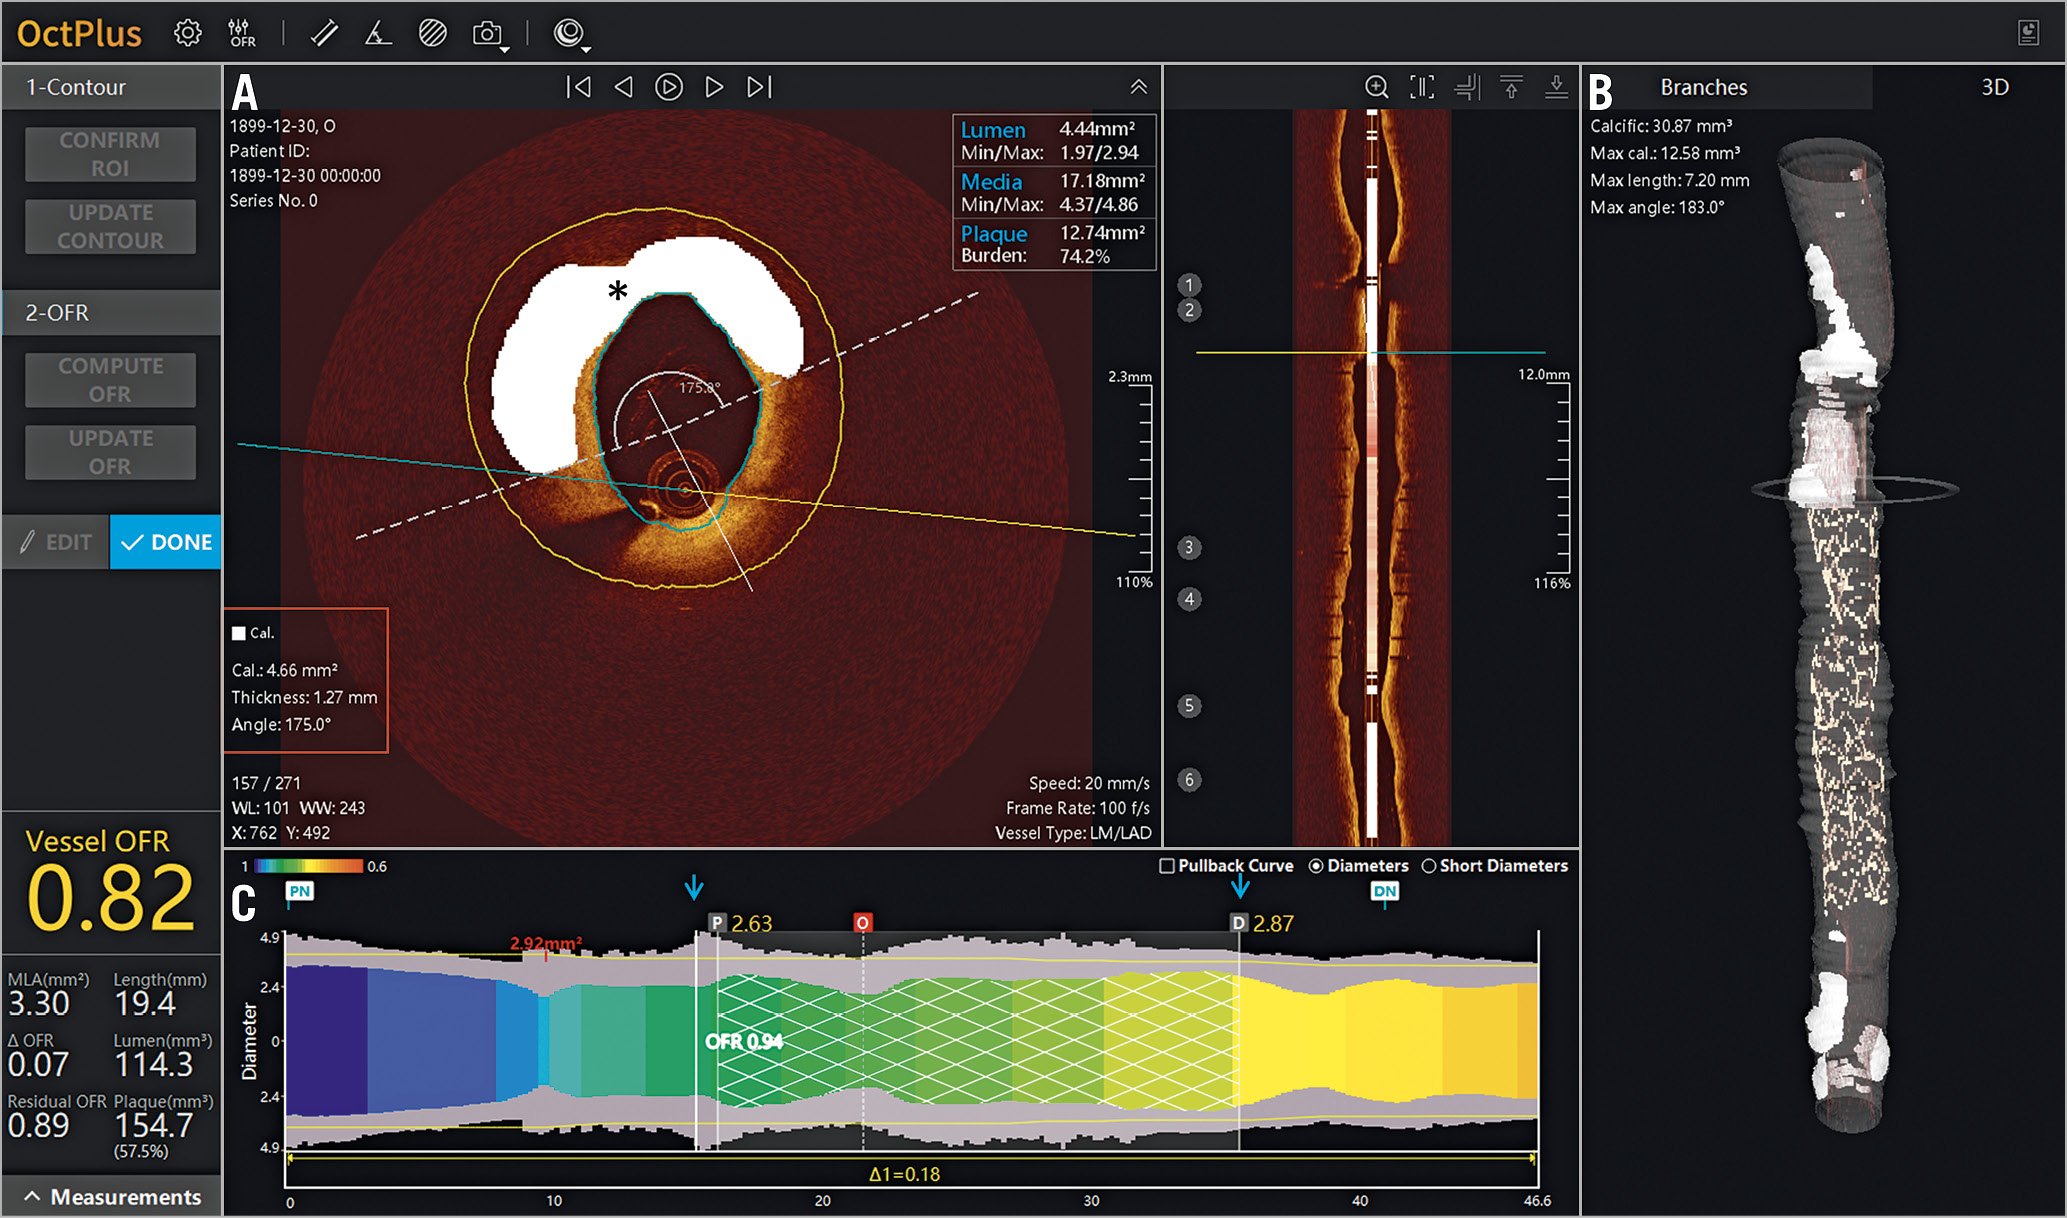
Figure 9. Plaque characterisation with combined optical coherence tomography and fractional flow reserve. New optical coherence tomography (OCT) system demonstrates (A, B) automated plaque characterisation (calcium denoted in white marked by asterisk) with details relevant to lesion preparation (red box). C) Using a lumen profile, the virtual OCT-derived fractional flow reserve (FFR) is displayed as a coloured map, showing areas of potential ischaemia (yellow), FFR within the stented segment (blue arrows), as well as for the whole vessel. Images courtesy of Shengxian Tu, PhD.
Assessment of vascular morphology on OCT remains a manual task and is thus time-consuming and labour-intensive. Promising progress has been made in developing algorithms for automated tissue classification using texture, attenuation, or other tissue characteristics on OCT that may aid in automated OCT image segmentation and interpretation (Figure 9, Supplementary Figure 12).
Conclusion
Intravascular OCT provides a wealth of data on coronary structures and pathologies, with rapidly progressing applications for the diagnosis and management of coronary artery disease. Systematic efforts are ongoing to educate the interventional cardiology community on the appropriate use and interpretation of OCT images, using practical algorithmic approaches. Robust evidence from the ongoing randomised trials on the impact of OCT guidance in improving clinical outcomes could increase the adoption of this imaging modality in clinical practice.
Conflict of interest statement
Z.A. Ali reports institutional research grants to Columbia University from Abbott and Cardiovascular Systems Inc., being a consultant to Amgen, AstraZeneca, and Boston Scientific, and having equity in Shockwave Medical. G.S. Mintz reports honoraria from Abiomed, Boston Scientific, Medtronic, and Philips. A. Maehara reports grant support from and being a consultant for Abbott Vascular and Boston Scientific. R.A. Shlofmitz reports speaker fees from Shockwave Medical. The other authors have no conflicts of interest to declare.
Supplementary data
To read the full content of this article, please download the PDF.