Abstract
Atherosclerotic cardiovascular disease is a leading cause of morbidity and mortality despite the widespread use of established medical therapies. This has prompted the search to identify new therapeutic approaches to achieve more effective prevention of cardiovascular events. Considerable interest has focused on the role of surrogate markers of therapeutic efficacy in the early evaluation of novel anti-atherosclerotic therapies.
Monitoring changes in the extent of coronary atherosclerosis with intravascular ultrasound (IVUS) has been increasingly employed in clinical trials to assess progression and regression of atherosclerosis. This is based on the pivotal role that atherosclerotic plaque plays in the natural history of cardiovascular disease and the acceptance of validated arterial imaging approaches including coronary angiography and carotid intimal-medial thickness by regulatory authorities. The ability to generate high-resolution imaging of the entire thickness of the coronary artery wall permits evaluation of the entire burden of atherosclerotic plaque.
In order to understand the differences, similarities, limitations and pitfalls of the IVUS technique among different academic core laboratories, a number of meetings of representatives from these groups were convened in 2007 and 2008. This document is the result of those IVUS methodology meetings that assembled experts from core laboratories to discuss standards for image acquisition, definitions, criteria, analyses, and primary and secondary endpoints.
Equipment
Early studies that employed coronary IVUS imaging typically involved the use of one imaging system in terms of both catheter and console. With technological advances a number of systems and catheters are now available that permit high-resolution imaging within the coronary arteries. Given that studies often involve a large network of sites, there is likely to be marked heterogeneity in terms of imaging systems available among institutions and within each catheterisation laboratory. As a result, there is now a much greater risk that an individual subject is imaged with different systems at different time points. It is critical that every possible effort is made to ensure that an individual is imaged with the same equipment (catheters and consoles and pullback devices) for baseline and follow-up studies.
It is the responsibility of the core laboratory to qualify and specify the systems, catheters, and pullback devices used in each study. While multivariate analysis may be used to adjust for differences in cases where different systems are used within a single study, it remains to be determined whether this has any impact on the results. Regardless, every effort should be undertaken to include only imaging systems that have been demonstrated to produce high resolution imaging permitting precise measurements to a standard deemed appropriate for use by the core lab.
Consoles and catheters
Current rotating element IVUS catheters operate at frequencies between 40-45 MHz (most commonly 40 MHz); electronic phased array catheters operate at a centre-frequency of approximately 20 MHz. However, since the transducer manufacturing is difficult and performed under conditions of extremely high temperatures, the true centre frequency of individual ultrasound elements may deviate from published specifications. It is unknown whether this has any impact on measurements. Given the higher resolution imaging that is generated with higher ultrasound frequency, rotational catheters are more often used in studies that evaluate the impact of medical therapies on progression of atheroma volume.
The higher the frequency, the higher the resolution, but the lower the penetration1,2. However, recent improvements in transducer design have minimised the negative impact of higher frequencies on penetration. Improvement in the resolution of transducers is to be encouraged since it is expected that such improvements will decrease variability and improve reproducibility in the core lab analysis3. Manufacturers should report resolution, beam profile, bandwidth, and other technical data such as the variability between catheters and consoles and provide this data to the core laboratories. Manufacturers should also report the speed of sound used by the ultrasound consoles to produce the actual images. This speed of sound setting is important because it is the cornerstone of all dimensional measurements and is necessary to test phantoms and other standardisations. In the past, speed of sound was used to develop an algorithm to correct for in vivo measurement inaccuracies using the 30 MHz Boston Scientific catheter connected to a ClearView console (Boston Scientific, Natick, MA, USA)4.
Measurements made with rotating vs. electronic array transducers or even with different rotating transducers made by the same or different manufacturers can vary significantly5. This is the reason that it is critical that the same equipment (catheters and consoles and pullback devices) be used for baseline and follow-up studies. Different clinical sites can use different systems as long as same equipment and settings are used for each individual patient.
At the start of a study, the core laboratory or sponsor must contract with each of the IVUS companies to insure that an adequate supply of the same IVUS catheters and IVUS consoles/systems be available for the duration of the study and that technical support for existing consoles be maintained until the last patient has completed follow-up. In situations in which many patients have been imaged without standardising baseline and follow-up equipment, a mathematical transformation of the data can be considered; however, this should be revealed in the methodology of the final report. Alternatively, subjects imaged with different systems at baseline and follow-up can be considered major protocol deviators, a factor to be employed in subsequent per protocol analyses of data. Where sites have multiple imaging systems it should also be considered whether the site is designated to use one specific system at the commencement of the study to facilitate consistency of imaging systems for patients at different time points. In addition, it is advisable that the same “major” machine settings – especially, the “zoom” and frame rate – be standardised for baseline and follow-up studies. Finally, it is ideal – but, of course, not practical – that the same technical personnel be involved in the baseline and follow-up studies.
Experience has taught us that the performance of measurement software systems be evaluated in an objective and uniform manner. For example, quantitative coronary angiography (QCA) profoundly altered our approach to the assessment of percutaneous coronary interventions and strategies aimed to prevent recurrence and progression of stenoses. In one study 10 QCA systems at core laboratories in North America and Europe were validated. Cine films were made from phantom stenoses of known diameter (0.5 to 1.9 mm) under four different experimental conditions. The cine films were analysed by each automated QCA system without observer interaction. Accuracy and precision were taken as the mean and SD of the signed differences between the phantom stenoses; and the measured minimal luminal diameters and the correlation coefficient (r), the SEE, the y intercept, and the slope were derived by their linear regression. Performance of the 10 QCA systems ranged widely: accuracy, +0.07 to +0.31 mm; precision, ±0.14 to ±0.24 mm; correlation (r), 0.96 to 0.89; SEE, ±0.11 to ±0.16 mm; intercept, +0.08 to +0.31mm; and slope, 0.86 to 0.64.6
We do not have similar accuracy and precision data from various IVUS measurement software, especially ones that use different edge detection algorithms. Power calculations and study design should be adjusted for the precision of the off-line IVUS analysis systems and reproducibility of measurements within the core laboratory in order to avoid the risk of failing to detect small differences in patient populations. Phantom studies for all new equipment – hardware and software – should be performed and reported before the equipment is used in clinical practice or in clinical trials.
Pullback methodology for image acquisition
Automatic motorised pullback is mandatory usually at a rate of 0.5 or 1 mm/sec. Pullback accuracy is affected by factors apart from the pullback devices themselves especially comparing sheath-based versus non-sheath based catheters.7 In case of non-sheath catheters, the pitfalls of automatic pullback include presence of catheter slack outside the patient and friction in the coronary artery and guiding catheter during pullback affecting heterogeneity of pullback speed. Conversely, we believe that sheath-based, mechanical catheter systems allow smoother and more uniform pullbacks during image acquisition and are more precise in terms of length measurement. However, this is counterbalanced by the appearance of NURD (non-uniform rotation distortion) that is unique to mechanical, rotating, sheath-based transducer catheters. NURD can occur for a number of reasons and can be difficult to recognise. To minimise or eliminate NURD, the following are recommended: (1) Straighten the IVUS catheter. (2) Make sure that the haemostatic valve is not too tight. (3) Make sure that the guiding catheter is not too small or has too tight of a radius curve. (4) Select the least tortuous coronary segment for interrogation. If these are not effective and NURD persists, then the IVUS catheter should be changed.
The method of delivering power to an automatic pullback device potentially affects accuracy and consistency of the pullback speed. There are three different ways to deliver power and control the pullback device: battery, console that is not computer-controlled, and computer-controlled console. Tanaka et al7 evaluated the accuracy of four IVUS pullback systems by studying 180 patients (45 in each group) who had been treated with a single stent of known length ranging from 8 to 33 mm. The correlations between known stent length and IVUS-measured stent length were 0.92 for ClearView (Boston Scientific, Natick, MA, USA), 0.83 for Boston Scientific Galaxy (Boston Scientific, Natick, MA, USA), 0.63 for Endosonics Track-Back (EndoSonics Corporation, Rancho Cordova, CA,USA), and 0.69 for Volcano Model R-l00 research pullback device (Volcano Corp., Rancho Cordova, CA, USA). At a pullback speed of 0.5 mm/s, the authors reported that a 10% error would cause a 30 mm length of artery to be measured as 27 to 33 mm in length. It is important to make sure that batteries of a battery-powered pullback device are always at least 20% full to insure uniform pullback speed and to avoid having the pullback device fail in the middle of a run. Pullback devices should be tested from time to time either in a waterbed or against a single implanted stent of known length in a straight coronary segment. The pullback device is least accurate at the beginning of an imaging run (in the distal artery) and most accurate in the proximal artery. It is recommended that the pullback start at least 10 mm distal to the distal anatomical landmark (fiduciary point) – the most distal side branch accessible for the IVUS probe. It is also recommended that slack be removed from the IVUS catheter before starting automatic pullback. Ideally, the same pullback device should be used at baseline and follow-up.
Validation
Core laboratories should take part in validation studies of new imaging systems to insure that the imaging consoles and catheters employed in their studies generate high-resolution imaging required for accurate measurement of disease burden. This is often performed with the use of a phantom model employing a range of lumen dimensions. This will enable accurate validation of new imaging systems for potential use in future studies. Validation data should be available for review by trial sponsors and regulatory agencies.
Image acquisition
Site experience and training
It is important to select experienced IVUS operators and sites with research experience, infrastructure, and demonstrated recruitment and retention of patients during follow-up. The core lab should be involved in this selection process. Ideally, participating centres should have enrolled and followed up patients in other recent IVUS studies. The number of enrolled patients, quality of the recordings (ratio between enrolled patients and analysable IVUS), and the follow-up rate should be considered in site selection. Equipment, imaging standards, and imaging protocols should be defined prior to the start of the study. It is advisable that each site perform test runs of their processes prior to patient enrolment. There should be meetings with the IVUS investigators to discuss these issues both before the start of the study (before any baseline studies are acquired) and again before the start of the round of follow-up IVUS studies; test cases should be discussed at such meetings. Training of the sites is crucial, especially for sites that are working with the core laboratory for the first time. While it is possible for the ultrasound companies to provide some support, it is essential that training be supervised and directed by the core laboratory to insure that the imaging details required for the study are provided to and followed by the sites. During the course of the study, feedback to the clinical sites and investigators is crucial and should not be delayed. An example of a feedback form is shown in Appendix A.
Selection of patients
The natural history of coronary atherosclerosis involves progression with an increase in atheroma burden. To insure a cohort with disease progression, patients are selected for inclusion on the basis of established obstructive disease on a coronary angiogram performed for a clinical indication. Most groups typically require the presence of at least one lumen stenosis >20% by angiography. It has been established that such patients have diffuse coronary artery atherosclerosis that increases in severity over time. This enables assessment of therapies that might potentially slow disease progression. Patients with normal coronary angiograms are typically excluded as this will include some subjects with either no plaque or minimal disease. Patients with severe left main arterial disease or significant lumen stenoses of all three major epicardial coronary arteries are typically excluded due the high likelihood that they will require intervention during the course of the study and not be available for imaging at follow-up.
Selection of vessel for imaging
The study vessel should be selected based on standard angiographic findings. As the imaging resolution of non-invasive techniques such as computed tomography continues to improve, it will likely become possible to select the target vessel for invasive imaging on the basis of non-invasive findings. Some groups mandate that the vessel selected for IVUS imaging should include at least one diameter stenosis >20% by visual assessment of the angiogram and be the longest and least angulated vessel segment. Some groups require there to be a minimum plaque burden (atheroma area divided by external elastic membrane area) of 40% by IVUS. Other groups have not employed a minimal threshold of disease. However, from a practical standpoint, patients with no angiographic stenosis >20% are typically not randomised in these studies. Conversely, because the intent of the study is to evaluate the impact of medical therapies on the natural history of disease progression, vessels are usually excluded if they have undergone previous revascularisation.
Segment length
Given that there is an increase in variability when short segments are analysed, a minimum threshold of 10-15 mm is typically employed. However, all groups recommend the acquisition of at least 30 mm of analysable IVUS length between two landmarks, advising investigators to acquire a segment that is as long as possible. Increasing measured segment lengths has been one of the factors contributing to the reduction in measurement variability in more recent studies. In case of dysfunction of the equipment or poor acquisition due to technical difficulties (signal disappearing, spasm, ischaemia, etc.) the run should be repeated. Ideally imaging should always continue until the aorta is visualised. The entire imaging run should be recorded onto digital media to send to the core laboratory.
Measured pullback lengths of the same segment studied at baseline and follow-up are not always the same. This is one of the major determinants of reproducibility. Reasons include not starting the catheter distal enough so that slack is removed prior to reaching the distal fiduciary point, too small of a guiding catheter or too tight of a haemostatic valve so that there is resistance to transducer withdrawal, anatomic considerations such as tortuosity or a bend point or a tight proximal stenosis, problems with the pullback device itself, wrong pullback speed, battery power being too low, etc. Some groups apply a pre-specified threshold difference between baseline and follow-up measured segment lengths that automatically excludes a specific patient in the study with a recommendation that a 15% difference in length between baseline and follow-up is the maximum acceptable. If the difference between baseline and follow-up length is <15%, volumes should be calculated using the mean length from the two studies. In other groups algorithms are applied to normalise the ratio between image number and segment length. Regardless of the approach, it is imperative that any pullback that clearly indicates an erratic rate of pullback or catheter hang-up that results in a gross discordance between the two studies should be excluded from analysis. Accordingly, every effort should be made by the imaging physician to meticulously observe the images during pullback to detect any concern that would jeopardise its use for analysis and to repeat the pullback if required.
Use of adjunct pharmacology
Today most diagnostic coronary angiograms are performed without anticoagulation. When performing IVUS imaging, it is important to give the patient an anticoagulant (unfractionated or low molecular weight heparin, bivalrudin, etc.) before inserting the IVUS catheter into a coronary artery. Otherwise, there is a risk of thrombosis. It is also advisable to give intracoronary nitroglycerine (100-200 micrograms) before imaging to avoid catheter-induced spasm and minimise ischaemia; the dose should be limited only by the patient’s blood pressure.
Option for ECG gating
Motorised transducer pullback is critical for studies assessing progression and regression of atherosclerosis. However, all motorised pullback devices assume no cardiac motion. This is, of course, not correct; one previous study of 59 measurements in 31 patients showed that longitudinal catheter motion between systole and diastole averaged 1.50±0.80 mm (range 0.5 to 5.5 mm)8. This could result in a non-anatomically correct order (or scrambling) of the image slices during pullback9. However, at end-diastole the ultrasound catheter always returns to the same longitudinal location inside the coronary artery. ECG-gated image acquisition makes use of this periodic phenomenon.
ECG-gated IVUS image acquisition10,11 or co-registration of the ECG and IVUS images to select near end-diastolic beats (Volcano method developed for VH-IVUS) can resolve motion-induced artefacts allowing analyses using so-called longitudinal views without the typical saw-tooth shaped vessel appearance that makes contour detection difficult or even impossible10,11. However, ECG-gated image acquisition never gained much enthusiasm since a dedicated workstation and pullback device were necessary occupying valuable cath lab space and severely prolonging the IVUS examination possibly causing discomfort for the patient. Furthermore, there is a lack of convincing data to suggest that ECG gating results in more accurate assessment of atheroma burden.
Another option is an image-based, retrospective computer algorithm called the Intelligate® method9; it is capable of fully automatic selection of near end-diastolic frames from a non-gated continuous speed pullback IVUS. The algorithm has been validated against the hardware ECG-gated IVUS image acquisition method and takes on average 20 minutes to complete a single processing9. This approach eliminates scrambled frames caused by catheter motion, saw-tooth shaped appearance of the vessel wall when longitudinally reconstructed, etc. The method has been and is applied successfully in several studies.9 While there is little difference in mean values, contour detection is easier in the longitudinal view, and standard deviation of the measurements is improved, there is no data that these improvements influence the final outcomes of large-scale studies; and most large-scale studies have not used this approach.
Safety of the IVUS procedure
Hausman et al12 reported 2,207 patients from 28 centres (including 915 patients studied for diagnostic purposes).12 There were no complications in 2,034 patients (92.2%). In 87 patients (3.9%), complications were judged to be unrelated to IVUS imaging. In 63 patients (2.9%) transient spasm occurred during imaging. In nine patients (0.4%) complications were judged to have a “certain” relationship to IVUS (five acute occlusions, two dissections, one embolism, and one dissection). In 14 patients (0.6%) complications were judged to have an “uncertain” relationship to IVUS (including acute procedural events in nine, five acute occlusions, three dissections, and one arrhythmia). Major events (acute myocardial infarction or emergency bypass surgery) occurred in three of nine and five of 14 of these patients, respectively. The complication rate was higher in patients with unstable angina or acute myocardial infarction and in patients undergoing intervention (as apposed to just diagnostic imaging).
Batkoff et al13 reported 718 IVUS “examinations” performed at 12 centres. There were eight events (1.1%), but no adverse clinical consequences; all occurred in patients with unstable angina undergoing percutaneous intervention. There were four cases of transient vessel spasm, two cases of dissection, and two cases of wire entrapment. Gorge reported 7085 IVUS studies from 51 centers.14 Spasm occurred in 3% of all studies. Major complications (dissection, thrombosis, ventricular fibrillation, and refractory spasm) occurred in 10 (0.14%). There was only one major event.
The long-term safety of IVUS has been reported by Ramassubu et al15 who studied transplant recipients imaged one or more times with IVUS and followed by coronary angiography at least one year after the last IVUS exam. Overall, 548 coronary arteries in 226 patients were imaged by IVUS and compared to 130 arteries that were not imaged by IVUS. Subsequent angiographic stenoses were observed in 19.5% (107/548) of imaged arteries vs. 16.2% (21/130) of non-imaged arteries (p=0.4). The arterial diameters of non-imaged and imaged arteries were not significantly different (p=0.07) regardless of the number of IVUS exams and duration of follow-up. In a subgroup analysis of 31 patients, angiographic lumen diameters were measured at baseline (within eight weeks of transplantation) and at follow-up (after 2, 3, or 4 IVUS exams). There was a significant decrease in vessel lumen diameter over time in non-imaged as well as imaged arteries with no difference in the magnitude of the diameter decrease between the two groups
Guedes et al16 used quantitative coronary angiographic analysis to compare IVUS-imaged and non-IVUS-imaged arteries in 525 patients at baseline and at 18 to 24 months. The coronary change score (per-patient mean of minimum lumen diameter changes for all lesions measured) was –0.06±0.23 mm versus –0.05±0.21 mm for IVUS-imaged and non-IVUS-imaged arteries, respectively (p=0.35). The increase in percent diameter stenosis from baseline to follow-up was 0.8±6.7% and 1.2±7.0% in the IVUS-imaged and non-IVUS-imaged arteries (p=0.29). New lesions occurred in 3.6% and 3.9% of IVUS-imaged and non-IVUS-imaged arteries, respectively (p=0.84). When all coronary lesions were considered, the incidence of lesion progression was not significantly different between IVUS-imaged (11.6%) and non-IVUS-imaged (9.8%) arteries. Coronary spasm occurred in 1.9% of IVUS procedures, and there was one case of acute occlusion with no long-term sequelae.
Thus, IVUS has been performed safely in a large number of subjects enrolled in research studies with no apparent increase in incidence of adverse effects. There is no evidence from studies that have employed serial imaging within the coronary arteries that this approach has any influence in terms of accelerating disease progression.
Storage and transfer of images
Storage of the full dataset is important, and back-up digital storage is advisable to ensure longevity of the information. Analogue videotape - the medium of the past - was standardised, but is likely to be unavailable for use with more modern imaging systems. Accordingly, every effort has been made to store data in a digital manner. The lack of full standardisation of both CD-ROM and DICOM provide challenges for digital storage of images. CDs, DVDs, etc are part of the study data and must be stored as long as other study data and according to International Conference on Harmonisation (ICH) / WHO Good Clinical Practice standards.
Unfortunately, audio recording has become problematic with the advent of the CD-ROM. While DICOM allows for audio overlay that is already implemented in some of today’s consoles, the IVUS community has been advised not to enable this feature because a DICOM file that includes audio overlay cannot be “read” by all equipment and software analysis packages – especially, equipment and software used clinically. However, core laboratory view stations should be able to read audio overlay. Audio archiving is currently supported in the Boston Scientific DICOM – Basic Voice Audio Waveform Storage.
It is also possible to install a DICOM reader on the individual CD-ROM disks as done by angiographic companies. The IVUS manufacturers should be encouraged to implement this approach as long as the core laboratories are also able to override this feature as necessary.
The full pullback should be stored on the digital medium. It is up to the core lab, not the clinical sites to select the segment of interest. Improvements in electronic transfer of digital information will allow for immediate submission of imaging directly from the site to the core laboratory. This already occurs in research studies that have employed other imaging modalities. While the file size of data to be transferred is substantial, there are likely to be ongoing developments in terms of uploading, transfer, and storing of digital data which will result in a more efficient transmission of images to the core laboratory.
Image analysis
Paired analysis is highly recommended, preferably during the same session by the same analyst who is blinded to treatment assignment and where baseline vs. follow-up imaging have been de-identified. If the follow-up recording is not analysable, it is recommendable that the baseline recording still be analysed so that the patients are included in baseline population and demographics.
Common language and definitions
We recommend the nomenclature proposed by the American College of Cardiology Clinical Expert Consensus Document on Standards for Acquisition, Measurement and Reporting of Intravascular Ultrasound Studies (IVUS).17 A report of the American College of Cardiology Task Force on Clinical Expert Consensus Documents: (1) external elastic membrane (EEM), (2) lumen, (3) atheroma (or plaque & media) calculated as EEM minus lumen, and (4) % atheroma area (or plaque area) or atheroma burden (or plaque burden calculated as plaque & media divided by EEM). Atheroma (or plaque & media) thickness is also reported variably in some regression/progression studies.
Core lab personnel qualifications
The core lab manager is responsible for training new employees and assessing his/her qualifications and competencies for core lab functions. After some tutorial sessions on the use of analysis software and understanding the anatomy and basic principles of the atherosclerosis disease process, new personnel can begin to analyse IVUS studies under supervision of a senior analyst until the new analyst is considered to be able to perform independently.
Each core lab should maintain a library of IVUS recordings that can be used to assess the performance of qualified personnel including reproducibility and inter and intraobserver variability. These known IVUS recordings should be given to the new analyst. The total, mean, and standard deviations of the vessel and lumen areas should be used for comparison. In addition, frame-level measurements that are >2 times the standard deviation for the entire reference group should be discussed.
Core lab personnel performance and continuing education
To maintain the qualification of personnel, it is necessary to have systematic ongoing training. It is advisable that each core lab analyst measure known IVUS recordings twice each year. The region of interest should be the same for all analysts. Similarly, the total mean and standard deviations of the vessel and lumen areas should be used for comparison between qualified analysts. In some labs, the results of such quality control processes are provided for sponsors during the course of the study. Finally, it is recommended that there be monthly conferences in which interesting and difficult cases are discussed.
Detection of disease borders
Cross-sectional measurements are fundamental to quantitative IVUS analysis. There are many computed-assisted methods that help with cross-sectional contour detection of the lumen and EEM. Software should be carefully assessed by each core laboratory before implementation. Given that each image needs to be reviewed by an analyst to confirm that the correct leading edges have been detected, it remains to be determined whether current automatic software packages provide any benefit compared with manual planimetry by a trained analyst.
Longitudinal image reconstruction and analysis can be incorporated into both semiautomatic, and user-defined contour detection can be used interactively with cross-sectional contour detection; however, every cross-section should still be checked. Antegrade-retrograde, side-to-side, and systolic-diastolic catheter motion (greater in the RCA and LCX than in the LAD) causes a saw-tooth appearance to the longitudinal images. Longitudinal contours can be drawn at the peak, middle, or valley of the “saw-tooth” and are analyst dependent; therefore, a standardised protocol is necessary. It is suggested that longitudinal contour detection be performed after gating in order to get a smooth appearance of the boundaries.
Selection of anatomical landmarks and segment for analysis
The same proximal and distal fiduciary points must be used to identify the analysis segment on baseline and follow-up studies such as clearly identifiable proximal and distal side branches at baseline and follow-up using the proximal part of the distal side branch and the distal part of the proximal side branch. The priority for the fiduciary point when imaging the RCA should be the aorto-ostial junction, then the conus branch or a proximal atrial branch, and finally a distal side branch. For the left coronary system, the carina of the LAD/LCX is the most recommended fiduciary point. However, every attempt should be made to continue to image while withdrawing the catheter into the aorta to permit imaging within the left main arterial segment. The analysis segment should be chosen using the two fiduciary points that have the most similar lengths between the baseline and follow-up studies.
Analysis segment selection
Atherosclerosis is a diffuse disease. It is recommended to analyse very long proximal segments compared to shorter distal segments because atherosclerosis is more proximally distributed and events occur in more proximal segments. Bifurcation segments are interesting for analysis. However, analysing bifurcations produces its own challenges. Since side branch containing cross-sections do not display the artery as a “circle,” some rules are necessary for defining the contours of the EEM and lumen. (1) The EEM contour should be interpolated to follow the main vessel cross-sections just proximal and distal to the side branch. (2) The lumen contour should be drawn on top of the EEM contour at the mouth of the side branch. (3) Rules for excluding the side branch-containing cross-sections should follow the rules for excluding cross-sections containing calcium (see below).
Imaging artefacts
NURD is unique to mechanical catheter systems and results from mechanical binding of the drive cable that rotates the transducer18. Any cross-sections with a recognisable NURD that precludes accurate definition of the leading edge of the outer vessel wall border should be eliminated following the same rules as for calcium. The core laboratory must be also sensitive to any other artefacts such as side lobes which are unique non-mechanical catheters. In the training set of IVUS pullbacks, these artefacts should be included. Presence of EEM out of view, loss of image due to bubbles, or any other artefact that prevents complete analysis of a single frame should be treated as calcium.
Calcium
Calcium is a strong reflector of ultrasound, shadows deeper arterial structures including the EEM contour, and hampers visualisation and analysis of the vessel wall. At the present time we do not know the relationship between IVUS calcium detection and IVUS detectable progression and regression. The amount of calcium in an artery is influenced by the presence of a stenosis, the amount of plaque burden, and vessel size. On one hand, excluding calcified segments can make studies less applicable to a general patient population; on the other hand, excluding calcified segments can provide results with more specific information. However, from a practical standpoint, patients studied in progression/regression studies do not have severe stenoses and calcification; therefore, (from experience) while only approximately 2% of patients are voided because of calcium, this tends to be one of the leading reasons for exclusion of patients from studies.
Therefore, we do not know whether calcium segments should or should not be included in the analysis. However, from a practical standpoint and in order to calculate changes in the plaque volume we are forced to deal with this confounding factor. The issues are as follows. (1) How much calcium precludes accurate assessment of EEM contours? (2) Which technique should be used to extrapolate contours behind calcium in either cross-sectional or longitudinal views? (3) When should individual cross-sections be excluded, and when should entire patients be excluded because of the extension of the calcium?
Using the longitudinal approach, extrapolation is allowed if there is EEM shadowing <45° (cross-sectional analysis) or if there is EEM shadowing of 45-90°, but <5 mm in length. Using cross-sectional analysis, a single deposit with an arc of calcium >45° or multiple small arcs that add up to >180° voids an individual cross-section, but the length of calcium is not a consideration. When eliminating cross-sections, the same cross-sections should be eliminated at baseline and at follow-up. If after eliminating cross-sections, the “residual” length is less then 10 mm, the entire case should be eliminated. It is advisable to document the number of frames and % of length eliminated due to the presence of calcium.
Statistical approaches
Selection of progression/regression endpoints
A number of endpoints are possible: (1) nominal change in percent atheroma volume from baseline to follow-up, (2) nominal change in total (absolute) atheroma volume from baseline to follow-up, and (3) percent change in total (absolute) atheroma volume from baseline to follow-up (Figure 1). These endpoints can be reported for the total analysis segment and/or for the most-diseased segment. It is recommended to report all three endpoints so that the totality of the data can be used to understand the results, but there is a preference to use the absolute change in Percent Atheroma Volume (from baseline to follow-up) as the primary endpoint, largely due to the smaller variability of this endpoint for analysis. Conversely, even though the most-diseased 10 mm subsegments contain the largest mean plaque burden, we do not recommend this as a primary endpoint because (1) the most-diseased subsegment lacks independent proximal and distal fiduciary points, (2) the minimum lumen area, the maximum plaque burden, and the most-diseased segment can shift during follow-up, (3) the length of the worst segment at follow-up can vary considerably due to the heterogeneity of the pullback speed, and (4) the variability of measurements increases when the segment length is short. However, if analysed, the most-diseased subsegment should contain at least one fiduciary point that is independent of lumen dimensions or plaque burden.
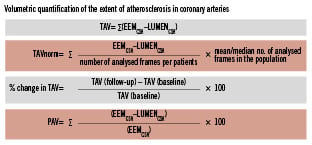
Figure 1. Parameters commonly used to report the extent of the coronary atherosclerosis are total atheroma volume (TAV) and percent atheroma volume (PAV). EEM: external elastic membrane; CSA: cross-sectional area
Selection of remodelling endpoints
Remodelling is conventionally assessed by comparing lesion site EEM to reference segment EEM. However, for serial studies involving volumetric characterisation within an arterial segment, such a static definition is not recommended. Instead, remodelling should be assessed as EEM at follow-up minus EEM at baseline where an increase in EEM is positive remodelling, no change in EEM is absence of remodelling, and a decrease in EEM is negative remodelling. Furthermore, vessel segments with positive remodelling should be subdivided as expansive (over compensatory) where ∆EEM/∆atheroma >1 or incomplete where ∆EEM/∆atheroma is between 0 and 1.0.
Normalisation for length
Normalisation for segment length is very important for assessing total atheroma volume, but is less important for assessing percent atheroma volume (plaque burden). A common way of normalisation is to multiply the mean atheroma area by the median or mean length for all patients completing the trial. This adjusts for differing segment lengths across patients, thereby providing equal weighting of each patient in the calculation of atheroma volume.
Emerging developments
With improved pharmacology it is anticipated that quantitative changes in atheroma burden will become less and less. Therefore, it is also anticipated that qualitative changes in plaque morphology or lesion phenotype will become more important. Examples of technologies that have been developed to assess plaque composition include virtual histology (VH)-IVUS, iMAP-IVUS and integrated backscatter (IB)-IVUS. VH-IVUS in combination with grey-scale IVUS data will be more frequently used in future trials.19 As VH-IVUS data are derived from a process that involves manual interaction for detection of the luminal and external vascular boundaries, measurement variability is an important issue. There are some publications that have addressed this issue.20-22
Finally, it is possible that in the future IVUS will be integrated with other modalities such as optical coherence tomography or spectroscopy that could also provide qualitative data.
Acknowledgements
The authors express gratitude to GlaxoSmithKlein, Astra Zeneca, Boston Scientific, Merck, Illy Lilly and Volcano for sponsoring the face to face meetings to discuss the content of this document.
The authors also would like to recognise the efforts Gerrit-Anne van Es and Marie-Angele Morel (Cardialysis) for providing assistance.