Abstract
Aims: First, to establish the diagnostic performance of the pressure gradient at a standardised mean velocity (dPv) as derived from the cycle-averaged stenosis pressure gradient-velocity (dP-v) relationship obtained by administration of adenosine and, second, to determine whether dPv can be assessed from contrast medium-induced submaximal hyperaemia.
Methods and results: Distal coronary pressure and velocity were simultaneously recorded in 64 patients during the response to intracoronary injection of adenosine. dPv was assessed at velocities between 20 and 50 cm/s. The pressure gradient at a mean flow velocity of 30 cm/s (dPv30) yielded an excellent diagnostic performance against FFR ≤0.8 (area under the curve 0.96; sensitivity 84%; specificity 96%; accuracy 89%). In a subgroup of 21 patients, measurements were repeated throughout contrast medium-induced reactive hyperaemia. Peak velocity and pressure gradient were lower compared to adenosine, but the course of the corresponding dP-v relationships coincided very well over the common velocity range, with no difference in dPv30.
Conclusions: dPv30 reliably detects functionally significant coronary lesions. It derives from stenosis haemodynamics and can be obtained with submaximal hyperaemia, such as following injection of contrast medium, thereby obviating the maximal vasodilation by adenosine required for FFR or other established hyperaemic parameters of functional stenosis severity.
Introduction
Currently adopted quantitative parameters of functional stenosis severity assessed by sensor-equipped guidewires during percutaneous coronary intervention (PCI) include fractional flow reserve (FFR), coronary flow velocity reserve (CFVR) and hyperaemic stenosis resistance (HSR)1. These indices require maximal vasodilation of coronary resistance vessels2-4, most frequently obtained by injecting adenosine5. However, the dose of intracoronary adenosine required to achieve maximal vasodilation is currently a matter of debate3,6. Moreover, the need for maximal hyperaemia is considered a key impediment against the regular use of FFR in daily clinical practice7. Therefore, an approach not constrained by the need for maximal vasodilation may facilitate a more universal adoption of physiologically guided PCI.
The haemodynamic severity of a coronary artery stenosis is uniquely characterised by its pressure gradient-flow velocity (dP-v) relationship8-10. The pressure gradient at a standardised flow velocity (dPv) derived from the mid-diastolic dP-v relationship has previously been introduced as a functional stenosis index independent of maximal vasodilation11,12, but its use is limited by the computational effort necessary to construct the dP-v relationship from consecutive diastolic periods during the hyperaemic response. We hypothesised that the cycle-averaged dPv can similarly be used to assess the ischaemic potential of a coronary artery stenosis, thereby greatly simplifying the analysis since it is much easier to compute.
Determination of the dP-v relationship requires some flow velocity increment above baseline, but not necessarily maximal hyperaemia. Our second hypothesis was therefore that pressure gradient and velocity during submaximal hyperaemia induced by coronary administration of a radiographic contrast agent13-15 follow the same course as when they are obtained by adenosine administration, allowing the derivation of cycle-averaged dPv.
Methods
The study population consisted of 64 patients with stable angina pectoris scheduled for elective PCI. We included patients with a single discrete stenosis in the target vessel. Exclusion criteria were diffuse or three-vessel disease, left main coronary artery stenosis (>50% diameter reduction), recent myocardial infarction (<6 weeks prior to screening), cardiac arrhythmia, hypertrophic cardiomyopathy, severe aortic valve disease, advanced heart failure or prior cardiac surgery. Anti-anginal medication was continued as clinically indicated. The protocol was approved by the institutional medical ethics committee and all patients gave written informed consent.
CATHETERISATION PROTOCOL AND INTRACORONARY MEASUREMENTS
Cardiac catheterisation was performed using a percutaneous femoral or radial artery approach. Heparin (5000-7500 IU) was administered at the beginning of the procedure followed by an intracoronary bolus of nitroglycerine (0.1 mg). Coronary angiography was performed according to standard procedures. Aortic pressure (Pa) was measured via a 5 or 6 Fr guiding catheter. Intracoronary distal pressure (Pd) and blood flow velocity were measured simultaneously using a 0.014 inch dual-sensor guidewire (ComboWire XT®; Volcano Corp., San Diego, CA, USA). The pressure at the wire tip was normalised to the proximal pressure prior to advancing the guidewire, and care was taken to obtain an optimal and stable velocity signal. Haemodynamic signals were obtained distal to the lesion and digitally stored at a sampling rate of 200 Hz for offline analysis. All haemodynamic signals and the ECG were recorded from baseline until the end of the hyperaemic response to an intracoronary bolus of adenosine, 30 µg for the right coronary artery and 40 µg for the left coronary artery1. In 21 of these patients, measurements were repeated throughout reactive hyperaemia induced by a standard 3 ml intracoronary bolus of the low osmolar ionic contrast agent ioxaglate (Hexabrix® 320; Guerbet, Gorinchem, The Netherlands). To assess a possible dose dependency, the response to a 6 ml bolus injection of contrast medium was recorded in the first eight patients.
DATA ANALYSIS
Coronary angiograms were quantitatively analysed (QAngio XA 7.2; Medis medical imaging systems bv, Leiden, The Netherlands) to determine percent diameter reduction. Haemodynamic data were processed using custom software (written in Delphi v. 2010; Embarcadero, San Francisco, CA, USA). Cycle averages of heart rate, Pa, Pd, pressure gradient (=Pa–Pd) and flow velocity were determined for at least seven consecutive cycles at baseline and three consecutive cycles during peak hyperaemia. FFR (=Pd/Pa, at peak hyperaemia) and HSR (=pressure gradient/velocity, at peak hyperaemia) were calculated.
Starting from baseline until the end of each response to a hyperaemic agent, successive beat-averaged values of stenosis pressure gradient were plotted against the corresponding mean flow velocity, excluding the injection period when no aortic pressure could be measured. The resulting dP-v relationship was fitted by the quadratic equation dP=Av+Bv2+C, where dP is the stenosis pressure gradient and v is flow velocity. The first term in this equation represents pressure loss due to viscous friction and the second one pressure loss incurred by velocity acceleration along the throat and flow separation at the exit of the stenosis10. The coefficients A and B incorporate the stenosis-specific geometry and rheological properties of blood8-10. Since pressure gradient has to be zero at zero flow, a non-zero coefficient C was used to correct for a possible pressure drift at the time that the dP-v relationships were obtained. The coefficients A, B and C were determined from a least squares curve-fitting algorithm (Grapher v. 8.7; Golden Software Inc., Golden, CO, USA).
For each dP-v relationship, the pressure gradient at a mean flow velocity of 20, 25, 30, 35, 40 and 50 cm/s was calculated from the fit equation after offset correction. These pressure gradients are denoted as dPv, with a numerical subscript indicating the velocity, e.g., dPv30 represents the pressure gradient at a mean flow velocity of 30 cm/s.
STATISTICAL ANALYSIS
Continuous variables are expressed as mean±SD. In order to identify the most appropriate velocity at which to determine dPv for stenosis evaluation, the lowest number of false-positive and false-negative outcomes was determined for the adenosine responses based on 2×2 tables against the recommended cut-off values1 FFR <0.75, FFR ≤0.8 and HSR >0.8 mmHg·cm–1·s. For the chosen dPv index, receiver-operating characteristic curves were used to evaluate the area under the curve (AUC) against adenosine-based FFR and HSR at the above-mentioned ischaemic thresholds. The best cut-off value for the chosen dPv was defined by the highest sum of sensitivity and specificity with respect to FFR ≤0.8. This value was then used to determine agreement with FFR ≤0.8, FFR <0.75 and with HSR.
Haemodynamic variables as well as the viscous and exit loss coefficients A and B were compared between adenosine and contrast medium responses and between 3 and 6 ml bolus injections of contrast medium using a paired Student’s t-test (IBM SPSS v. 19.0; IBM Corp., Armonk, NY, USA). Differences between the dP-v relationships obtained by adenosine and contrast medium administration and between 3 and 6 ml doses of contrast medium were further assessed by comparing dPv indices at each of the six velocities using ANOVA for repeated measures. Bland-Altman analysis was used to compare the adenosine-derived dPv index to that obtained from contrast medium-induced reactive hyperaemia. A two-tailed p-value <0.05 was considered statistically significant.
Results
The study population consisted of 48 males and 16 females with a mean age of 59±9 years. Baseline patient demographics are presented in Table 1. Quantitative coronary angiography yielded a diameter reduction of 54±17% for all lesions and 46±18% for those lesions in which the reactive hyperaemia to contrast medium was recorded (Table 2).
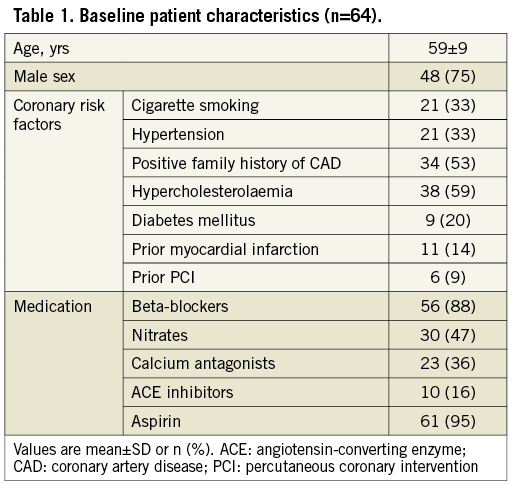
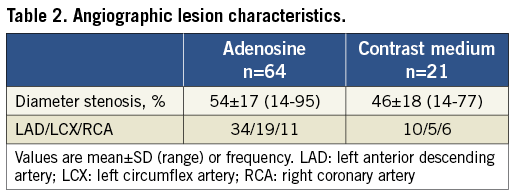
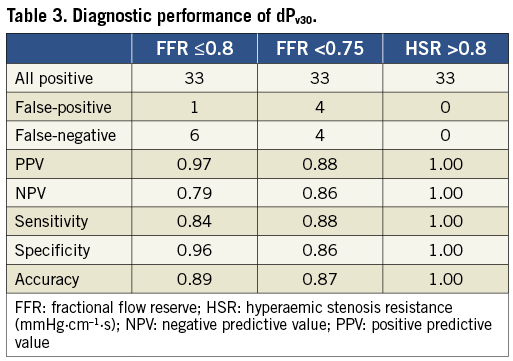
Figure 1 shows an example of the haemodynamic signals recorded in a left anterior descending artery with a 60% diameter stenosis. In this case, the reactive hyperaemia following a 3 ml bolus of contrast medium was similar to the hyperaemia induced by adenosine, in part due to a higher aortic pressure at the time of peak flow with contrast.
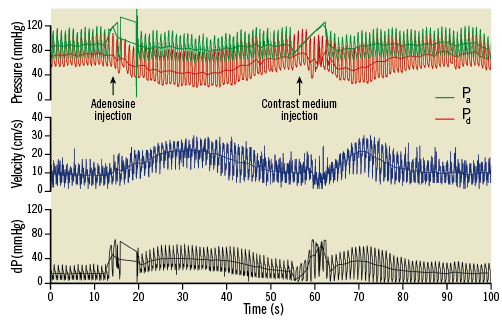
Figure 1. Example of haemodynamic recordings for intracoronary adenosine and contrast medium injection obtained for a 60% diameter stenosis in a left anterior descending artery. Contrast medium-induced hyperaemia is potent but more short-lived. dP: pressure gradient; Pa: aortic pressure; Pd: distal pressure. Note that aortic pressure at peak response with contrast is higher than with adenosine resulting in similar peak velocities.
ADENOSINE-DERIVED DIAGNOSTIC PERFORMANCE OF DPV30
Baseline flow velocity and pressure gradient were 15.6±6.9 cm/s and 17.3±17.5 mmHg, respectively. During adenosine-induced hyperaemia, flow velocity increased to 31.0±16.6 cm/s and pressure gradient to 30.3±18.7 mmHg. The resulting FFR was 0.68±0.18 and HSR was 1.59±1.87 mmHg·cm–1·s.
Three cases in which the dP-v relationship could not be fitted due to very little change in flow velocity after adenosine injection were excluded from further analysis. Average values for dPv ranged from 38±60 mmHg at 20 cm/s to 73±120 mmHg at 30 cm/s and 176±303 mmHg at 50 cm/s. The sum of discordant outcomes at each of the six selected velocities failed to reveal a clear statistical difference. Overall, discordant outcomes were more frequent against FFR (at 0.75 and 0.8) than against HSR. At velocities between 20 and 40 cm/s, all cases were correctly identified against HSR. A single discordant case for HSR was found at dPv50, in contrast to eight for FFR <0.75 and six for FFR ≤0.8. For FFR <0.75, the sum of inaccurate outcomes was seven at 20 cm/s and eight at the remaining velocities, versus six inaccurate outcomes at 20 cm/s and seven at the remaining velocities for FFR ≤0.8. The resulting accuracy differed by less than 2% between the assessed velocities. Since these results failed to favour strongly a velocity at which to determine dPv, additional physiological considerations were taken into account. In order to limit extrapolation of the dP-v relationship beyond measured values, the standardised velocity at which to assess dPv should ideally be within the range of commonly encountered baseline and hyperaemic values. Especially for severe lesions, choosing a high value may result in rather unphysiological estimates for dPv. Baseline flow velocity was below 20 cm/s in 77% of the cases and below 30 cm/s in 98% of the cases. For intermediate lesions with FFR between 0.7 and 0.85, the average hyperaemic velocity had a median of 34.7 cm/s, with 25% above 40 cm/s. Hence, we selected dPv30 as the index for further diagnostic evaluation.
The excellent discriminative power of dPv30 is illustrated in Figure 2. Analysis of the receiver operating characteristic curves yielded an AUC of 0.96 (0.91-1.00) against FFR ≤0.8, 0.94 (0.89-0.99) against FFR <0.75 and 1.00 (1.00-1.00) against HSR. With FFR ≤0.8 as the reference standard, the best cut-off value for dPv30 was 21.2 mmHg, yielding a sensitivity, specificity and accuracy of 84%, 96% and 89%, respectively (Table 3). The diagnostic performance of dPv30 was only somewhat lower against FFR <0.75 and best against HSR.
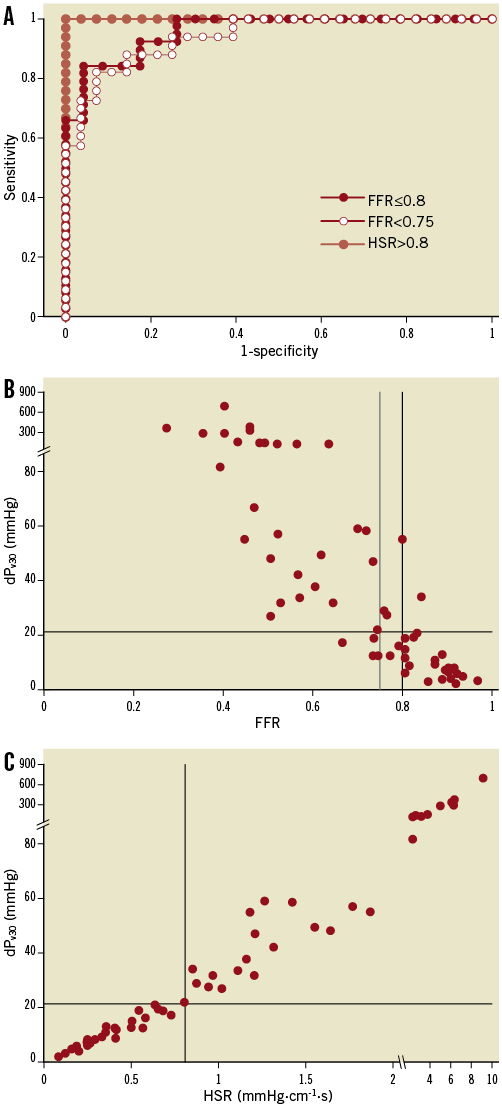
Figure 2. Receiver-operating characteristic curves (A) for adenosine-derived dPv30 against fractional flow reserve (FFR) and hyperaemic stenosis resistance (HSR). The area under the curve was 0.94 for FFR <0.75, 0.96 for FFR ≤0.8 and 1.00 for HSR. Discordance was equally low for FFR at both cut-off values (B) and absent for HSR (C). dPv30, pressure gradient at a mean flow velocity of 30 cm/s.
ADENOSINE VERSUS CONTRAST MEDIUM-DERIVED dP-v RELATIONSHIP AND dPV30
Baseline haemodynamic values as well as heart rate were not different prior to adenosine and contrast-induced hyperaemia (p>0.10). As expected, the hyperaemic response after contrast injection was submaximal (Figure 3), with peak velocity 16±16% (p<0.01) and pressure gradient 17±19% (p<0.0001) lower compared to those obtained with adenosine. Doubling the volume of injected contrast medium had no effect on these haemodynamic variables (p>0.05).
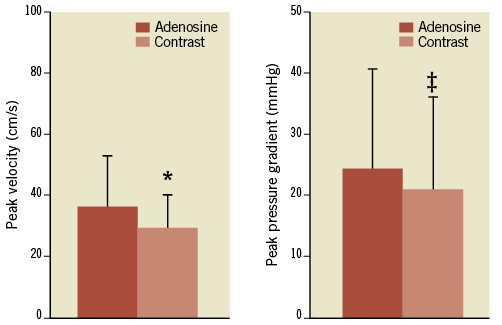
Figure 3. Contrast injection yielded submaximal hyperaemia with lower peak velocity and pressure gradient compared with adenosine. *p<0.01; ‡p<0.001 compared with adenosine.
Figure 4 illustrates the good agreement between adenosine and contrast medium-derived dP-v relationships obtained for a 40% diameter stenosis over the common velocity range, although contrast-induced hyperaemia was submaximal. One patient was excluded from further analysis since the contrast medium-induced dP-v relationship could not be fitted due to the small increase in flow velocity by only 2 cm/s above baseline. The pressure loss coefficients A and B did not differ between the adenosine- and contrast-derived dP-v relationships (p>0.60) or between the dP-v relationships obtained with different doses of contrast medium (p>0.30). The mean difference between adenosine- and contrast-derived values of dPv at all six assessed flow velocities was 0.6±6.3 mmHg (p>0.56). In the eight patients where the effect of doubling the volume of injected contrast medium was studied, dPv was not altered at any of the assessed velocities (p>0.50).
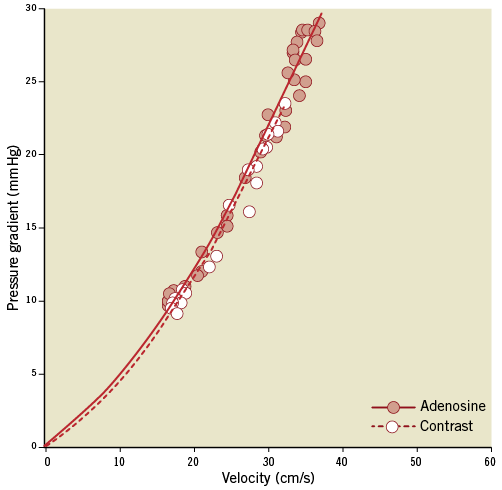
Figure 4. Cycle-averaged values of velocity and pressure gradient demonstrate consistent haemodynamic stenosis characteristics obtained with adenosine or contrast medium-induced vasodilation. The lines represent least squares quadratic curve fits of the form y=Ax+Bx2 after drift correction.
Bland-Altman analysis (Figure 5) revealed a mean overestimation of 0.35±4.19 mmHg for dPv30 assessed with adenosine vs. contrast medium, with no bias at higher values (r=0.28, p>0.55). This mean overestimation was reduced to 0.07±3.83 mmHg when the analysis was restricted to only clinically relevant cases of intermediate stenosis severity with HSR <1.5 mmHg·cm-1·s (n=15). Contrast medium-derived dPv30 resulted in a different diagnostic outcome for only one borderline case that switched from true-positive to false-negative due to a 0.8 mmHg decrease in dPv30 compared with the adenosine-derived value.
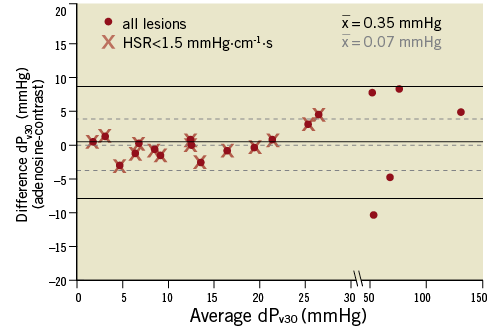
Figure 5. Bland-Altman plot illustrating the good agreement between adenosine and contrast medium-derived pressure gradient at a mean flow velocity of 30 cm/s (dPv30). Mean difference, upper and lower 95% limit of agreement for all lesions are indicated by the solid lines, and for clinically relevant lesions (HSR <1.5 mmHg·cm–1·s) by the dashed lines.
Discussion
We assessed the physiological severity of coronary artery stenoses based on the lesion-specific per-beat dP-v relationship obtained during the response to a vasodilating agent. Our main findings can be summarised as: 1) dPv30, the pressure gradient at a mean flow velocity of 30 cm/s, yielded an excellent diagnostic performance with an AUC of 0.96 at FFR ≤0.8; 2) this approach does not depend on achieving maximal vasodilation; and 3) a submaximal hyperaemic stimulus induced by a bolus injection of radiographic contrast material did not alter the course of the dP-v relationship and may hence be used as a convenient means to assess dPv30 without the need for administering adenosine.
STENOSIS dP-v RELATIONSHIP AND dPV30 TO ASSESS PHYSIOLOGICAL LESION SEVERITY
Several issues relevant to the discussion are schematically illustrated in Figure 6, displaying the dP-v relations for two stenoses of different severity and their respective dPv30. The dP-v relationship is a comprehensive representation of stenosis-specific haemodynamics over the interrogated velocity range and its course does not depend on achieving maximal vasodilation, provided stenosis geometry does not change10. The underlying fluid dynamics of a stenosis are described by a quadratic equation9 and the coefficients obtained from the curve fit allow the calculation of dPv30. Marques and co-workers12 constructed the instantaneous mid-diastolic dP-v relationship from consecutive cycles during adenosine-induced hyperaemia and introduced the stenosis pressure gradient at a mid-diastolic flow velocity of 50 cm/s for functional stenosis assessment. Our cycle-averaged approach to derive the dP-v relationship has several key advantages. First, it avoids the need for identifying mid-diastolic portion per cycle and correcting for the instrument-dependent time delay between the paired instantaneous aortic and distal coronary pressures and between the distal pressure and velocity. Second, whole cycle averages make accounting for the effect of variations in pulsatile pressure and velocity waveforms on stenosis haemodynamics16 less important. Third, the determinants of mean coronary blood flow are related to the entire cardiac cycle, not only to systole or diastole17,18. Instantaneous flow in these periods is linked to emptying and filling of the intramural coronary compliance, which is not the result of varying (micro-) vascular resistances but is caused by an active intramyocardial pump19. These compliance effects cancel out in the concept of beat-averaged coronary blood flow or resistance.
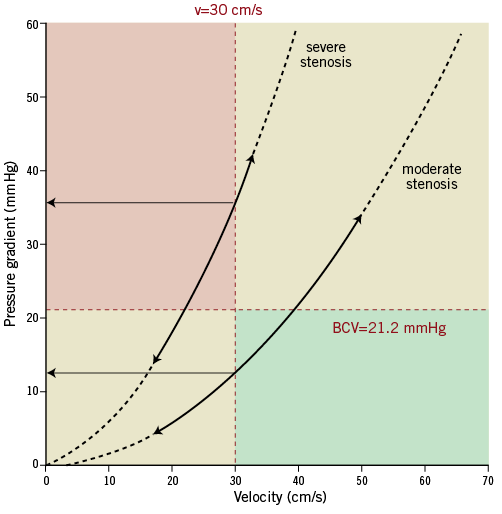
Figure 6. Diagram illustrating the diagnostic range of dPv30. The dP-v relationships of a theoretical severe and moderate stenosis are shown (solid lines between arrows), with extension to potential lower or higher velocities (dashed lines). The upper left quadrant represents the area of functionally significant lesions, whereas the lower right designates the haemodynamic insignificant quadrant. BCV: best cut-off value; v: velocity
CONTRAST MEDIUM-INDUCED SUBMAXIMAL HYPERAEMIA
Our present findings concur with prior studies showing that contrast medium induces only submaximal hyperaemia compared to adenosine or papaverine, thereby overestimating FFR5,14,15,20. The reactive hyperaemic response after an intracoronary injection of contrast medium is characterised by three phases13. In the first few seconds after injection, coronary blood flow falls, followed by a rapid increase and a gradual return to baseline21. This nadir is considered to be caused by the higher viscosity of contrast medium and its rheological effects on red blood cells, temporarily increasing microvascular resistance22. The resulting reactive hyperaemia is probably enhanced by the hyperosmolality of contrast medium and the brief reduction in arterial oxygen supply during microvascular passage of the hypoxaemic contrast agent13,15,23.
Although the viscosity of contrast medium is about twice that of blood, it only affects the pressure gradient the moment it passes the stenosis, whereas the dP-v relationship is assessed during the period following the nadir, when the stenosis area is cleared from contrast medium and hence only blood flows through the stenosis. The similarity of pressure gradients evaluated at several mean flow velocities along corresponding adenosine and contrast-derived curves supports the conclusion that contrast medium was cleared from the epicardial measurement site during the hyperaemic response. These observations suggest that a functional stenosis index not requiring maximal vasodilation, such as dPv30, can be reliably derived from the dP-v relationship obtained by a contrast medium-induced increase in blood flow.
Dose-response assessment was discontinued after the investigated parameters revealed similar results in the first eight patients, without an effect on peak reactive hyperaemia or the respective dP-v relationship. The dose dependency reported previously for contrast boluses between 2 and 6 ml is most likely attributable to differences in injection rates or type of radiographic agent used (ionic vs. non-ionic, low- and high-osmolar)15,22,23. It is important to recall that the actual peak flow achieved during reactive hyperaemia is not relevant for deriving dPv30.
ADENOSINE-FREE INDICES ASSESSED UNDER BASELINE CONDITIONS
Recent reports on the drug-free evaluation of stenosis severity at resting flow include the instantaneous wave-free ratio (iFR)24, which is based on the distal-to-proximal pressure ratio during a specific mid-diastolic period, and the baseline stenosis resistance (BSR)25, which is derived from combined distal pressure and velocity information. While the reported diagnostic potential of these indices is promising, they may be more prone to measurement uncertainties, since both flow velocity and pressure gradient are smaller at resting flow, and phase delays need to be taken into account for iFR. In particular, with iFR one has to bear in mind that diastolic coronary pressure-flow relations have a non-zero intercept with the pressure axis, which is not compatible with a concept of diastolic resistance defined as the ratio between coronary pressure and flow26-28. The coronary pressure-flow relationship at rest is also governed by autoregulation and metabolic adaptation, whereby microvascular resistance is adjusted to the prevailing perfusion pressure and oxygen demand17,29,30. More studies are needed to evaluate the relative merit of baseline parameters compared with those assessed at elevated flow.
CLINICAL IMPLICATIONS
Currently, the optimal dose of adenosine required to induce maximal vasodilation is still a matter of debate, especially for intracoronary administration3. Once different adenosine concentrations are agreed upon as optimal dose for, e.g., FFR, new validation studies should be performed for establishing the predictive power of the modified test. A functional index that is based on integral stenosis haemodynamics and can be derived from submaximal vasodilation is not hampered by uncertainty about maximising hyperaemia. Both the mean dPv30 proposed in this study and the instantaneous mid-diastolic dPv50 described previously12 share this advantage. Since the cycle-averaged dP-v relationship is easier to obtain, mean dPv30 is likely to be the more feasible index. Moreover, systolic flow also contributes to nutritious flow and can even exceed diastolic flow for severe lesions. Most currently used haemodynamic stenosis indices and myocardial perfusion imaging outcomes are based on means per beat as well.
We demonstrated that dPv30 can reliably be obtained with a submaximal vasodilatory stimulus such as the reactive hyperaemia induced by intracoronary injection of a radiographic contrast medium, which is routinely used during coronary angiography. Removing the need to administer adenosine has the potential to save costs and improve the workflow in the catheterisation laboratory, and it eliminates diagnostic concerns pertaining to the maximal vasodilation required for adenosine-based indices.
In fact, our findings imply that any lesion with a pressure gradient exceeding the dPv30 cut-off value of 21.2 mmHg at a flow velocity below 30 cm/s can be considered physiologically significant (upper left quadrant in Figure 6). If that threshold is already reached at resting flow, no further diagnostic action is necessary. Likewise, a lesion that presents with a mean pressure gradient below the cut-off at a velocity above 30 cm/s is functionally insignificant (lower right quadrant in Figure 6). In fact, only lesions that fall into the lower left or upper right quadrant at baseline would require determination of the dP-v relationship to derive dPv30.
METHODOLOGICAL CONSIDERATIONS
This is a hypothesis-generating study based on a relatively small cohort of 64 patients. A larger group of patients with intermediate stenosis severities is needed to achieve more reliable receiver operating characteristics. However, the present findings form a proof of principle, highlighting the key physiological fact that maximal hyperaemia is not necessary for stenosis assessment provided the analysis is based on the haemodynamic characteristics of a stenosis as reflected by its specific relationship between pressure gradient and velocity. This relationship can be obtained with less potent vasodilator agents to elevate flow. Initial results in one third of our patient cohort provide promising evidence that adequate flow elevation can be achieved by contrast medium-induced reactive hyperaemia. Further prospective studies are warranted to establish more firmly the predictive value for contrast-derived mean dPv30 under a variety of clinical conditions.
As advocated in recent revascularisation guidelines31, we used FFR ≤0.8 as the independent standard for inducible ischaemia. All traditional indices of functional stenosis severity are inherently flow-dependent, and the higher diagnostic and prognostic power of a parameter that combines pressure and velocity has been demonstrated by HSR, compared to pressure-only or flow-only parameters, especially in cases with discordant outcomes between FFR and CFVR2,25,32. The excellent correspondence between dPv30 and HSR outcomes most likely derives from the fact that either parameter incorporates both pressure and flow velocity information for a given stenosis.
The rate of the contrast medium administration was not controlled between patients, nor was the injected volume adjusted to the size of the perfusion territory subtended by the coronary artery of interest, factors which may affect peak flow velocity. However, the dPv30 concept is not critically dependent on the peak velocity reached. A 3 ml bolus of contrast medium induced a hyperaemic response that was substantial enough to derive dPv30 reliably. No significant differences were found between the respective contrast medium and adenosine-derived dPv values over the common range of flow velocities. Doubling the volume of contrast medium also did not alter the course of the dP-v relationship, nor any of the associated dPv values. However, dose response was assessed in only eight patients, and no pharmacological conclusions regarding contrast medium can be drawn from this study. The relevance of our finding is only related to stenosis evaluation by dPv30. For a small number (less than 5%) of lesions, the dP-v relationship could not be fitted due to too small a velocity change from baseline to hyperaemia in combination with a steep rise in pressure gradient. Importantly, this was only the case for severe lesions which would in any case be identified as significant, since their pressure gradient exceeded the cut-off at a flow velocity below 30 cm/s, sometimes even at baseline.
We have not specifically addressed the reproducibility of the dP-v relationships by repeat assessment with the same dilatory agent; however, neither the course of corresponding adenosine and contrast medium-derived dP-v relationships nor the respective pressure loss coefficients differed. These findings may, within limits, be regarded as substitute evidence for reproducibility, which is further supported by the excellent reproducibility reported previously for diastolic dP-v curves10,11.
The method for drift correction used in this study requires combined pressure and velocity data, but is capable of identifying procedural drift introduced in situ that may not be detectable after pullback. Moreover, using the offset derived from the dP-v curve fit circumvents the need for repeat pullback of the guidewire to re-normalise pressure during complicated study protocols. Offsets determined from corresponding dP-v curve fits differed by only 0.2±1.0 mmHg (p>0.30), which attests to the consistency of this approach.
Calculation of dPv30 and correction for pressure drift currently requires offline analysis; however, it could be easily implemented with appropriate modification to existing instrument software, where successive cycle-averaged values of pressure and velocity are already routinely calculated and stored to assess FFR, HSR and CFVR.
Conclusions
We introduced the novel mean dPv30 index, which is derived from the stenosis-specific dP-v relationship. As tested with adenosine as vasodilator, this index achieved an excellent diagnostic performance in identifying coronary lesions with an FFR ≤0.8. Our findings provide promising evidence for its potential as a diagnostic parameter that can be assessed from submaximal hyperaemia, e.g., by using contrast medium as a vasodilatory agent. This approach obviates the critical need for administering high doses of adenosine to attain maximal hyperaemia, thereby facilitating the physiological assessment of coronary stenosis severity in the catheterisation laboratory.
Funding
Netherlands Heart Foundation (grants 2000.090 and 2006B186) and the European Community’s Seventh Framework Programme (FP7-ICT-2007-224495: euHeart).
Conflict of interest statement
The authors have no conflicts of interest to declare.