Abstract
Aims: Maximum and stable hyperaemia are critical prerequisites for the accurate measurement of fractional flow reserve (FFR). However, in some patients in whom hyperaemia is induced through a central vein (IV) the minimum distal coronary pressure to aortic pressure ratio (Pd/Pa ratio) develops before the stabilisation of hyperaemia. We sought to describe the prevalence, magnitude and clinical implications of this phenomenon.
Methods and results: The FFR tracing archive of a single institution was reviewed and a total of 104 high-quality IV-FFR recordings from 90 patients were identified. Whenever the minimum Pd/Pa ratio was found before the onset of stable hyperaemia, a search for the lowest Pd/Pa ratio within the steady-state hyperaemic plateau was performed and labelled as FFRstable. Whilst in most cases the minimum Pd/Pa ratio developed during stable hyperaemia, in 19 cases (prevalence of 18.3% [95% CI: 12.0% to 26.8%]) this value was found before the stabilisation of the hyperaemic state. In such cases, the minimum Pd/Pa ratio stabilised later at a higher level (0.77±0.09 vs. 0.81±0.08, p<0.001) (mean difference, 0.03±0.02, range, 0.01 to 0.10). In terms of dichotomous classification of stenosis severity and if FFRstable had been used to decide on revascularisation, reclassification would have occurred in three (2.9%) cases, all presenting a minimum Pd/Pa ratio ≤0.80 with FFRstable >0.80.
Conclusions: During IV adenosine infusion, the minimum Pd/Pa ratio occurs before the stabilisation of hyperaemia in a significant proportion of cases. While the overall difference between the minimum Pd/Pa ratio and its FFRstable counterpart is small, reclassification of stenosis severity might occur, if choosing between the minimum and stable values of FFR within the same trace.
Introduction
Fractional flow reserve (FFR) was experimentally and clinically validated under conditions of maximum and stable hyperaemia1-3. It was convincingly shown that, only under these circumstances, myocardial resistance is minimal and constant, and blood flow is proportional to driving pressure. In clinical practice, however, these important considerations were simplified, and FFR is generally defined as “the maximum achievable flow in the presence of a stenosis, divided by the maximum flow expected in the same distribution in the absence of a stenosis”4. Consequently, this definition implies that maximum achievable flow (corresponding to the minimum distal coronary [Pd] to aortic pressure [Pa] ratio) develops consistently during stable hyperaemia.
Following the initiation of intravenous (IV) adenosine infusion, dedicated consoles identify the minimum trans-stenotic pressure ratio (Pd/Pa) found in the recording period as the FFR. In most cases, this value develops during the steady-state hyperaemic plateau, and therefore the maximum and stable conditions of FFR are both clearly and concurrently present (FFRstable). In some patients, however, the minimum Pd/Pa ratio (corresponding to the maximum flow) develops before the stabilisation of shifting haemodynamics, following the initiation of IV adenosine. This is before the steady-state hyperaemic plateau is reached. In these circumstances, the maximum and stable conditions of FFR do not coincide in time. This frequently occurring, yet poorly described, phenomenon has not been comprehensively addressed in previous research, and its clinical consequences when deciding upon revascularisation with FFR are unknown.
Consequently, in the present study, we sought to assess the prevalence, magnitude and clinical implications of this phenomenon, namely the development of a minimum Pd/Pa ratio before and outside the steady-state hyperaemic plateau.
Methods
ANALYSIS OF FRACTIONAL FLOW RESERVE RECORDINGS
The FFR tracing and associated clinical database of a single institution was reviewed. We chose to include only those FFR traces in which: 1) hyperaemia was induced with adenosine through a central vein (140 mcgr/kg/min); 2) the recording started before initiation of adenosine infusion; and 3) adenosine infusion was maintained for a minimum of two minutes or the steady-state hyperaemic plateau was clearly reached. Traces with artefacts which might affect the quality of the FFR recording, such as loss of Pa or Pd signals, catheter damping, contrast medium injections during recording, automatic calculation pitfalls (identification of FFR during cough, ectopic beats, Pa or Pd noise, etc.) or pressure drift were excluded. In the absence of a formal definition of the steady-state hyperaemic plateau, we defined stable hyperaemia as the observed plateau in mean Pa after stabilisation of changing haemodynamics following the initiation of adenosine infusion. If a plateau was not clearly established, stable hyperaemia was defined as the period of the recording in which no further systematic fall in Pa was observed following the initiation of adenosine infusion. Whenever the minimum Pd/Pa ratio was found before the onset of stable hyperaemia (Figure 1), a search for the lowest Pd/Pa ratio within the steady-state hyperaemic plateau was performed and labelled as FFRstable.
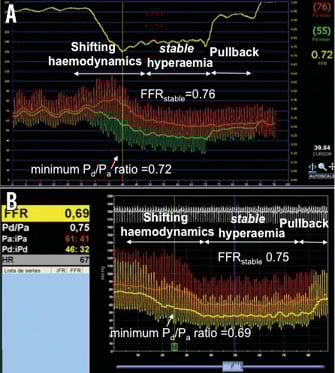
Figure 1. Examples of FFR traces in which the minimum Pd/Pa ratio developed before stable hyperaemia. Note that the minimum Pd/Pa ratio developed during shifting haemodynamics following the initiation of adenosine IV infusion. Afterwards, FFR stabilises at higher values (FFRstable). In panel A, please note the upper yellow line showing the minimum Pd/Pa ratio during the recording. In panel B, please note that, while the FFR value reported by the console denotes the minimum Pd/Pa ratio, the measure bar is placed within stable hyperaemia, at FFRstable, labelled below FFR as Pd/Pa by the console.
STATISTICAL ANALYSES
Categorical variables are presented as counts or percentages. Continuous variables are presented as mean±standard deviation. The normality and homogeneity of the variances were tested using the Kolmogorov-Smirnov and Levene tests. Data were analysed on a per-patient basis for clinical characteristics, and on a per-vessel basis for the rest of the calculations. Continuous variables were compared with t-tests. Categorical variables were compared with maximum likelihood χ2 tests. Differences between paired values of Pa, Pd, as well as their ratios (Pd/Pa, minimum Pd/Pa ratio and FFRstable), were compared with paired t-tests. For the proportion of cases in which the minimum Pd/Pa ratio developed before stable hyperaemia, Wilson’s exact binomial confidence intervals were calculated. To assess the magnitude of the difference between minimum Pd/Pa ratio and FFRstable, Cohen’s d statistics were computed. P-values <0.05 were considered significant. The SPSS 20.0 (IBM, Armonk, NY, USA) statistical software package was used for all calculations.
Results
A total of 104 FFR recordings (90 patients) fulfilled our inclusion criteria: 27 (26%) performed with the Volcano s5™ (Volcano Corp., Rancho Cordova, CA, USA) and 77 (74%) with the RadiAnalyzer™ Xpress (St. Jude Medical, St. Paul, MN, USA) consoles. Figure 2 shows the distribution of FFR values in the study population. In general, it can be acknowledged that it is composed of intermediate FFR values, similar to those observed in clinical populations5.
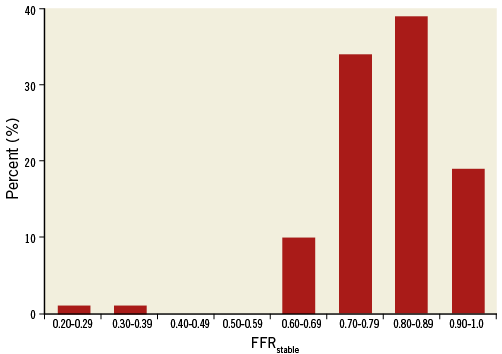
Figure 2. Distribution of the FFR values in the study population.
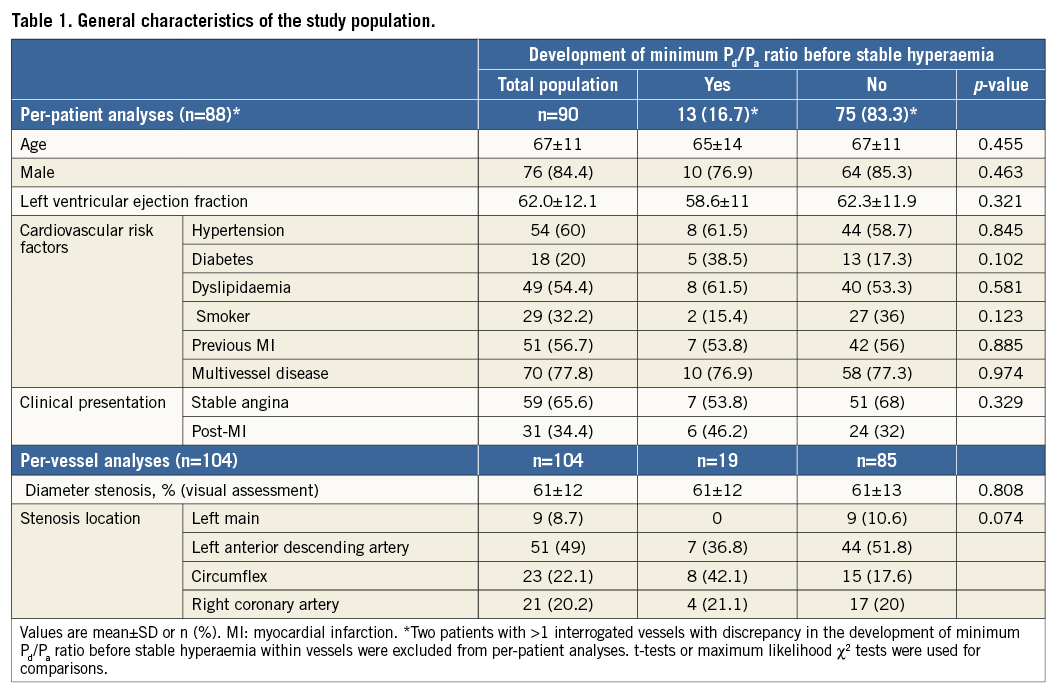
Overall, the minimum Pd/Pa ratio was significantly lower than FFRstable (0.796±0.111 vs. 0.802±0.110, p<0.001), a difference driven by 19 cases, in which this ratio developed before the stabilisation of hyperaemia. Therefore, the prevalence of this phenomenon in the study population was 18.3% (95% CI: 12.0 to 26.8%). In the whole population, Cohen’s d equalled 0.06, indicating that the overall mean of FFRstable was at the 52nd percentile of the overall mean of minimum Pd/Pa ratio (non-overlapping values=3.9%). However, in cases in which the minimum Pd/Pa ratio developed before stable hyperaemia, the difference between both values was higher, since a mean minimum Pd/Pa ratio of 0.77±0.09 stabilised later at 0.81±0.08 (FFRstable) (p<0.001) (mean difference, 0.03±0.02, range, 0.01 to 0.10). In such cases, Cohen’s d equalled 0.40, indicating that the overall mean of FFRstable was at the 65.5th percentile of the overall mean of minimum Pd/Pa ratio (non-overlapping values=27.4%). The time to minimum Pd/Pa ratio after initiation of adenosine infusion was significantly shorter than to FFRstable (70±34 sec vs. 77±29 sec, p<0.001). Finally, the clinical profile of the study population is shown in Table 1. No significant differences in the clinical characteristics between patients in whom the minimum Pd/Pa ratio developed before or within stable hyperaemia were found.
Pressure analyses revealed no significant differences in baseline pressures (Pa [92±21 vs. 94±15 mmHg, p=0.534] and Pd [83±20 vs. 87±16 mmHg, p=0.363]) nor in stable hyperaemic pressures (Pa [76±20 vs. 82±18 mmHg, p=0.179] and Pd [62±20 vs. 67±17 mmHg, p=0.296]) between cases which developed the minimum Pd/Pa ratio before or within stable hyperaemia, respectively. The analysis of aortic and distal pressures at baseline, minimum Pd/Pa ratio and FFRstable in cases that developed the minimum Pd/Pa ratio before stable hyperaemia is shown in Figure 3. It can be observed that a significant drop in Pa and Pd was found when baseline conditions were compared to stable hyperaemia. However, the minimum Pd/Pa ratio was found at a time point in which Pa remained statistically unchanged, despite the fact that Pd had already dropped significantly as compared to baseline (Figure 3). The same figure illustrates how the minimum Pd/Pa ratio developed at a time of shifting haemodynamics, revealed by the fact that Pa and Pd continued to decrease statistically until stabilisation at lower values at FFRstable. Of note, at stable hyperaemia, the prevalence of vessels with Pd below the autoregulation threshold (<60 mmHg) was numerically higher in those cases which developed the minimum Pd/Pa ratio before stable hyperaemia (11 [57.9%] vs. 31 [36.5%]), although statistical significance was not reached (p=0.08).
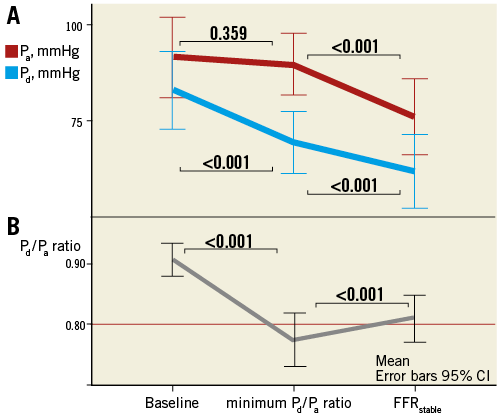
Figure 3. Changes in Pa and Pd at baseline, minimum Pd /Pa ratio and FFRstable in cases where the minimum Pd /Pa ratio value developed before stable hyperaemia. Panel A shows Pa and Pd at these three moments. It can be observed that, at the minimum Pd /Pa ratio, Pd has significantly decreased whilst Pa remains statistically unchanged. During FFRstable, however, both pressures stabilise at significantly lower values. B) The Pd /Pa ratio at the same three moments. The horizontal line is placed at the FFR threshold value of 0.80.
The relationship between the prevalence and cumulative magnitude of this phenomenon across the distribution of FFR values is shown in Figure 4. The per-range percent of cases in which the minimum Pd/Pa ratio developed before stable hyperaemia was higher in tighter stenoses (FFR <0.70). However, most of the percent cumulative magnitude of the discrepancy between FFRstable and minimum Pd/Pa ratio (FFRstable - minimum Pd/Pa) was found within the 0.70 to 0.90 range. In terms of dichotomous classification of stenosis severity, reclassification would have occurred in three (2.9%) cases, all presenting a minimum Pd/Pa ratio ≤0.80 with FFRstable >0.80. Thus, it is expected that, in a population showing the same distribution of FFR values as in ours, if FFRstable is used to decide upon revascularisation, ≈3% of interventions can be avoided if this phenomenon is identified, as they would be judged unnecessary. Importantly, in none of the cases did a minimum Pd/Pa ratio <0.75 stabilise later over the treatment threshold of 0.80. Finally, a similar prevalence of this phenomenon was observed with the two commercially available systems: 14/77 (18.2%) with the RadiAnalyzer Xpress (St. Jude Medical), and 5/27 (18.5%) cases with the Volcano s5 (Volcano Corp.) consoles (p=0.969).
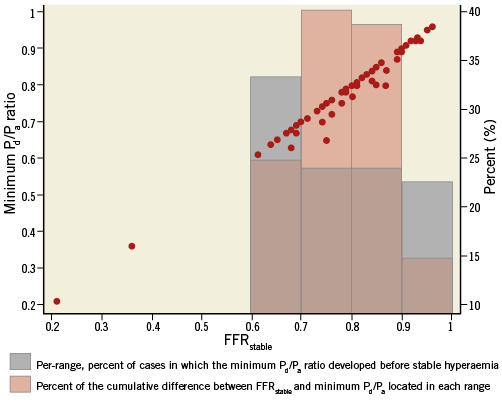
Figure 4. Scatter plot of the relationship between minimum Pd/Pa ratio and its FFRstable counterpart. Bars in grey represent the per-range percent (%) of cases in which the minimum Pd/Pa ratio developed before FFRstable. Bars in pink represent the percent (%) of the cumulative sum of the difference between FFRstable and minimum Pd/Pa ratio located in each range.
Discussion
While in most stenosed vessels interrogated with pressure guidewires the minimum value of FFR develops during stable hyperaemia, the main finding of the present study is that, in a significant proportion of cases (18.3% [95% CI: 12.0% to 26.8%]), the minimum Pd/Pa ratio occurs during shifting haemodynamics following the initiation of adenosine infusion and before the steady-state hyperaemic plateau is reached. This means that, overall, FFRstable is slightly higher than that which is reported by automated machines (overall, 2% higher in this study). Whilst the overall difference between the minimum Pd/Pa ratio and its FFRstable counterpart is small (reflecting the good performance of this ratio-derived index), reclassification of stenosis severity might occur if choosing between the minimum and stable values of FFR within the same trace. The possible physiological basis and clinical implications of this phenomenon are now discussed in detail.
The rationale for FFR calculation relies on pressure sampling during stable hyperaemia, with maximally dilated arterioles and no concomitant shift in other factors influencing coronary haemodynamics, such as extravascular compression, vascular capacitance or central venous pressure. Only then does a modification in the Pd/Pa ratio reflect a proportional change in maximum achievable myocardial flow in the presence of a stenosis relative to the maximum achievable flow in the absence of the stenosis6. However, these criteria of haemodynamic stability are not fulfilled immediately after the initiation of adenosine infusion, but rather only after the stabilisation of the steady-state hyperaemic plateau, when constant and minimum microcirculatory resistance is finally achieved and driving pressure stabilised. This is the reason why IV adenosine infusion (over intracoronary boluses) is widely advocated as the method of reference to induce coronary hyperaemia7.
When initiated, IV adenosine has to pass through the pulmonary circulation before reaching the systemic vascular beds8. From the arterial territories, adenosine first reaches the coronary circulation, increasing coronary blood flow, which enhances left ventricle contractile function. This is known as Gregg’s phenomenon9. A few beats later, adenosine enters the systemic circulation and decreases systemic vascular resistance, triggering a reflex sympathetic discharge which transitorily increases cardiac output and Pa to a variable degree8,10. Under such circumstances (enhanced left ventricle contractile function plus systemic sympathetic discharge), there is a short period of time after adenosine initiation in which aortic pressure might increase (or be maintained) while coronary microcirculatory resistance is falling (Figure 5), findings that have been shown to increase myocardial blood volume and decrease coronary resistance in humans11. Altogether, these situations, according to the resistive model of FFR investigated by Siebes et al, can dictate a lower FFR value12. In addition to this, it can also be argued that coronary capacitance can contribute to this phenomenon, since maximal vasodilation of arterioles with adenosine is followed by a marked increase of coronary capacitance, with a 75% increase in total coronary blood volume in animal models, something which has also been observed in humans11,13. This shift in coronary capacitance might cause a transient dissociation between intracoronary pressure and flow, similar to that observed in early diastole14. Finally, the observed statistical trend towards a higher prevalence of vessels with Pd below the autoregulation threshold (<60 mmHg) in cases which developed the minimum Pd/Pa ratio before the stabilisation of hyperaemia might also suggest a poorer adenosine-induced increase in coronary collateral flow support15 as a contributing factor.
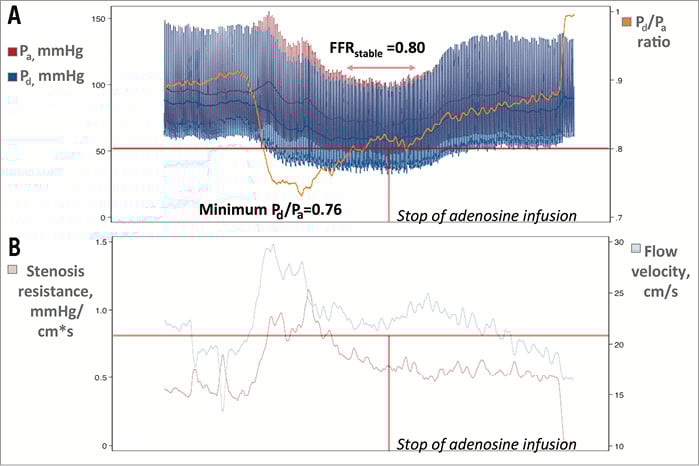
Figure 5. An example of this phenomenon obtained with a guidewire equipped with sensors of pressure and flow velocity (Doppler) (ComboWire® XT; Volcano Corp.). A) Pa, Pd, and the Pd/Pa ratio. Please note that the minimum Pd/Pa ratio was 0.76 and later stabilised at 0.80 (FFRstable). B) Flow velocity (cm/s) and stenosis resistance (Pa-Pd/flow velocity) ([mmHg/(cm/s)]) during the recording. It can be observed that the minimum Pd/Pa ratio developed at a time point when hyperaemia was not yet stable and flow velocity and stenosis resistance were higher. Afterwards, at stable hyperaemia, flow velocity and stenosis resistance decreased, and the Pd/Pa ratio (FFRstable) increased. Horizontal lines in both panels are placed at the treatment thresholds of FFR (≤0.80) and HSR (>0.80), respectively. Vertical line indicates the moment when adenosine infusion was stopped. A non-hyperaemic pullback manoeuvre ruled out pressure drift.
Although the experimental and clinical validation of FFR was done under conditions of maximum and stable hyperaemia1,2, large FFR clinical decision-making studies have not stressed both of these circumstances but rather only the former. This may have happened because seminal validation studies did not state exactly when FFR was measured. For example, in the PET validation study, adenosine was given for four minutes but it is unclear when within these minutes FFR was measured3. Thereafter, subsequent terminology has been open to multiple interpretations. In the DEFER (Fractional Flow Reserve to Determine the Appropriateness of Angioplasty in Moderate Coronary Stenosis) trial, adenosine was administered either intravenously or intracoronarily to induce maximum hyperaemia, although this was not clearly defined15. The FAME study (Fractional Flow Reserve versus Angiography for Multivessel Evaluation) measured FFR after “complete hyperaemia had been achieved” with IV adenosine, suggesting that FFR was measured during the steady-state hyperaemic plateau16. In FAME 2 (Fractional Flow Reserve-Guided PCI versus Medical Therapy in Stable Coronary Disease), FFR was measured “during adenosine-induced hyperaemia”, apparently leaving open the possibility of using either the minimum or stable value of FFR17. Moreover, a recent study which assessed FFR reproducibility measured FFR after the establishment of a “stable minimum value”18. Whilst this rationale protects the simplicity of FFR measurements in clinical practice, our findings show that, in a significant proportion of patients, the minimum and stable values of FFR are close, but not the same, and may not coincide in time. More importantly, in a small proportion of patients, this difference might lead to different decisions when deciding upon revascularisation with FFR19. Although the overall difference between the minimum and stable values of FFR is small, this ambiguity might become important in core laboratory environments or when studying different hyperaemic routes or agents. A recent statement for the standardisation, recording and reporting of FFR as a core laboratory technique recommended making FFR measurements after the administration of IV adenosine for at least two minutes and calculating it as “the ratio of Pd to Pa at maximal hyperaemia, the nadir of Pd”7. As our study suggests, the nadir in Pd may not coincide with the minimum Pd/Pa ratio of the same trace. Therefore, this definition might be improved if the phenomenon described in our study is identified and corrected.
Conclusion
Finally, we believe that the discussion as to whether the lowest trans-stenotic pressure ratio measured after initiation of IV adenosine consistently fits with the theoretical model of FFR is not a trivial one. In principle, it would be desirable to estimate FFR in clinical practice in the closest possible manner to that expressed in its theoretical form. Moreover, it should be recognised that the theoretical assumptions on which FFR is measured in cases in which the minimum Pd/Pa ratio develops before stable hyperaemia are not fully correct. Whilst this phenomenon appeared to have little impact on stenosis severity classification in our study population (therefore not being in conflict with the value of FFR in decision making demonstrated in large clinical studies), it remains plausible that selective estimation of FFR during stable hyperaemia might lead to a slightly better diagnostic performance of the test. Moreover, even though in our data no clinical determinants were statistically associated with this phenomenon, it seems reasonable to speculate that conditions affecting the left ventricle systolic and/or diastolic functions as well as the coronary microcirculation or the autonomous nervous system might exert an influence on the development of the described condition. In any case, our study stresses the importance of a correct and standardised methodology for FFR measurement, and it would be desirable that both clinicians and core laboratories take this phenomenon into consideration. Our findings highlight the fact that FFR calculation is not only a number but a complex physiological interrogation above that provided by automated consoles. Further studies towards the understanding and potential implications of this phenomenon are required.
Limitations
This study has several limitations. Being a retrospective analysis, selection bias cannot be ruled out. Our conclusions are also limited by the relatively small sample size. Finally, being a single-centre experience, the external reproducibility of our findings has to be challenged. In spite of these limitations, we believe that the observations gathered can contribute to refining intracoronary physiological guidance with FFR.
| Impact on daily practice Fractional flow reserve (FFR) was validated under conditions of maximum and stable hyperaemia. However, in a significant proportion of cases, the minimum Pd/Pa ratio (corresponding to the maximum flow) observed during intravenous adenosine infusion and reported by automated consoles develops before the stabilisation of hyperaemia, where the FFR theoretical framework is not fully correct. Although the overall difference between the minimum Pd/Pa ratio and FFR is small, it would be desirable to estimate FFR in clinical practice in the closest possible manner to that expressed in its theoretical form. Therefore, whenever this phenomenon is identified, a manual relocation of the measure bar to the steady-state plateau is recommended for optimal FFR calculation. |
Acknowledgements
M. Echavarria-Pinto acknowledges the Fundación Interhospitalaria Investigacion Cardiovascular, Madrid, Spain, for a clinical research scholarship.
Conflict of interest statement
M. Echavarria-Pinto, T. van de Hoef, J. Escaned and J. Piek have served as speakers in educational events organised by St. Jude Medical and Volcano Corporation. J. Davies is a consultant for Volcano Corporation. The other authors have no conflicts of interest to declare.