Abstract
Aims: Recently developed microcatheters can be used instead of a pressure wire for fractional flow reserve (FFR) measurement. We sought to assess the haemodynamic and clinical impact of using a larger profile device to measure FFR.
Methods and results: Our prospective registry included 77 consecutive patients who underwent invasive FFR measurement of intermediate coronary stenoses between June 2015 and July 2016. FFR values were obtained first using a pressure wire only (FFRw), second using a Navvus microcatheter (FFRMC), and finally using the wire with the microcatheter still in the stenosis (FFRw-MC) during intravenous adenosine infusion. Eighty-eight stenoses were suitable for a thorough head-to-head comparison. Mean FFRw (0.83±0.08) was significantly higher than mean FFRMC (0.80±0.10) and FFRw-MC (0.80±0.10). Mean FFRMC and FFRw-MC did not differ significantly. Bland-Altman analysis showed a bias of –0.03±0.05 for lower FFRMC values compared to FFRw values. Using a threshold of 0.80 for FFR, the indication for revascularisation would have differed when based on FFRMC versus FFRw in 20/88 (23%) of the lesions and 18/77 (23%) of the patients.
Conclusions: FFR measured using a microcatheter overestimates stenosis severity, leading to erroneous indication for revascularisation in a sizeable proportion of cases.
Abbreviations
DS: diameter stenosis
FFR: fractional flow reserve
FFRw: fractional flow reserve with pressure wire
FFRMC: fractional flow reserve with microcatheter
FFRw-MC: fractional flow reserve with pressure wire on a microcatheter
MC: microcatheter
MLD: minimal luminal diameter
Pd/Pa: ratio between distal pressure and aortic pressure
QCA: quantitative coronary angiography
RD: reference diameter
SD: standard deviation
Introduction
Fractional flow reserve (FFR), defined as maximum coronary blood flow in the presence of a stenosis divided by the maximum coronary blood flow without stenosis, is considered the standard of reference for detecting myocardial ischaemia induced by coronary artery stenosis. FFR is measured as a pressure ratio during maximal hyperaemia1,2, based on distal coronary pressure determined using a pressure measuring guidewire3. The clinical value of FFR-based decision making is supported by several randomised control trials and meta-analyses. For most lesions and patient subsets, an FFR of >0.80 indicates that a patient’s clinical outcome will not be improved by coronary revascularisation4,5, with the exception of during the acute phase of myocardial infarction6-16. Accordingly, the use of FFR is endorsed by both the European and American cardiology societies17-19.
It has been demonstrated that the presence of a 0.015 inch wire does not impact significantly on the haemodynamics of mild-to-moderate stenosis3; however, the potential influence of a larger measuring tool remains unclear. The recently developed FFR microcatheter (MC) (Navvus™ MicroCatheter; ACIST Medical Systems, Inc, Eden Prairie, MN, USA) has also been applied to FFR measurement. We performed a head-to-head comparison between wire-based and microcatheter-based FFR measurements to assess the clinical implications of using microcatheter-based FFR measurements to guide revascularisation decisions.
Material and methods
We conducted a single-centre prospective registry study at the Clinique Sainte Clotilde in Saint Denis, Reunion Island, from June 2015 to July 2016. During this study period, 99 consecutive patients underwent FFR measurements for clinical reasons, i.e., for evaluation of a mild-to-moderate stenosis visible at angiography defined as coronary stenosis between 40 and 70% assessed by visual estimation and for which no meaningful non-invasive stress testing was available at the time of the catheterisation. We compared FFR results obtained using pressure wire (FFRw) with those obtained with the Navvus MC (FFRMC). Our study primary endpoint was evaluation of the differences between results obtained using FFRw and FFRMC in daily practice. Our secondary endpoint was to evaluate the clinical impact of using FFRMC instead of FFRw to guide revascularisation decisions. Our threshold for coronary revascularisation was an FFR value of ≤0.80. All included patients gave their signed informed consent to participate, and the study protocol was approved by our ethics committee.
PROCEDURE
Procedures were performed under local anaesthesia. At the start of the procedure, all patients received 250 mg of intravenous aspirin and intravenous enoxaparin (0.5 mg/kg). A size 5 (n=2; 3%) or 6 (n=75; 97%) Fr introducer sheath was inserted into the radial artery (n=60; 78%) or femoral artery (n=17; 22%). Coronary angiography was systematically performed following administration of nitrates (1 to 3 mg). A size 5 (n=4; 5%) or 6 (n=75; 95%) Fr guiding catheter was used for FFR measurements. All FFR measurements were performed with a pressure wire and a QUANTIEN™ monitor (St. Jude Medical, St. Paul, MN, USA), as well as with the Navvus MC and an ACIST RXi® monitor (ACIST Medical Systems). FFR measurements with both the wire and microcatheter systems were subjected to initial equalisation with the pressure sensors at 1 mm out of the guiding catheter, recorded under fluoroscopy. Equalisation and all FFR measurements were systematically performed after flushing with heparinised saline solution, and withdrawal of the wire needle of the Y-shaped connector. In all cases, a state of maximal hyperaemia was induced by antecubital intravenous administration of adenosine at a dose of 180 µg/kg/min20,21.
STUDY PROTOCOL
FFR was first measured downstream of the coronary stenosis using the FFR wire. Next, FFR was measured at exactly the same place (recorded under fluoroscopy) using the FFR Navvus MC loaded on the FFR wire. All FFR measurements were performed during the maximal hyperaemia steady state induced by intravenous adenosine administration. We obtained a total of three FFR values per lesion: FFR measured using the wire (FFRw), FFR measured using the microcatheter (FFRMC), and FFR measured using the wire with the microcatheter in place (FFRw-MC). We systematically performed quantitative coronary angiography (QCA) using the software Allura Xper FD 10 (Philips Healthcare, Amsterdam, the Netherlands), recording the vessel name and the coronary tree segment number according to the AHA classification, as well as the minimal luminal diameter (MLD) of the stenosis, the diameter stenosis (DS), and the reference diameter (RD). We included intermediate coronary artery lesions with 40 to 70% coronary stenosis assessed by visual estimation and an RD of >2.5 mm, as assessed by QCA. Lesions with an RD of <2.5 mm were excluded from the study. For each included coronary lesion, we compared every FFRw, FFRMC, and FFRw-MC value and calculated the difference between FFRw and FFRMC. We calculated the Pearson’s correlation coefficient (r) between FFRw and FFRMC values, and successively with RD, MLD and DS values assessed by QCA. Drift was defined as the difference observed between equalisation and Pd /Pa value observed at the same position after FFR measurement of more than 0.02. Drift was systematically checked after FFRw and FFRMC measurements. In case of drift with FFRw, a second equalisation was allowed to continue the protocol. In order not to extend the procedure duration, a third FFRw or a second FFRMC after drift was not performed and therefore excluded from correlation analysis (Table 1).
STATISTICAL ANALYSIS
All analyses were performed using SPSS, Version 21.0 (IBM Corp., Armonk, NY, USA) and GraphPad Prism 7.0 (GraphPad Software, Inc., San Diego, CA, USA). The FFR groups were compared using a non-instrumented Student’s t-test for continuous variables, a chi2 test, or Fisher’s exact test for category-exact comparisons of variables according to group size. The correlation between FFR groups was analysed by calculating the Pearson’s correlation coefficient (r), and the agreement between FFRw and FFRMC was assessed using Bland-Altman plots of the relative differences. A p-value of <0.05 was considered to indicate statistical significance but the classic cut-off of 0.025 was used for the sample size calculation (one-sided). Assuming a difference of FFR measurements of 0.02 between the two techniques with a standard deviation (SD) of 0.06522, a sample size of 85 lesions was calculated to provide 80% power to reject the null hypothesis (FFRMC is not lower than FFRw) at 2.5% one-sided significance.
Results
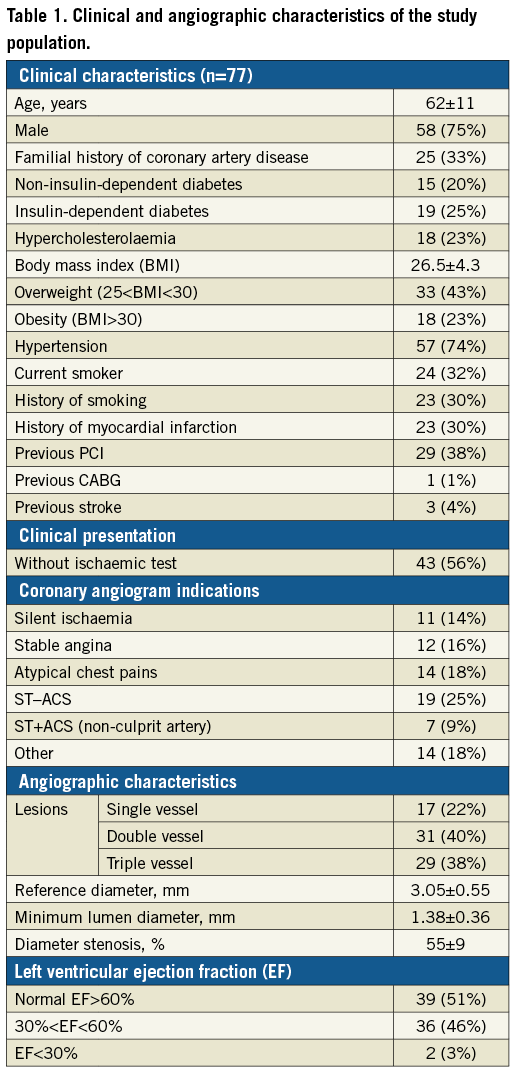
A total of 99 patients and 123 lesions were included in our prospective registry from June 2015 to August 2016. Of these, 77 patients and 88 lesions were eligible for comparative statistical analysis. Figure 1 presents the reasons for exclusion. Table 1 lists the clinical and angiographic characteristics of our study population. FFR measurements with the pressure wire and microcatheter device were equally safe for patients. The primary success rate – defined by positioning the pressure sensor downstream of the coronary artery lesion – was significantly higher with the FFRw (123/123 lesions; 100%) than with the FFRMC (108/123 lesions; 88%) (p<0.0001). Drift rates were similar between FFRw (18/103 lesions; 17.5%) and FFRMC (16/103 lesions; 15.5%) (p=0.71). Among 88 lesions finally included, the mean FFRw (0.831±0.07) was significantly higher than mean FFRMC (0.797±0.10; p=0.012) and FFRw-MC (0.796±0.95; p=0.008), while no significant difference was observed between FFRMC and FFRw-MC (p=0.846) (Figure 2, Figure 3). The Pearson’s correlation coefficient (r) between FFRw and FFRMC was 0.85 (p<0.0001), with FFRMC values being lower than FFRw values (Figure 4). Bland-Altman plot analysis showed a bias of –0.03±0.05 for lower FFRMC values compared to FFRw values (Figure 4). Resting Pd /Pa values did not differ between the two devices, with a median of 0.930 with the pressure wire and 0.935 for the MC (p=0.96).
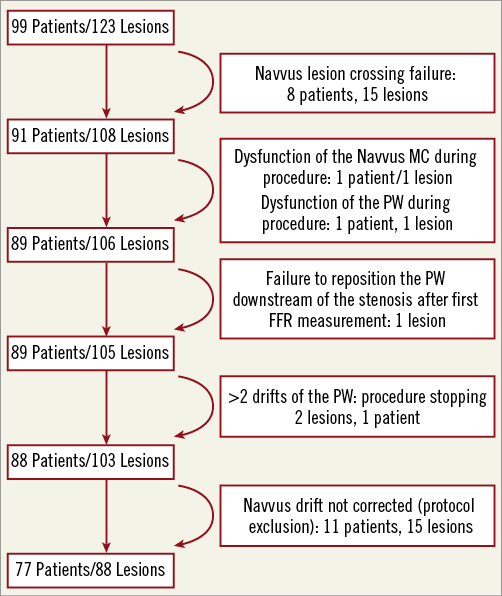
Figure 1. Flow chart of patient inclusion. FFR: fractional flow reserve; PW: pressure wire; QCA: quantitative coronary angiography
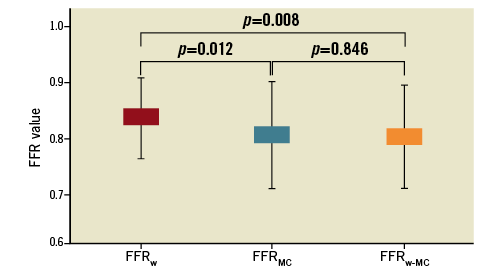
Figure 2. Comparison of mean fractional flow reserve (FFR) values between devices. Mean FFR measured by wire (FFRw) was significantly higher compared to both mean FFR measured by microcatheter (FFRMC) and mean FFR measured by wire with the microcatheter also in the stenosis (FFRw-MC).
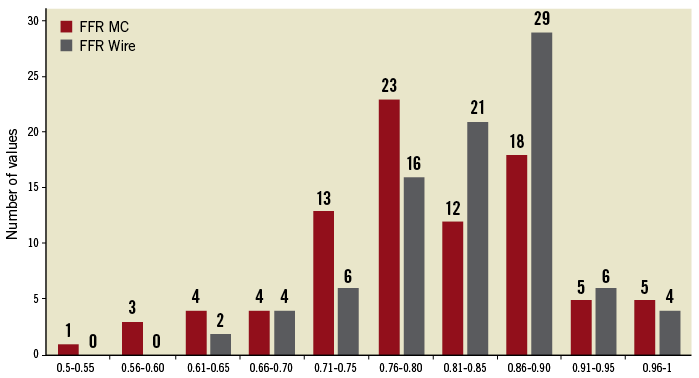
Figure 3. FFRw and FFRMC distribution.
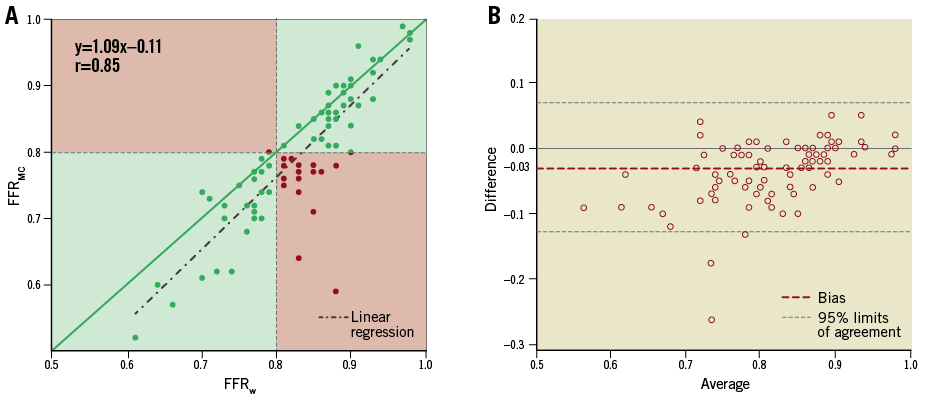
Figure 4. Correlation between FFRw and FFRMC and comparison of Bland-Altman plots. A) Correlation between FFRw and FFRMC. The majority of points as well as the linear regression are below the identity line. Pearson’s correlation coefficient (r)=0.85 (p<0.0001). B) Bland-Altman diagram between FFRw and FFRMC, showing an average bias of –0.03±0.05 for FFRMC compared to FFRw. The 95% limits of agreement were between –0.129 and 0.069. FFRMC: fractional flow reserve measured by microcatheter; FFRw: fractional flow reserve measured by wire
FFR DEVICE AND CLINICAL IMPLICATIONS
Using a threshold of 0.80 for coronary revascularisation, a revascularisation indication would have been wrongly decided, using an FFR microcatheter instead of an FFR wire, in 20/88 (23%) of the lesions and 18/77 (23%) of the patients.
FFR DEVICE AND ANGIOGRAPHIC SUBSETS
FFRw–FFRMC was calculated, and the correlation coefficient was studied successively with the RD, MLD, and DS as assessed by QCA. FFRw–FFRMC values were significantly correlated with RD (r=–0.21; p=0.042), but not with MLD (p=0.16) or DS (p=0.95) (Figure 5).
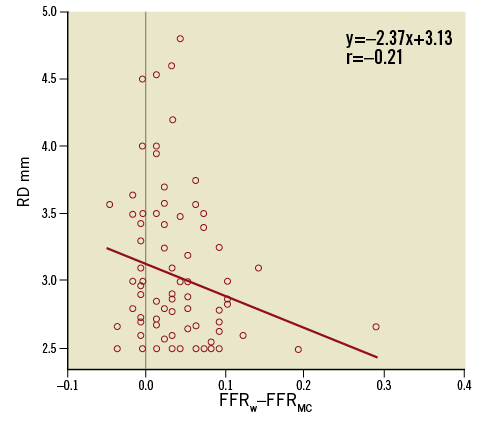
Figure 5. Correlation between FFRw–FFRMC and reference diameter. Pearson’s correlation coefficient (r)=–0.21. p=0.043. FFRMC: fractional flow reserve measured by microcatheter; FFRw: fractional flow reserve measured by wire; RD: reference diameter
Discussion
The present results showed that the presence of a microcatheter in a stenosis resulted in a lower FFR value, leading to inappropriate indications for revascularisation in a sizeable proportion (23%) of lesions and patients. In three cases (3.4%), FFRMC was higher than FFRw, but these differences were of small magnitude and had no clinical impact. Systematic evaluation of each measurement revealed similar drift rates between the two devices.
The present study of consecutive patients showed that FFRw and FFRMC were equally safe, with no reported coronary or vascular complications. All of the cases in this registry were managed by senior experienced interventional cardiologists. Three reversible complete atrioventricular blocks (3.9%) were reported during adenosine infusion, without clinical complications. While the wire used for FFR measurement was able to cross all lesions, the microcatheter could cross only 88% of them, with crossing failures mainly due to tortuous and/or calcified arteries. Per protocol, the Navvus MC was advanced across the interrogated FFR lesion on the pressure wire, which arguably may not have provided optimal support. However, even if the pressure wire support was not as good as other kinds of support wire, it typically provides sufficient support to advance balloons and stents.
The values measured with the wire and microcatheter revealed a trend for lesion severity overestimation with the microcatheter, with FFRMC being significantly lower than FFRw, and showing an average mean bias of –0.03 and a lower specificity. While the pressure wire has a diameter of 0.014”, the Navvus MC has diameters of 0.025”×0.020” across the lesion and 0.027”×0.036” at the level of the pressure sensor. In other words, the cross-sectional area of the Navvus catheter at its narrowest spot is still 2.5 times larger than that of a regular pressure wire; at the level of the shaft, throughout the remaining part of the coronary artery, the cross-sectional area is four times that of the pressure wire. Therefore, it is imaginable that the presence of the catheter constitutes a long mild stenosis in the coronary artery, especially during maximal hyperaemia, since no significant Pd /Pa differences were observed in our study. Accordingly, we found a significant correlation between the difference observed between the two different FFR devices and the reference diameter of coronary stenosis.
Our results show that FFRMC overestimated the functional significance of coronary artery lesions, and that this difference was probably due to the bulky nature of the MC. Remarkably, FFRMC and FFRw-MC were similar. The ACCESS-NZ trial included 50 patients, and showed a good correlation between FFRw and FFRMC, without a difference between the devices in terms of functional lesion significance and clinical decision22. FFRMC might have potential technical advantages, allowing FFR pullback recording for serial stenosis evaluation and easier repositioning of the pressure sensor in case of drift, without the need to recross the lesion. Nevertheless, these potential advantages have to be balanced with the lower crossability of lesions in tortuous and calcified lesions. In contrast, our present study investigated a larger number of patients (n=77) and lesions (n=88), and included allcomers with a wide range of intermediate stenosis. Possibly due to these differences, we found that FFRMC was significantly lower than FFRw, particularly in vessels with a small reference diameter, leading to an inappropriate coronary revascularisation indication in a sizeable proportion of cases.
Study limitations
Since we did not compare FFR values in ostial lesions, sequential lesions, or small vessels (diameter <2.5 mm), we cannot generalise our conclusions to these circumstances. We encountered a higher rate of non-crossable lesions with the microcatheter, which was advanced on a pressure wire. We cannot comment on whether the microcatheter crossability may have been better if advanced on a regular wire. Finally, to achieve a prolonged and stable hyperaemic steady state, we used intravenous adenosine infusion, which can generate some overall pressure variation and may have contributed to some minor random differences between the two devices.
Conclusions
Compared to FFR assessed with a pressure wire, FFR assessed with a microcatheter overestimated the functional significance of intermediate coronary artery stenosis. This overestimation led to a change in coronary revascularisation indication in 23% of the lesions and 23% of the patients. FFR should be measured with a pressure wire.
| Impact on daily practice Fractional flow reserve (FFR) measures the ratio between mean distal coronary pressure and mean aortic pressure under maximal hyperaemia, usually with a pressure wire. Any additional intracoronary obstruction may increase this ratio. The size of the device to measure FFR is of importance to assess the functional significance of coronary stenoses. Therefore, FFR measured with a microcatheter overestimates the functional significance of coronary stenoses. |
Conflict of interest statement
C. Pouillot reports receiving a grant from St. Jude Medical. The other authors have no conflicts of interest to declare.