
Abstract
Aims: Fractional flow reserve (FFR), the reference standard for guiding coronary revascularisation, is most commonly acquired during intravenous adenosine infusion. Results may be sensitive to system- and operator-dependent variability in how pressure data are analysed and interpreted. To quantify FFR objectively, we developed a computational protocol to process the recorded pressure signals in a consistent manner. We studied the impact on lesion (re)classification and compared this with the operator-selected FFR obtained during cardiac catheterisation.
Methods and results: The algorithm used a moving average and Fourier transformation to identify the Pd/Pa ratio at its nadir (FFRmin) and during the stable hyperaemic period (FFRstable) in <2 s with 100% repeatability, in 163 coronary stenoses (93 patients). The mean operator-selected FFR (FFRCL) was higher than FFRmin and lower than FFRstable (0.779 vs. 0.762 vs. 0.806, p=<0.01). Compared with FFRmin, FFRstable resulted in 16.5% of all lesions being reclassified, all from significant to non-significant (p<0.01). FFRCL classified lesion significance differently from both FFRstable and FFRmin (11.7% and 6.1% lesions reclassified, respectively, p<0.01).
Conclusions: Subtle differences in how pressure data are analysed and interpreted by the operator during adenosine infusion result in significant differences in the classification of physiological lesion significance. An algorithmic analysis may be helpful in standardising FFR analysis, providing an objective and repeatable result.
Abbreviations
CAD: coronary artery disease
CAG: coronary angiography
FFR: fractional flow reserve
FFRCL: the value of Pd/Pa documented as the fractional flow reserve by the operator in the catheterisation laboratory during the procedure
FFRmin: the minimum value of Pd/Pa achieved during adenosine infusion
FFRstable: the value of Pd/Pa during the stable period of hyperaemia adenosine infusion
FFT: fast Fourier transformation
LAD: left anterior descending artery
LCX: left circumflex artery
PCI: percutaneous coronary intervention
Pa: proximal aortic pressure
Pd: distal coronary pressure
RCA: right coronary artery
Introduction
Standard coronary angiography (CAG) is subjective and does not reliably identify ischaemia-causing lesions1,2. Fractional flow reserve (FFR) is a more objective measure of physiological lesion significance in the cardiac catheterisation laboratory3,4 and, when used to guide percutaneous coronary intervention (PCI), reduces adverse cardiac events compared with angiographic guidance alone5. When performing FFR, hyperaemia is usually achieved with an intravenous infusion of adenosine. Sixty to ninety seconds after adenosine infusion is commenced, the proximal and distal pressures (Pa and Pd) begin to rise and then fall6. During this phase, the difference between the proximal (Pa) and distal (Pd) is maximal and the FFR is minimal. Subsequently, the FFR stabilises at a slightly higher level, namely maximal stable hyperaemia6.
In the cardiac catheterisation laboratory, FFR analysers provide a real-time Pd/Pa readout. Most systems log and display the minimum Pd/Pa value encountered during an analysis (“run”) in which the pressure wire is positioned across a coronary artery lesion. Operators may review the Pd/Pa traces by moving a cursor along the time course of the recordings, choosing a value of Pd/Pa to record as the FFR (Figure 1). This is then used to guide treatment decisions. However, the FFR result is sensitive to variability in how and when the Pd/Pa signal is processed and interpreted. During the administration of adenosine, several phases are observed in the Pa and Pd signals caused by sequential pulmonary, coronary and systemic arteriolar vasodilation with physiological compensation by the cardiovascular regulatory mechanisms. Eventually, these components equilibrate and a stable phase of coronary hyperaemia is achieved6-9. Typically, three key phases are observed sequentially in the Pd/Pa signal (Figure 1) during FFR measurement:
– “baseline” – Pd/Pa ratio prior to adenosine administration
– “peak response” – when Pd/Pa reaches its minimum value (FFRmin)
– “stability” – during hyperaemia but when Pd/Pa is stable (FFRstable)
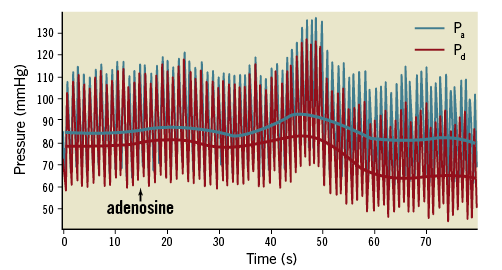
Figure 1. An example of the proximal and distal pressure (Pa and Pd) response to intravenous adenosine. Raw pressure data are demonstrated. The solid lines represent the means of the Pa and Pd.
Typically, when the Pd/Pa ratio falls, it reaches its lowest value and then stabilises at a higher level as the period of stable maximal hyperaemia6,8. Some experts support the measurement of FFR during the period of stable hyperaemia6,10, whereas others support the use of the minimal acquired value of the Pd/Pa ratio7,11. Differences between these two approaches may affect the FFR result and even the classification of physiological lesion significance10. How the analyser systems are set up to average the raw Pd/Pa data (i.e., over an arbitrary number of cardiac cycles) may also affect the FFR result by smoothing the signal. An element of subjectivity may also be introduced when the operators review the Pd/Pa trace to determine the FFR because this process may be hampered by instability or artefactual aberrations in the signal. Thus, whilst a major strength of FFR is its objectivity, an element of subjectivity may still cloud its interpretation.
In this study we demonstrate a mathematical algorithm which objectively analyses the Pd/Pa signal to standardise FFR measurement. The algorithm was used to identify the Pd/Pa nadir (FFRmin) and the Pd/Pa during the stable period of hyperaemia (FFRstable) (Figure 1). These were compared with each other and with the operator-selected FFR, chosen in the cardiac catheterisation laboratory during the procedure. We then studied the impact of each approach on physiological lesion classification, in a real-world cohort of patients with coronary artery disease (CAD).
Methods
STUDY LOCATION
Data were collected at the South Yorkshire Cardiothoracic Centre, Sheffield Teaching Hospitals NHS Foundation Trust, Sheffield, UK, and analysed at the University of Sheffield, UK. All work was approved by the NHS Research Ethics Committee. Participating patients provided informed consent.
CLINICAL DATA
Consecutive patients with chronic stable coronary artery disease with at least one stenosis between 50-90% by visual analysis of the angiogram were recruited and studied prospectively with FFR. Exclusion criteria were serious comorbidity, inability to provide informed consent, chronic total occlusion, acute presentation within 60 days, and intolerance of intravenous adenosine, nitrate, or iodine-based contrast media. FFR assessment was measured with the PrimeWire PRESTIGE® (Volcano Corporation, San Diego, CA, USA) or PressureWire™ X guidewire (St. Jude Medical, St. Paul, MN, USA) systems. Hyperaemia was induced by a central intravenous infusion of adenosine at 140 μg/kg/min ensuring no Pa ventricularisation or Pd signal drift. FFR was recorded by the operator as the value judged to represent the Pd/Pa nadir as originally described11. All pressure data were recorded for at least two minutes, until stable hyperaemia had been achieved. Physiological lesion significance was defined as FFR ≤0.80 and operators interpreted the FFR as the nadir of the Pd/Pa trace during maximal hyperaemia, according to the methods originally described by De Bruyne et al5. This measurement, as documented in the medical notes by the operators during the procedure, was referred to as the catheter laboratory FFR (FFRCL). PCI was guided by the FFRCL result. After PCI, FFR was repeated to ensure an optimum physiological result.
THE MATHEMATICAL ALGORITHM
The novel algorithm identified values representing each of these phases using the Pd/Pa signal. Raw Pa and Pd pressure data were exported from the catheterisation laboratory. The Volcano and St. Jude systems sampled the invasive pressure data at 200 Hz and 100 Hz, respectively. The algorithm (developed in MATLAB; MathWorks, Inc., Natick, MA, USA) post-processed the Pa and Pd pressure signals over the entire recording from onset of adenosine infusion to the end of the recording. For computing FFRmin, the raw Pd and Pa pressure signals were divided into individual cardiac cycles. The beat-by-beat Pd/Pa ratio was calculated, and FFRmin was considered as the minimum value of a three-beat moving average, which is consistent with the typical output of clinical analysers. For computing FFRstable, a fast Fourier transformation (FFT) decomposed the individual pressure signals in the frequency domain. A low band-pass filter was applied with a 0.04 Hz threshold, corresponding to a period of 25 s. This eliminated higher frequency components (>0.04 Hz) of the pressure signals, namely cardiac (typically ~1.0 Hz) and respiratory (typically ~0.2 Hz) components. Figure 2 shows that this filtering procedure captures the temporal gradients associated with the adenosine response whilst eliminating the unwanted respiratory and cardiac frequencies. The purpose of this filter is to assist the process of identification of a stable period, to avoid confounding by high temporal gradients in the cardiac or respiratory cycle. This could equally have been achieved using a moving average over a defined window. To identify FFRstable, the 1st derivative of the Pd/Pa trace was calculated using a central finite difference scheme using a sampling period of seven seconds. FFRstable was identified as the average of the Pd/Pa ratio during the stable period, identified between the first and last instants where the 1st derivative was below a threshold, after the peak response. The threshold for the 1st derivative was 10–5, and this was increased in 5% increments with an upper limit of 2×10⁻³.
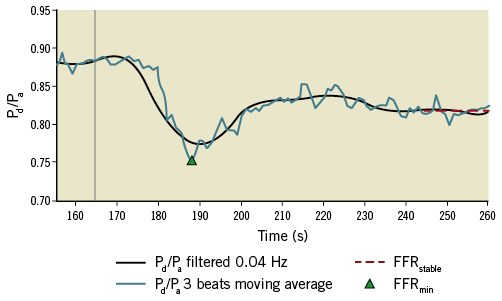
Figure 2. The graphical output of the mathematical algorithm. The algorithm has identified FFRmin from the moving average Pd/Pa (blue line) and FFRstable (red dotted line) from the filtered signal (black line). The vertical grey line indicates the commencement of the adenosine infusion.
In addition to the numerical results, the algorithm provided a graphical analysis of each case, demonstrating the physiological response as a function of time. This was parsed visually to ensure validity of the computed results. An example is illustrated in Figure 2. To demonstrate the effect of signal averaging, ectopic beats and artefact on the FFR result, we analysed the data first averaging every single cardiac cycle and then averaging over two and three cardiac cycles. All computation was performed on a standard office PC (Dell OptiPlex 3020, Intel Core i5, 3.20 GHz, 8GB RAM).
STATISTICAL ANALYSIS
FFR values were compared by calculating the mean delta (bias). Bland-Altman plots and the limits of agreement (±1.96 standard deviation) were plotted12. Statistical differences between means were calculated using paired-sample t-tests (assuring normal distribution). Agreeability was assessed by calculating the intra-class correlation coefficient. Data are presented as mean (standard deviation) unless otherwise stated. FFR signal variability was assessed by calculating the mean, standard deviation, range, and coefficient of variation (CoV). The significance of lesion reclassification was assessed with McNemar’s test. Statistical analyses were performed using IBM SPSS (IBM Corp., Armonk, NY, USA) and Microsoft Excel (Microsoft Corp., Redmond, WA, USA).
Results
CLINICAL DATA
One hundred and sixty-three coronary artery lesions from 93 patients were studied. Seventy patients were male (75%), 61 had hypertension (65.5%), 38 had a history of prior myocardial infarction (40.9%), and 21 were diabetic (22.6%). Mean age was 64.7 years (10.2) and mean BMI was 29.3 (4.7). Lesions were located in 72 left anterior descending, 40 right, 33 left circumflex, 13 diagonal and 5 left main stem coronary arteries. The mean FFRCL was 0.779 (0.15); 84 lesions (64 patients) were physiologically significant (FFR ≤0.80) and 79 were non-significant (FFR >0.80). Patient and lesion characteristics are summarised in Table 1.

THE ALGORITHM PERFORMANCE
The algorithm identified the phases of the Pd/Pa response during adenosine infusion, irrespective of the presence of tachycardia (n=5), bradycardia (n=11) or atrial fibrillation (n=5) in all cases. An example of a typical result is demonstrated in Figure 2. The algorithm computed results for each case in a mean time of 1.9 s. The results obtained from the algorithm were identical on repeated analysis.
Pd/Pa VARIABILITY
During the period of stable hyperaemia, the Pd/Pa signal varied by 2% (mean coefficient of variation 0.02 [0.01]). The maximum observed variability was 6.3%, the minimum was 0.2% and 6% of cases had ≥5% variability. Variability was similar in cases with bradycardia, tachycardia and atrial fibrillation (mean CoV=0.01, 0.01 and 0.02, respectively). Under baseline conditions, variability in the Pd/Pa ratio was 0.7% (mean CoV=0.007 [0.017]).
SIGNAL PROCESSING
The number of cardiac cycles over which Pd/Pa data were averaged had an effect on FFRmin. FFRmin was lowest when the Pd/Pa signal was averaged over individual cardiac cycles. As the number of cycles increased from one to two to three beats, the Pd/Pa signal became smoother and the mean FFRmin increased marginally (0.746 [0.17] vs. 0.757 [0.16] vs. 0.762 [0.16]: p<0.001 for all comparisons). Cardiac cycle averaging also affected the physiological classification of lesions: 1-beat, 2-beat and 3-beat averaging resulted in 58%, 56% and 55% of lesions being classified as physiologically significant, respectively.
COMPARING MEAN VALUES OF FFRmin, FFRstable AND FFRCL
As demonstrated in the Bland-Altman plot (Figure 3A), FFRmin was consistently lower than FFRstable (0.762 [0.16] vs. 0.806 [0.15], p<0.001). The intra-class correlation coefficient between FFRmin and FFRstable was 0.986 (95% CI: 0.98-0.99, p<0.001). As demonstrated in the Bland-Altman plots (Figure 3B, Figure 3C), FFRCL was higher than FFRmin (0.779 [0.15] vs. 0.762 [0.16], p<0.001) but lower than FFRstable (0.806 [0.15], p<0.001). The intra-class correlation coefficient between FFRCL and FFRmin was 0.990 (95% CI: 0.99-0.99, p<0.001) and between FFRCL and FFRstable was 0.987 (95% CI: 0.98-0.99, p<0.001).

Figure 3. Bland-Altman plots demonstrating the differences between FFRmin, FFRstable and FFRCL. The unbroken horizontal lines represent the bias (mean delta) and the dashed horizontal lines represent the limits of agreement (±1.96 SD around the mean). A) FFRmin vs. FFRstable, bias=0.044±0.07. B) FFRCL vs. FFRmin, bias=0.017±0.06. C) FFRCL vs. FFRstable, bias=0.03±0.07. Coloured dots indicate lesions which crossed the threshold of physiological significance (≤0.80) and were reclassified as a result of the different methods. Red indicates cases changing from significant to non-significant and blue indicates cases moving from non-significant to significant.
IMPACT OF OBJECTIVE ANALYSIS ON CLASSIFICATION OF LESION SIGNIFICANCE
With FFRmin taken as arbiter of lesion significance, 92 lesions (56.4%) were classified as physiologically significant and 71 (43.6%) non-significant. With FFRstable as arbiter, 65 lesions (39.8%) were significant and 98 (60.2%) were non-significant. Thus, using FFRstable instead of FFRmin resulted in 16.5% of all lesions (27 lesions, 23 patients) being reclassified from significant to non-significant (p<0.01). With FFRCL as arbiter of lesion significance, 84 lesions (51.5% lesions) were deemed to be physiologically significant and 79 (48.5%) non-significant. Compared with FFRmin, using FFRCL as arbiter resulted in 6.1% of all lesions (ten lesions, eight patients) being reclassified (p<0.01), nine from significant to non-significant (5.5% of all lesions and seven patients) and one from non-significant to significant (0.6% of all lesions, one patient). Compared with FFRstable, use of FFRCL resulted in 11.7% of all lesions being reclassified (p<0.01), all from significant to non-significant (19 lesions, 17 patients). These data are illustrated in Figure 4.
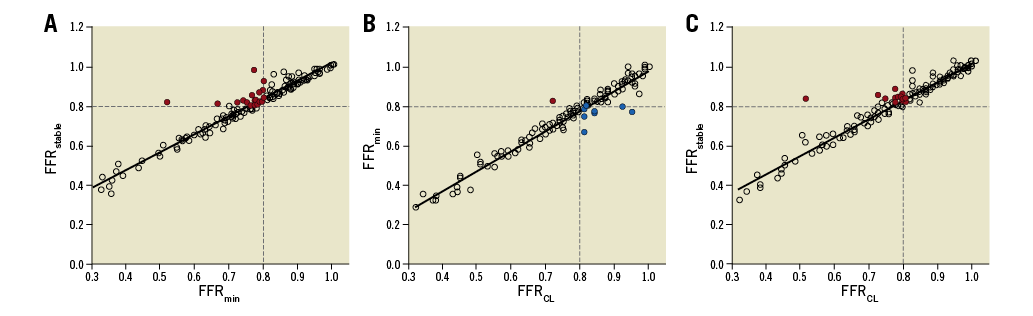
Figure 4. Scatter plots demonstrating the relationship between FFRmin, FFRstable and FFRCL. The coloured dots indicate lesions classified differently between the two measurement techniques. A) FFRmin vs. FFRstable. B) FFRCL vs. FFRmin. C) FFRCL vs. FFRstable. Coloured dots indicate lesions which crossed the threshold of physiological significance (≤0.80) and were reclassified as a result of the different methods. Red indicates cases changing from significant to non-significant and blue indicates cases moving from non-significant to significant.
RESPONSE TO ADENOSINE
Careful visual analysis of all cases demonstrated a lack of a truly stable hyperaemic phase in eleven cases (6.7% of all lesions, seven patients). In these cases, the Pd/Pa signal fell and then rose continually. The nature of the algorithm is such that it will always identify and report the most stable period of this signal as FFRstable. However, in view of this, we re-analysed the results with these cases excluded. The results were not significantly different. Mean FFRmin, FFRstable and FFRCL were 0.760 (0.16), 0.799 (0.15) and 0.776 (0.15), respectively (p<0.05 for all comparisons). With FFRmin, FFRstable and FFRCL as arbiter of physiological lesion classification, the number of significant lesions was 57.2%, 42.1% and 52.6%, respectively. Between-group reclassification of physiological significance was also similar, with <1% difference for all like-for-like comparisons.
TIME TO PEAK AND STABLE HYPERAEMIA
The mean time taken to reach FFRmin was 55 s (19) and the range was 17-131 s. The mean time taken to reach FFRstable was 69 s (18) and the range was 37-140 s.
Discussion
We have developed an algorithm that objectively identifies FFR during peak (FFRmin) and stable hyperaemic periods (FFRstable). The algorithm is based on a combination of simple filtering methods selected to highlight, in a repeatable and objective manner, the key characteristics of the hyperaemic response. The algorithm analysed all cases in less than two seconds and provided identical results with repeated analysis. FFRmin was consistently lower than FFRstable. Although the absolute difference was modest (0.76 for FFRmin vs. 0.81 for FFRstable), it was consistent, statistically significant and had a substantial impact on the classification of physiological lesion significance. Compared with FFRmin, when FFRstable was applied, 16.5% of all lesions were reclassified, all from significant to non-significant.
Our findings are important, given the role of FFR in guiding treatment decisions, especially in cases in which FFR is close to the decision threshold. The proportion of cases reclassified depends upon the number of cases in the group studied which are clustered near the 0.80 threshold. Our cases were selected on the basis of stenoses being 50-90% by visual analysis, not on being physiologically “borderline”, and are therefore realistic and applicable within real-world practice. The methods used are applicable to all commercially available pressure wires.
In contrast to other studies, we compared the operator-selected FFR (FFRCL) with the algorithm-derived results. FFRCL was higher than FFRmin but lower than FFRstable. Importantly, FFRCL classified lesions differently from both FFRmin and FFRstable. Compared with FFRCL, FFRstable resulted in 11.7% of lesions being reclassified, all from significant to non-significant. Compared with FFRCL, use of FFRmin resulted in 6.1% of all lesions being reclassified, mostly from non-significant to significant. In short, all three approaches result in discordant treatment guidance.
The FFR signal was not completely steady, even during “stable” hyperaemia. During stable hyperaemia, variability was small (CoV 2%) but was sufficient to introduce uncertainty into the interpretation of FFR, especially in cases close to the threshold. Variability was higher in some cases (>5% in 6% of cases). Variability was lower under baseline conditions (0.7%). Although FFR cannot be compared directly with iFR, this may reflect a more stable condition for physiological analysis6,13. Mean time to reach FFRmin and FFRstable was consistent with other published data8.
We are not the first group to highlight the difference between FFRmin and FFRstable6,10. Tarkin et al analysed Pd/Pa tracings, demonstrating a similar mean delta (+0.04) but with lower rates of lesion reclassification (9% vs. 16.5%). In a subsequent analysis, the same group demonstrated a smaller rise from FFRmin to FFRstable (+0.006) and a lower rate of lesion reclassification (2.9%). The authors supported the routine use of FFRstable as the “true” FFR. Neither paper separately quoted the operator-selected FFR. A study of 52 patients by Seto et al demonstrated variability in the Pd/Pa signal during FFR measurement7. They compared FFRmin to the highest subsequent Pd/Pa ratio recorded during the period of adenosine infusion. Although the methods are not directly comparable, they demonstrated a greater overall difference (+0.08) in FFR and a higher rate of lesion reclassification (28%). Johnson et al also used a mathematical algorithm to identify what they termed the “smart minimum” FFR to demonstrate the repeatability of FFR on consecutive invasive measurements8. Matsumura et al compared site-reported FFR with core laboratory analysis. A significant number of cases were excluded from the final analysis due to signal drift (17.5%), ventricularisation of the pressure signal (5.3%) and waveform distortion (4.0%). After exclusions, site-reported FFR differed from core laboratory analysis by +0.003 (±0.02), with Bland-Altman limits of agreement of ±0.04. Contrary to our study, neither analysis was algorithmic, and the study did not specifically analyse or compare the period of stable hyperaemia. Both studies, however, reinforce the need for a careful and consistent approach when analysing FFR. An algorithmic approach may aid this.
The principal advantage of FFR over visual CAG assessment is its objectivity. Our algorithm extends this, removing any remaining bias and/or subjectivity in interpretation and negating the need to “choose” the FFR. Even if there is microvascular dysfunction, with a blunting of Pd/Pa, our algorithm will still identify the nadir of the response and the most stable subsequent period. Given similar input data, the algorithm always returns the same result with zero intra- or inter-observer variability and is unaffected by variability in the FFR signal.
In the current study, we observed a variable Pd/Pa response during adenosine infusion. The lack of a predictable, stereotyped response has important implications for those seeking to develop predictive computational models of “virtual” FFR, because the accuracy of such models is heavily dependent upon assumptions made about the microvascular physiology which dictates the nature and magnitude of the hyperaemic response14. Moreover, the fact that subtle differences in how FFR was defined and assessed had such a significant impact on lesion classification means that it is unlikely that computational models will achieve 100% accuracy relative to a meticulously performed invasive measurement conforming to our algorithm.
In 2016, a group including the pioneers of FFR measurement published a manuscript aiming to standardise FFR measurement11. They suggested that FFR should be taken as “the level of the nadir of the Pd/Pa tracing” but emphasised the need for “manual control” and “fine-tuning” in order to mitigate the effects of artefact in either the coronary or the arterial pressure recordings. Also of relevance is the demonstration that the minimum Pd/Pa (FFRmin) achieved during intravenous infusion of adenosine shows good agreement with that achieved with the intracoronary administration of a bolus of adenosine, both measures being highly reproducible8. The current study does not resolve whether FFRmin or FFRstable should be considered the “true” FFR. Instead, we have demonstrated objectively that each approach results in different patterns of physiological classification. Moreover, the FFR selected by the operator results in a different pattern of lesion classification again. A consensus is required. Intuitively, the same measurement technique should be applied as was applied in the seminal trials which pioneered FFR and resulted in the currently applied threshold. Although recent guidance advises that the “nadir of the Pd/Pa tracing” should be used11, previous trials state that FFR was acquired during “steady-state hyperaemia”15, “maximal hyperaemia”16 and “adenosine-induced hyperaemia”5. There are merits for both approaches. Given the difficulty in identifying stable hyperaemia in some (6.7%) cases, even with an algorithmic approach, this study pragmatically supports the use of FFRmin.
Limitations
This study focused on patients undergoing FFR with intravenous adenosine as the hyperaemic stimulus because this is the commonest and most established method of evaluating physiological lesion severity in the cardiac catheterisation laboratory. Adenosine can also be given via an intracoronary route or alternative agents such as papaverine can be used. These alternative methods were not considered. This was a single-centre study. A larger multicentre trial would be needed to discover whether the effect on lesion reclassification is maintained.
Conclusions
We have shown that an algorithmic analysis simplifies interpretation of the FFR signal, eradicates variability and subjectivity, and provides a 100% objective result which may be useful in a standardised assessment of FFR. Differences in how FFR is defined and assessed significantly impact on the FFR result and the classification of physiological lesion significance.
| Impact on daily practice Subtle differences in how and when FFR is measured in the cardiac catheterisation laboratory have a significant impact on how lesions are classified physiologically. Variability may occur at the level of the system or the operator. Use of an automated algorithm eradicates variability and subjectivity and may be useful in a standardised assessment of FFR. |
Acknowledgements
The authors are grateful to Mrs Tina Hook (Sheffield Teaching Hospitals) for her help and expertise in ensuring absolute precision in our physiological data collection.
Funding
P.D. Morris and R. Gosling were funded by Research Training Fellowships (British Heart Foundation). P.D. Morris was subsequently funded by an NIHR Clinical Lectureship. M.I. Sciola was funded by a studentship from the Engineering and Physical Sciences Research Council. Clinical data were generated with support from the Wellcome Trust and Department of Health, UK (R/135171-11-1). The views expressed in this publication are those of the authors and not necessarily those of the funding bodies, NHS, the NIHR or the Department of Health.
Conflict of interest statement
The authors have no conflicts of interest to declare.