Abstract
Aims: The aim of this study was to explore the evolution of coronary lesions which had repeated physiologic evaluation by FFR as an endpoint, describe the clinical significance of longitudinal FFR change (ΔFFR=FFRfollow-up–FFRbaseline) and its correlation with angiographic indices, and identify predictors of FFRfollow-up.
Methods and results: A retrospective, single-centre analysis of 414 stenoses (331 patients) with consecutive FFR measurements at least six months apart was performed (median time interval: 24 [17, 37] months). The change in percent diameter stenosis was 2% (–5%, 11%). FFR values at baseline and follow-up were 0.86 (0.82, 0.90) and 0.83 (0.79, 0.90), respectively (<0.0001). The median ΔFFR was –0.007 (–0.028, 0.010) per year. Worsening FFR (ΔFFR <–0.05) was observed in 105 (25%) stenoses, stable FFR (–0.05 ≤ΔFFR ≤0.05) in 276 (67%) and improving FFR (ΔFFR >0.05) in 33 (8%) stenoses. The number of haemodynamically significant stenoses (FFR ≤0.80) was higher at follow-up compared to baseline (33% versus 17%, p<0.0001); ΔFFR correlated weakly with delta diameter stenosis (Δ%DS, ρ=–0.111, p=0.024). In mixed effects repeated measures analysis, only lesion location had an independent correlation with FFR values after adjusting for multiple confounders. In ROC analysis, FFRbaseline values predicted future clinically significant values (c-statistic: 0.736 [95% CI: 0.682–0.783]).
Conclusions: FFR values decrease slowly over a two-year follow-up. FFRbaseline, but not angiographic indices, is a predictor of significant functional atherosclerosis progression, predicting which stenoses will require revascularisation.
Abbreviations
%DS: percent diameter stenosis
CABG: coronary artery bypass grafting
FAME: Fractional Flow Reserve Versus Angiography for Multivessel Evaluation
FFR: fractional flow reserve
LAD: left anterior descending coronary artery
MACE: major adverse cardiovascular events
MLD: minimal luminal diameter
PCI: percutaneous coronary intervention
RD: reference diameter
ROC: receiver operating characteristic
Introduction
Intermediate stenoses are prevalent in patients undergoing angiography and are defined as a 30-70% luminal narrowing1. Nevertheless, a heterogeneity exists in the definition of clinically significant coronary stenoses depending on diagnostic tool or location. According to the European guidelines on myocardial revascularisation, only stenoses >50% in the presence of limiting angina/angina equivalent, unresponsive to medical therapy have an indication for revascularisation2. The American guidelines on stable angina define a significant stenosis as 70% diameter reduction, with the exception of the left main where 50% diameter reduction is the threshold3,4.
This scatter in defining the significance of stenoses is attributed to the limited ability of anatomic tools to predict the functional impact of lesions. The DEFER and FAME trials have established the superior role of functional stenosis assessment by measuring hyperaemic trans-stenotic pressure gradient (i.e., fractional flow reserve [FFR])5-8. Accordingly, guidelines recommend deferring revascularisation with FFR >0.80, irrespective of location and angiographic appearance due to very low event rates6,8-12.
This “watchful waiting” approach begs the question of how intermediate, non-revascularised lesions evolve over time, both anatomically and functionally. To date, there are abundant data regarding their anatomic progression that have shaped our understanding of their natural history1,13. The risk continuum between FFR and outcomes has been elucidated in a meta-analysis by Johnson et al. Decreasing FFR was linked to increased events, and patients derived greater benefit if they had lower baseline FFR9. We recently showed a significant, independent and non-linear association between functional severity of stenoses and risk of major adverse cardiovascular events (MACE) up to two years9. Yet, no data exist regarding the longitudinal functional progression of stenoses assessed by FFR. Our purpose was to explore the natural history of intermediate lesions by using FFR as endpoint, describe the significance of longitudinal FFR change and its correlation with angiographic indices, and identify the predictors of FFR at follow-up.
Methods
STUDY POPULATION
A retrospective analysis of our cath lab database was performed. Patients with at least two FFR measurements in the same vessel on two separate angiographies at least six months apart were identified. Vessels that were revascularised by percutaneous coronary intervention (PCI) and/or coronary artery bypass grafting (CABG) in between the two FFR measurements were excluded. Patients with PCI and/or CABG prior to the first FFR measurement, or revascularisation at a non-index vessel were retained. Demographics and medication usage were retrieved from patient files. All patients gave written informed consent for angiography/FFR and use of anonymised data for research purposes, according to local institutional practice.
ANGIOGRAPHY AND FFR MEASUREMENTS
Percent diameter stenosis (%DS), reference diameter (RD) and minimal luminal diameter (MLD) were routinely calculated by quantitative coronary angiography. FFR was measured with a 0.014” pressure sensor guidewire (PressureWire™ Certus™ or PressureWire™ Aeris™; St. Jude Medical, St. Paul, MN, USA)14. After equalisation to guide catheter pressure, the guidewire was advanced to the target artery. For hyperaemia, adenosine was administered intravenously at 140 μg/kg/min or intracoronary as a 200 μg bolus in the left coronary artery or 100 μg in the right coronary artery. Simultaneous measurement of the mean proximal pressure with the guide catheter and the mean distal pressure with the guidewire was performed. FFR was the ratio of the mean distal to proximal hyperaemic pressure.
STATISTICAL ANALYSIS
FFR change was defined as ΔFFR=FFRfollow-up-FFRbaseline and the rate of change as ΔFFR/time interval in years. Percent change in FFR was defined as %ΔFFR=100 * (FFRfollow-up-FFRbaseline)/FFRbaseline. Lesions had worsening FFR if ΔFFR was <–0.05, stable FFR if –0.05 ≤ΔFFR ≤0.05 and improving FFR if ΔFFR was >0.05. The ±0.05 margin was chosen despite excellent test-retest FFR reproducibility to offset the effect of different operators and modes of adenosine administration15. Lesions with FFR ≤0.80 were clinically significant. %DS and MLD changes and rates of change per year were similarly calculated.
Categorical variables are presented as counts and percentages and continuous variables as mean±SD or median (25th-75th value) according to the Shapiro-Wilk test. Continuous variables were compared with the t-test, Mann-Whitney test, Wilcoxon matched-pairs test or Kruskal-Wallis test followed by Dunn’s correction for multiple comparisons where appropriate. Categorical variables were compared with the chi-square or Fisher’s test. Correlation between continuous variables was examined by the Spearman’s ρ correlation coefficient.
In order to examine whether lesions with PCI performed before the FFR measurements had a different rate of FFR change compared to non-revascularised lesions, the ΔFFR rate for the two groups was compared. To account for correlation within patients of lesions in an unbalanced design, mixed effects repeated measures models with maximum likelihood and an independent covariance structure (Stata mixed command) were used. FFR and %DS were the dependent variables; time interval between measurements (months), lesion location (left main, left anterior descending artery, left circumflex artery or right coronary artery), smoking, arterial hypertension, diabetes mellitus, dyslipidaemia, previous PCI before measurements, previous PCI at index segment and previous CABG before measurements were covariates and individual patients were the random component. Receiver operating characteristic (ROC) analyses were performed to compare the ability of FFRbaseline and %DSbaseline to predict functionally significant lesions at follow-up (FFRfollow-up ≤0.80). In order to explore whether FFR changes at a different rate according to baseline values, the cohort was split into three groups (Group 1 with FFRbaseline values between 0.70 and 0.79, Group 2 with FFRbaseline values between 0.80 and 0.89 and Group 3 with FFRbaseline values between 0.90 and 1.00) and the respective rates of FFR change (ΔFFR/year) were compared.
Non-linear regression with locally weighted scatterplot smoothing (LOWESS) for correlations of ΔFFR/year and FFRbaseline was used.
Analyses were performed with Stata 13 (StataCorp, College Station, TX, USA) and GraphPad Prism 7 (GraphPad Software, San Diego, CA, USA). Two-tailed p-values <0.05 were statistically significant.
Results
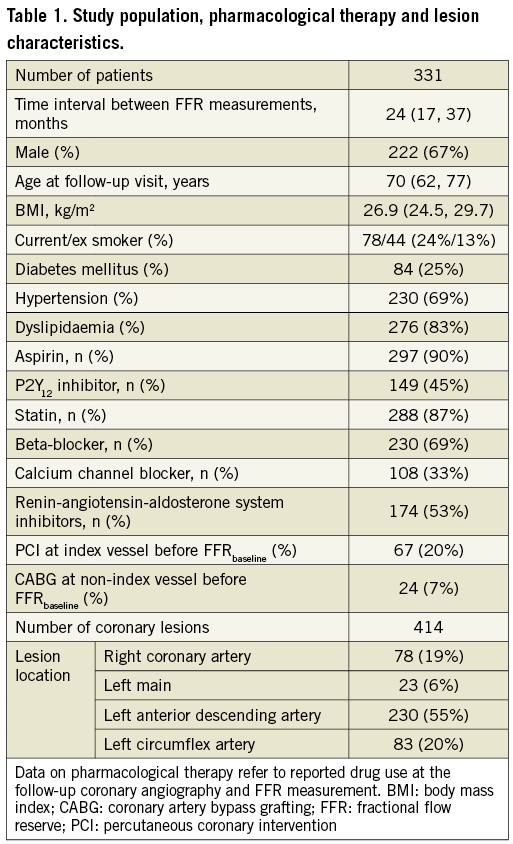
We analysed 414 lesions from 331 patients with a time interval between the FFR measurements of 24 (17, 37) months. The study population, pharmacological therapy and lesion characteristics are presented in Table 1.
At follow-up, FFR values were significantly lower compared to baseline (p<0.0001 for both the Wilcoxon matched-pairs test and the mixed effects repeated measures model), the ΔFFR was –0.015 (–0.06, 0.02) and the ΔFFR rate of change was –0.007 (–0.028, 0.010) per year. A significant linear correlation of FFRfollow-up with FFRbaseline was noted (ρ=0.550, p<0.0001); this was also the case on a per vessel analysis (Figure 1). The %ΔFFR was –1.7% (–6.4%, 2.3%).
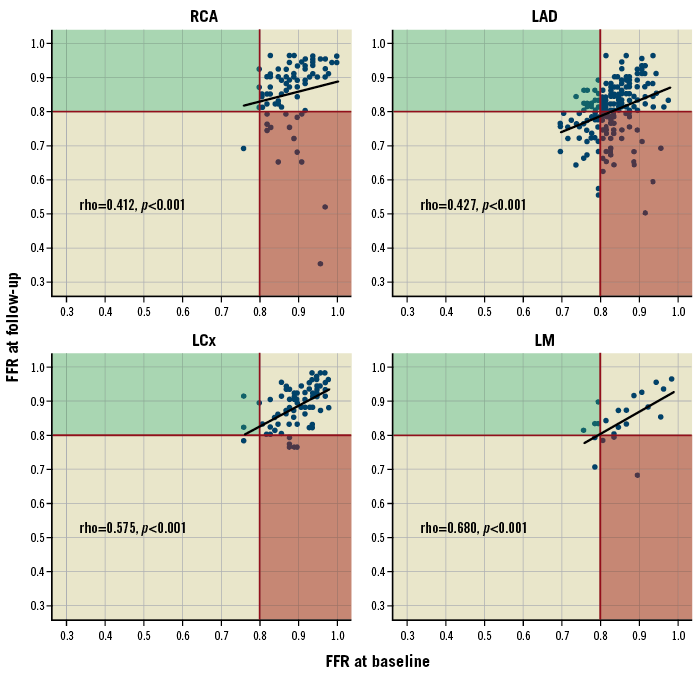
Figure 1. Scatter plot and correlations of FFR values at baseline and follow-up on a per vessel basis. The black line depicts the 0.8 FFR threshold below which a lesion is clinically significant and should be revascularised. The red area includes lesions that were non-ischaemic at baseline and became ischaemic at follow-up (FFR deterioration); the opposite is true for lesions in the green area (FFR improvement). Non-parametric Spearman’s ρ correlation coefficients are presented. FFR: fractional flow reserve
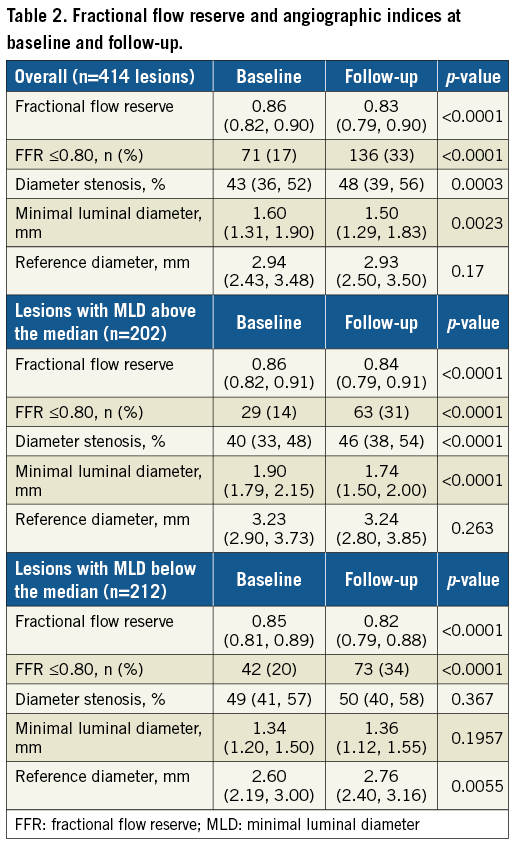
Similar results were noted for %DS and MLD, with lower values at follow-up (p<0.0001 for both the Wilcoxon matched-pairs test and the mixed effects repeated measures model), while RD remained unchanged; the deterioration of angiographic indices was mainly driven by lesions that had an above the median baseline MLD (Table 2). Rates of change for %DS were 1 (–2, 5) % and for MLD –0.012 (–0.175, 0.080) mm/year.
Worsening FFR was observed in 105 (25.4%) lesions, stable FFR in 276 (66.7%) lesions and improving FFR in 33 (7.9%) lesions. The number of significant lesions (i.e., FFR ≤0.80) was higher at follow-up compared to baseline (17.4% versus 32.9%, χ2=26.29, p<0.0001). In the subgroup of lesions with baseline FFR ≤0.80, worsening FFR was observed in 12 (16.9%) stenoses.
Similarly, the number of lesions with >50% DS increased over time (33.5% at baseline versus 47.5% at follow-up, χ2=16.20, p<0.001). A weak correlation of ΔFFR with Δ%DS was observed (ρ=–0.111, p=0.024); the correlations between ΔFFR with ΔMLD and ΔRD were not significant (ρ=0.013, p=0.789 and ρ=–0.04, p=0.379, respectively).
The rate of FFR change between lesions that had been previously revascularised by PCI (PCI before the first FFR measurement, n=93) was similar to lesions that had not been subjected to PCI in the past (n=321) (–0.005 [–0.025, 0.010] versus –0.010 [–0.035, 0.011], respectively, p=0.688).
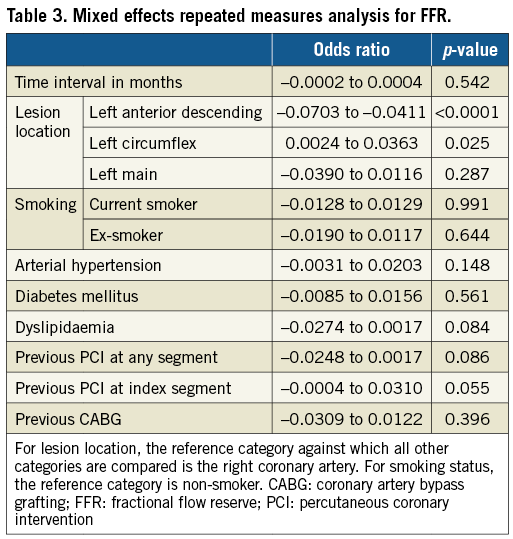
In the mixed effects repeated measures analysis, only lesion location had an independent correlation with FFR values after adjusting for multiple confounders (Table 3).
In ROC analyses, the c-statistic for FFRbaseline was 0.736, indicating a fair accuracy for FFRbaseline to detect functionally significant lesions at follow-up. This was not the case for %DSbaseline, since its ROC curve did not differ from the line of no discrimination (c-statistic: 0.507) (Figure 2).
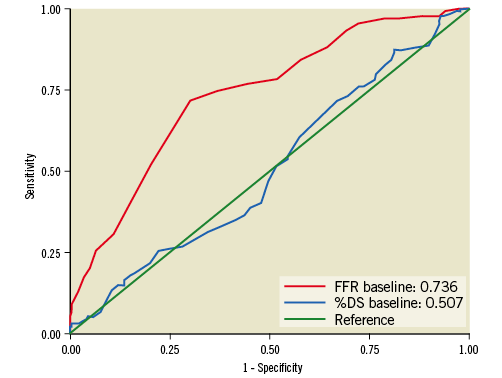
Figure 2. Receiver operating characteristic (ROC) curves for FFRbaseline and %DSbaseline to predict functionally significant lesions at follow-up (i.e., FFRfollow-up ≤0.80). %DS: percentage diameter stenosis; FFR: fractional flow reserve
The rate of FFR change was not uniform across stenoses. Figure 3 presents the correlations of ΔFFR/year with FFRbaseline on a per vessel basis using locally weighted regression. The stenoses with higher FFRbaseline values deteriorated more rapidly as compared to those with lower FFRbaseline values. The rates of change for stenoses with FFRbaseline 0.70-0.79, 0.80-0.89 and 0.90-1.00 were 0.010 (–0.011, 0.022), –0.005 (–0.026, 0.010) and –0.018 (–0.035, 0.013), respectively, with p=0.0001 for the Kruskal-Wallis test (Figure 4).
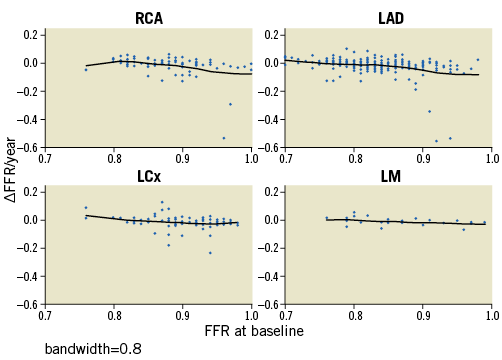
Figure 3. Non-linear regression with locally weighted scatterplot smoothing (LOWESS) plots for correlations of ΔFFR/year and FFRbaseline. A smoothing parameter (bandwidth) of 0.8 was used for local fit, i.e., 80% of data points were considered during local regression. The black line represents the line of best fit. Negative values of ΔFFR/year signify FFR deterioration; positive values signify improvement. FFR: fractional flow reserve; ΔFFR: FFRfollow-up-FFRbaseline
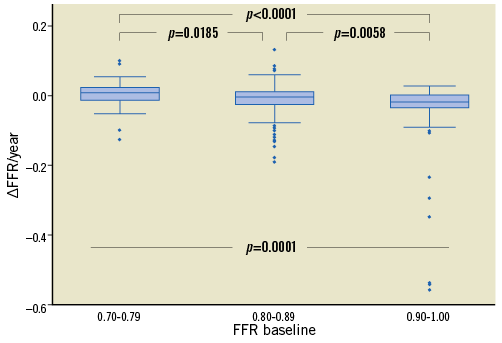
Figure 4. Box plots for the rate of FFR change (ΔFFR/year) across groups of FFRbaseline values. The presented p-values have been adjusted for multiple comparisons. FFR: fractional flow reserve
Discussion
This is the first study to examine the longitudinal progression of lesions from a physiologic standpoint. The main finding is that, on average, FFR regressed at a slow rate and, as a consequence, only one out of four lesions had a significant FFR worsening over a two-year period. These results should be considered hypothesis-generating, keeping in mind that patients who had FFR measurement only on one occasion could not be included in analyses (selection bias). It is plausible that the actual FFR progression rate might be slower.
FFR AND CLINICAL OUTCOMES
Indirect evidence regarding the slow FFR decline can be derived from the FAME 2 trial, where patients with FFR >0.80 in all stenoses were enrolled in a registry and received optimal medical therapy. Of the 166 patients (241 lesions) included in the registry cohort, five (3.0%) had at least one primary endpoint event7. In a sub-analysis of the trial, FFR between 0.91 and 1.00 portended a lower risk of MACE than FFR between 0.81 and 0.909. This risk of MACE steeply increased between FFR values of 0.80 and 0.60, and plateaued for FFR values below 0.60.
Similar to our findings, a retrospective analysis of stenoses in which intervention was deferred based on FFR reported an intervention rate of 18% at four years16. Taken together, these point to a low event rate from lesions with non-significant baseline FFR, that can be attributed to a slow progression of disease and longitudinal decline in FFR8,16.
FFR AND FUNCTIONAL ATHEROSCLEROSIS PROGRESSION
The slow FFR decline in our cohort was paralleled by a slow increase in angiographic severity. This is in keeping with studies reporting a low percentage of non-significant lesions at baseline progressing to significant stenoses.
Despite the similar slow deterioration in FFR and %DS, these should not be used interchangeably to gauge clinical information. This is reflected in the weak, albeit statistically significant, correlation of their rates of change. In addition, many lesions were misclassified as being “significant” by angiographic criteria, both at baseline and at follow-up. Several lines of evidence, including a meta-analysis of >9,000 patients, have solidified the continuous and independent relationship of FFR with outcomes and highlighted the shortcomings of angiography9,17.
The finding that the ΔFFR rate of change is similar for lesions with past PCIs and PCI-naïve lesions is intriguing. In-stent neoatherosclerosis progresses in parallel with native atherosclerosis and similar pathophysiological mechanisms possibly underpin the two processes18-20.
PREDICTORS OF FFR AT FOLLOW-UP
In ROC analysis, FFRbaseline demonstrated an above average discriminatory ability for significant lesions at follow-up. This is intrinsically linked to the slow temporal progression of FFR and can be useful in the context of forgoing repeat angiographies for patients with stable symptoms and high baseline FFR.
Lesion location was an independent predictor of FFRfollow-up. The faster functional atherosclerosis progression observed with LAD stenoses is intriguing and deserves further investigation. From a practical standpoint, our data suggest systemically re-assessing intermediate LAD lesions with FFR on the occasion of a repeat angiogram. The overall slow functional progression explains the weak association between time interval and FFR worsening at the follow-up.
Finally, the fact that lesions improved their FFR over time merits attention in spite of there being few. In part, this can be attributed to the effect of optimal medical treatment on plaque regression21,22. Indeed, the use of statins was remarkably frequent in our population, along with other classes of drug (including renin-angiotensin-aldosterone system inhibitors and calcium channel blockers) that have anti-atherosclerotic effects.
RATE OF FFR CHANGE
The finding that the rate of FFR change is not uniform for all lesions but differs according to their baseline warrants attention. Interestingly, it is the lesions with the higher FFRbaseline that deteriorate faster. Such a seemingly paradoxical result may partly be explained by intensification of medical therapy between the two measurements and recruitment of collaterals for the perfusion of myocardial areas served by a main vessel with impaired FFR23. The slower deterioration, halt, or even reversal of FFR decline in diseased vessels with low FFR values merits further investigation.
Limitations
A number of limitations should be taken into account when interpreting the results of this retrospective, single-centre study. Attrition bias, partly in the form of survival bias, is the major shortcoming; only lesions that did not evolve to cause an acute coronary syndrome were included in the analysis24. Moreover, FFR was not measured routinely for every lesion, but according to the physician’s judgement. Therefore, angiographically non-significant lesions could have escaped FFR evaluation; conversely, angiographically significant lesions at follow-up could have been revascularised without measuring FFR. Owing to its retrospective nature, the study did not include patients with baseline FFR who were subsequently asymptomatic. Their inclusion would be required to describe the natural history of FFR evolution; in such a case, the rate of FFR change would presumably be even slower than in our study. In addition, the inclusion of previously stented lesions creates a heterogenous population. Importantly, our population consisted of patients with stable angina; results should not be extrapolated to different settings, as they are not representative of the natural history of unselected intermediate coronary stenoses.
QCA was performed at the worst angiographic projections for each stenosis, but not by a core lab.
Our study population included patients who had had past PCIs at the index vessel and/or segment, as well as patients who had PCI at a non-index vessel between the baseline and follow-up revascularisations. Their inclusion may have been counterintuitive, since it clouds the picture of the natural progression of atherosclerosis. Nonetheless, it reflects real-world practice, where patients who have been revascularised in the past frequently undergo repeat angiographies.
Conclusions
The findings of our study point to a slow progression rate for coronary atherosclerotic lesions, as evaluated by angiography and FFR. Longitudinal data regarding FFR evolution are presented for the first time, with only one out of four lesions having a significant FFR worsening over a two-year period. FFRbaseline, but not angiographic indices, is an independent predictor of longitudinal functional atherosclerosis progression, predicting which lesions will require revascularisation.
| Impact on daily practice FFR regresses at a slow rate (median ΔFFR rate: 0.007/year). As a consequence, only one out of four lesions that are non-significant at baseline (i.e., FFR >0.80) will progress to be functionally significant over a two-year period and thus require revascularisation. This finding can be clinically useful in the context of forgoing repeat angiographies for patients with persistent symptoms and high baseline FFR. This is a frequent clinical scenario, despite lack of endorsement for serial angiographic evaluation by guidelines. Physicians can predict whether a lesion will functionally deteriorate if its baseline FFR is low and/or it is located at the LAD. |
Funding
P. Xaplanteris is supported by research grants from the European Association of Percutaneous Cardiovascular Interventions (EAPCI) and the Hellenic Cardiological Society (HCS). M. Pellicano is supported by a research grant provided by the CardioPath PhD programme.
Conflict of interest statement
B. De Bruyne and E. Barbato report that their institution receives consultancy fees on their behalf from St. Jude Medical, Opsens, and Boston Scientific. The other authors have no conflicts of interest to declare.