Abstract
Aims: To evaluate the classification agreement between instantaneous wave-free ratio (iFR) and fractional flow reserve (FFR) in patients with angiographic intermediate coronary stenoses.
Methods and results: Three hundred and twelve patients (339 stenoses) with angiographically intermediate stenoses were included in this international clinical registry. The iFR was calculated using fully automated algorithms. The receiver operating characteristic (ROC) curve was used to identify the iFR optimal cut-point corresponding to FFR 0.8. The classification agreement of coronary stenoses as significant or non-significant was established between iFR and FFR and between repeated FFR measurements for each 0.05 quantile of FFR values, from 0.2 to 1. Close agreement was observed between iFR and FFR (area under ROC curve= 86%). The optimal iFR cut-off (for an FFR of 0.80) was 0.89. After adjustment for the intrinsic variability of FFR, the classification agreement (accuracy) between iFR and FFR was 94%. Amongst the stenoses classified as non-significant by iFR (>0.89) and as significant by FFR (≤0.8), 81% had associated FFR values located within the FFR “grey-zone” (0.75-0.8) and 41% within the 0.79-0.80 FFR range.
Conclusions: In a population of intermediate coronary stenoses, the classification agreement between iFR and FFR is excellent and similar to that of repeated FFR measurements in the same sample. Vasodilator-independent assessment of intermediate stenosis seems applicable and may foster adoption of coronary physiology in the catheterisation laboratory.
Introduction
Instantaneous wave-free ratio (iFR) is a recently proposed invasive pressure-derived index of coronary stenosis severity. It differs from fractional flow reserve (FFR) as it does not require the administration of vasodilators for its calculation. iFR is calculated from trans-stenotic pressure measurements as the ratio of distal to proximal coronary pressures during a specific wave-free period of the cardiac cycle, when microvascular resistance is intrinsically stable and minimised1.
The physiological foundations of iFR and its diagnostic efficiency in identifying FFR-significant stenoses have been recently reported in the ADVISE study1. As a validation study, ADVISE evaluated iFR’s performance across a broad range of coronary stenosis severities, which included tight and mild coronary narrowings, in the same line as pioneering studies of FFR2-4. However, in everyday practice, and in agreement with clinical practice guideline recommendations5-7, functional intracoronary assessment of stenosis severity is predominantly used to interrogate intermediate stenoses with unclear severity. A critical difference of these two scenarios is that, in clinical evaluation of angiographically intermediate stenoses, FFR values tend to be distributed closer to the 0.80 established cut-off. It is likely that these differences in frequency distribution of stenosis severity could influence the intrinsic agreement between repeated FFR measurements and the overall agreement between iFR and FFR on classifying coronary stenoses8-10 (Figure 1).
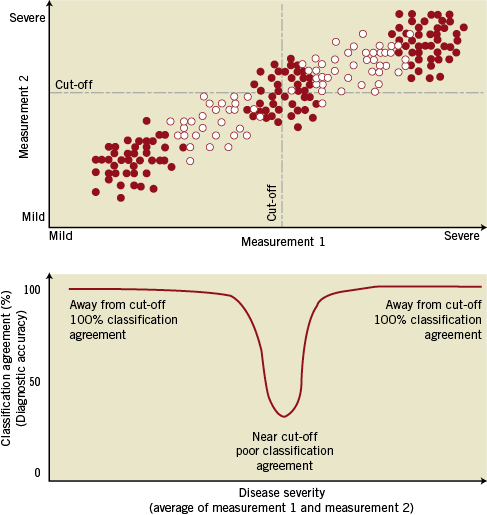
Figure 1. Agreement between two measurements depends on the data distribution. The level of agreement between two measurements –when they are both “significant” or “non-significant” – will vary within each range of disease severity (from mild to severe), depending on how close the data points are to the established cut-off (clusters of red dots). The overall agreement between them (the overall diagnostic accuracy) will therefore be influenced by the data distribution of the sample and depend on the proportional number of data points away from/close to diagnostic cut-off.
In the present study we evaluated the level of agreement between iFR and FFR in a cohort of patients with intermediate coronary stenoses investigated with pressure guidewires as part of their clinical assessment. The agreement between iFR and FFR was interpreted in light of the intrinsic variability of FFR, and the underlying characteristics of FFR data distribution encountered in this registry.
Methods
iFR AND FFR DATA FROM THIS CLINICAL REGISTRY
iFR REGISTRY STUDY POPULATION
The study included 312 patients with 339 coronary stenoses that, as part of clinical management, required functional intracoronary assessment with pressure guidewires at three large European tertiary cardiac centres (Hospital Clínico San Carlos in Madrid, Spain; Guy’s and St Thomas’ NHS Foundation Trust, London; and the Academic Health Science System of Imperial College London, UK). Anatomical severity of coronary stenoses was measured using quantitative coronary angiography (QCA).
HAEMODYNAMIC DATA COLLECTION AND ANALYSIS
Acquisition of physiological data for FFR calculation was performed according to conventional practice5 using commercially available FFR systems (RadiView console and PressureWire Certus, St. Jude Medical, Minneapolis, MN, USA; and Combomap console and Prestige pressure guidewire, Volcano Corporation, San Diego, CA, USA). Adenosine was used for the calculation of FFR; in 98% of the cases it was administered via a central line, with doses ranging from 140 mcg/Kg/min to 200 mcg/Kg/min; in the remaining 2% of the cases the intracoronary route was used. Digital data was extracted from FFR console platforms and processed off-line in a core laboratory (International Centre for Circulatory Health, National Heart and Lung Institute, London, UK) using a custom software package with Matlab (Mathworks, Inc., Natick, MA, USA) as described elsewhere1. It was possible to calculate iFR in all cases, using fully automated algorithms applied to the wave-free period over a minimum of five beats, before adenosine administration, as previously described1 (Figure 2).
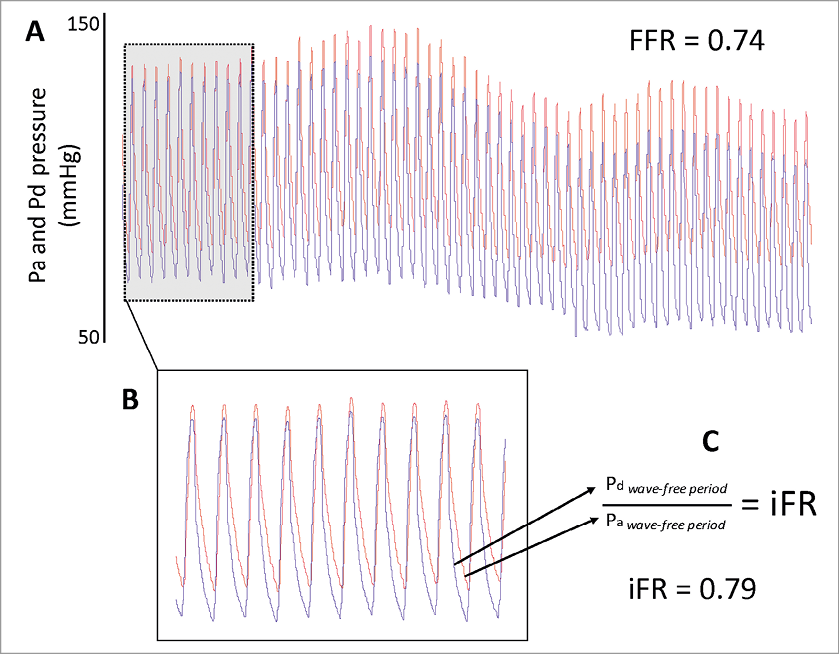
Figure 2. Calculation of iFR. Stored digital FFR traces (A) from 312 consecutive patients were retrieved (n=339). Using an automated off-line algorithm, a period of resting trace preceding adenosine administration was identified (B). The coronary distal-to-proximal pressure ratio during the wave-free period was used for calculation of iFR (C)1.
FFR INTRINSIC VARIABILITY DATA FROM LANDMARK FFR REPRODUCIBILITY STUDY
The FFR reproducibility data from the DEFER study11 was obtained from a previously published scientific statement on physiological assessment of coronary stenoses from the American Heart Association, containing the correlation between two consecutive FFR measurements within 10 minutes in 325 selected subjects5. Data were digitised using semi-automatic bitmap-to-digital software (Matlab; Mathworks, Inc.).
STEPS FOR ESTABLISHING THE OVERALL CLASSIFICATION AGREEMENT BETWEEN iFR AND FFR
For the purpose of general understanding of our methodology, we have schematically divided this study into five steps, as summarised in the flowchart presented in Figure 3.
The first step was to identify the optimal iFR cut-off (Step 1, Figure 3): A receiver-operating characteristic (ROC) curve was applied to this iFR registry to identify the optimal iFR cut-off value to agree with an FFR of 0.8. Next, the FFR repeatability agreement was assessed (Step 2, Figure 3) using data from the DEFER reproducibility study. Mean FFR values were divided in 0.05 quantiles, from 0.2 to 1, and the agreement (diagnostic accuracy) between the first and second FFR measurements calculated in each quantile. Agreement between FFR values was considered when both FFR values were below (or equal to) or above the established cut-off of 0.80. Next, the agreement between iFR and FFR was assessed (Step 3, Figure 3) using data from this iFR registry, applying the same method to that described in Step 2. Then, the overall level of agreement (total diagnostic accuracy) between iFR and FFR and between repeated measurements of FFR was calculated for the sample of this clinical registry (Step 4, Figure 3). For both iFR-FFR and FFR-FFR relationships, the total agreement was calculated by multiplying the agreement in each 0.05 quantile (from Steps 2 and 3) by the percentage of data points in each 0.05 quantile encountered in this registry. Finally, an estimation of the overall iFR-FFR agreement and FFR repeatability agreement in different populations was performed using the same methodology applied in Step 4 to estimate the overall level of agreement (total diagnostic accuracy) between iFR and FFR and between repeated measurements of FFR in different samples, from previous validation studies of iFR and FFR (Step 5, Figure 3). The frequency distribution of FFR values in the ADVISE trial, FFR reproducibility study and the landmark study which validated FFR against positron emission tomography (PET) were obtained from their original publications1,3,5.
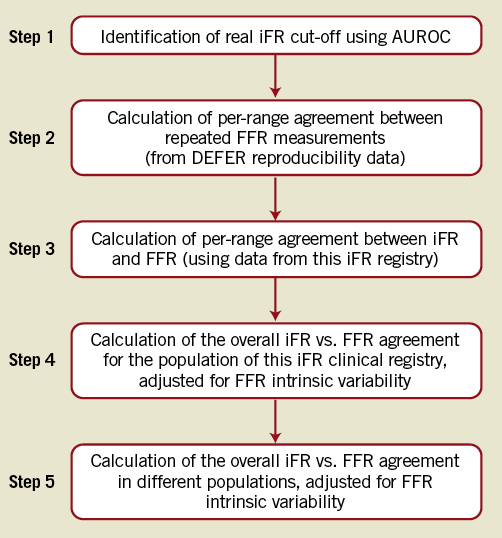
Figure 3. Study flowchart.
STATISTICAL ANALYSIS
Statistical calculations were performed using Matlab (Mathworks, Inc.) and STATA version 11 (StataCorp, College Station, TX, USA). The Hartigan’s Dip Test was used to test for unimodality for the samples of this clinical iFR registry, the FFR reproducibility study and the ADVISE study. The Hartigan’s Dip Test could not be applied to the FFR study against PET due to insufficient data points across the entire range of FFR values. The areas under ROC curves were compared using a nonparametric method12.
Results
PATIENT CHARACTERISTICS OF THIS CLINICAL iFR REGISTRY
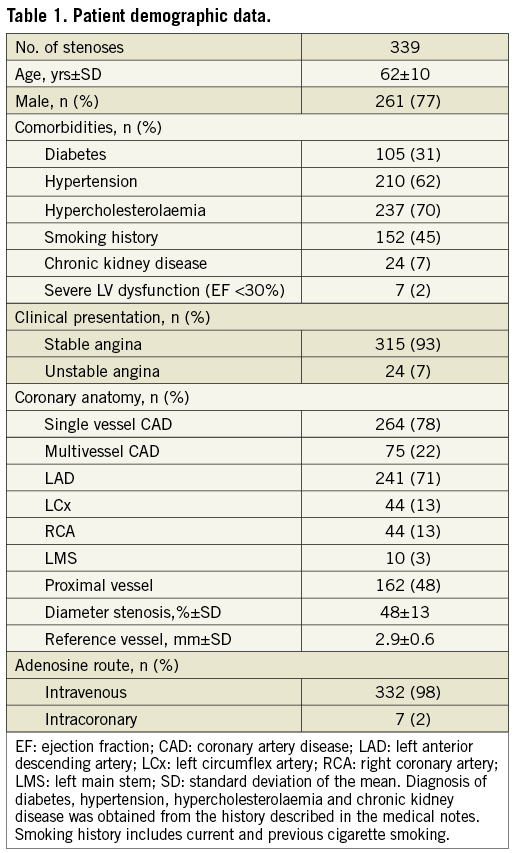
Demographic, clinical and angiographic data of the iFR registry population are shown in Table 1. The mean diameter stenosis was 48% (standard deviation 13%), indicating a predominantly intermediate anatomical stenosis grade. The interrogated stenoses were located most frequently in the left anterior descending artery (71%). The vast majority of patients presented with stable symptoms; in 7% of cases, the pressure guidewire was used to interrogate non-culprit stenoses in the context of an acute coronary event. There were no complications related to pressure guidewire interrogation of the stenoses. Analysis of the registry data revealed a unimodal distribution of FFR values with mean 0.81 (standard deviation 0.09) and median 0.82, with a preponderance of intermediate physiological severity: 71% of FFR values fell between 0.7 and 0.9 and only 10% were <0.7. The Hartigan’s Dip Test confirmed the unimodality of the data (dip test=0.027, p=0.1).
IDENTIFICATION OF OPTIMAL iFR CUT-OFF
To match an FFR value of 0.8, the ROC curve identified an optimal iFR cut-off value of 0.89. The area under the ROC curve for iFR was 0.86 (Figure 4), whilst for mean resting Pd/Pa was 0.80 (p=0.01). For an FFR value of 0.75, the ROC curve identified an optimal iFR cut-off value of 0.83.
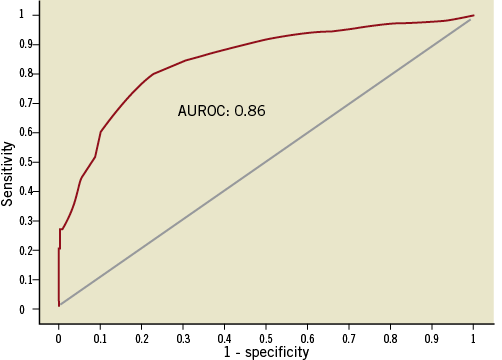
Figure 4. Area under receiver-operating characteristic curve (ROC). Classification agreement between iFR and FFR in this clinical iFR registry, demonstrated using the area under the receiver-operating characteristic curve (FFR cut-off 0.8). The optimal iFR cut-off identified for the population of this study was 0.89.
ASSESSMENT OF THE AGREEMENT BETWEEN iFR AND FFR AFTER ACCOUNTING FOR THE INTRINSIC VARIABILITY OF FFR
PER-RANGE CLASSIFICATION AGREEMENT BETWEEN REPEATED FFR MEASUREMENTS
The FFR reproducibility study reveals the classification agreement between the first and second FFR measurements (the ability of both measurements to classify a lesion as significant or not based on a 0.8 cut-off). This repeatability agreement is shown in Figure 5 for each 0.05 quantile of the disease spectrum. In general, the ability of the first FFR measurement to agree with the classification of the second FFR measurement was strong across almost the whole range of disease. However, close to its established 0.80 cut-off, the FFR repeatability agreement fell, reaching a nadir of around 50%. Overall, for the population of this clinical iFR registry, the level of classification agreement between repeated FFR measurements was 85%.
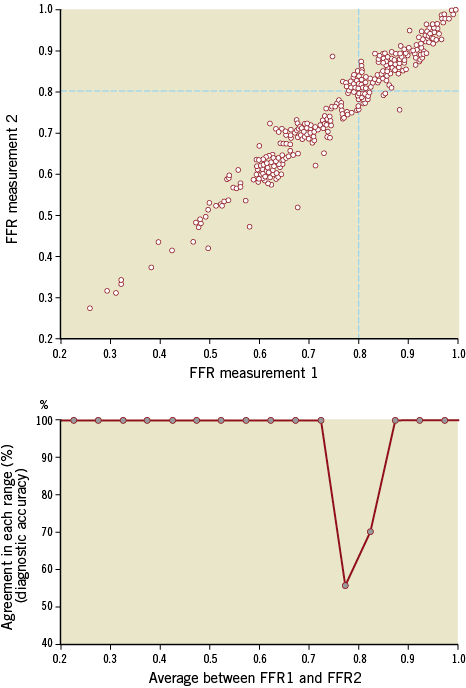
Figure 5. Per-range agreement between repeated measurements of FFR. The top panel is a scatter plot of two repeated FFR measurements, taken 10 minutes apart, digitised from reference 5. Bottom panel reveals the level of agreement (“diagnostic accuracy”) between the two measurements for each quantile of disease (from 0.2 to 1 in bands of 0.05). At extremes, agreement is excellent (100%). Close to the established cut-off, however, FFR starts to disagree with itself, with its intrinsic accuracy falling to approximately 55%. Grey dots in bottom panel mark the centre of each 0.05 quantile. Agreement between FFR values was considered when both FFR values were below (or equal to) or above the established cut-off of 0.80.
PER-RANGE CLASSIFICATION AGREEMENT BETWEEN iFR AND FFR
The classification agreement between iFR and FFR (their ability both to classify a lesion as significant or not based on a 0.89 and 0.8 cut-off, respectively) is shown in Figure 6 for each 0.05 quantile of the disease spectrum. iFR-FFR categorisation agreement followed a similar pattern to the agreement of repeated measurements of FFR. iFR agreement with FFR was strong (100%) across almost the whole range of disease, except for the zone around their established cut-off where intrinsic FFR-FFR classification agreement was also lowest. Overall, for the population of this clinical iFR registry, the level of classification agreement between iFR and FFR was 80%.
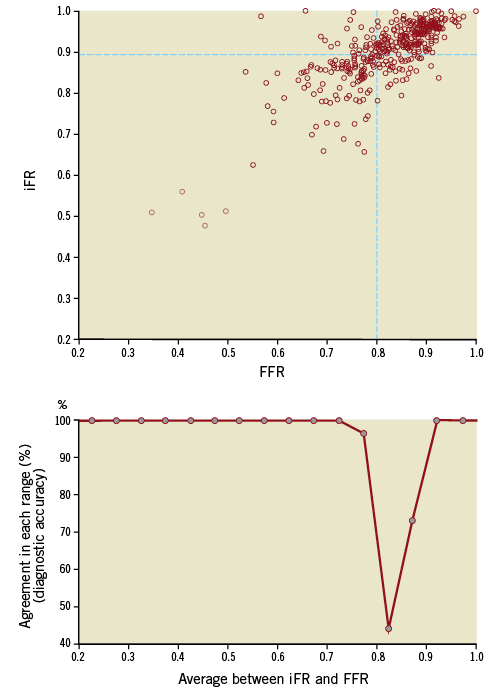
Figure 6. Per-range agreement between iFR and FFR. The top panel is the scatter plot of iFR and FFR values from this clinical iFR registry. Bottom panel reveals the level of agreement (“diagnostic accuracy”) between the iFR and FFR for each range of disease (from 0.2 to 1 in bands of 0.05). At extremes, agreement is excellent (100%). Close to their established cut-offs, however, iFR-FFR classification agreement falls significantly. Grey dots in bottom panel mark the centre of each 0.05 quantile. Agreement between iFR and FFR values was considered when both tests were below (or equal to) or above their established cut-off.
OVERALL AGREEMENT BETWEEN iFR AND FFR IN THIS CLINICAL REGISTRY
When the intrinsic variability of FFR is taken into account, the overall level of classification agreement between iFR and FFR in this registry population is 94% (80% observed iFR-FFR agreement as a fraction of the 85% FFR repeatability agreement) (Figure 8A). Amongst the stenoses classified as non-significant by iFR (>0.89) and as significant by FFR (≤0.8), 81% had associated FFR values located within the FFR “grey-zone” (0.75-0.8) and 41% within the 0.79-0.80 FFR range.
OVERALL AGREEMENT BETWEEN iFR AND FFR ACROSS DIFFERENT POPULATIONS
To assess the agreement between repeated FFR measurements and between iFR and FFR in populations with different distributions of FFR values, comparisons were made for the samples of the ADVISE study, the FFR reproducibility study and the FFR-PET study, using the same methodology as applied to this clinical registry. The population characteristics of these studies are summarised in Table 2 and their frequency distribution of FFR values is presented in Figure 7, with a comparison histogram of this clinical iFR registry. The overall level of classification agreement between iFR and FFR in these studies is presented in Table 2 and Figure 8B, Figure 8C and Figure 8D. The magnitude of agreement between repeated FFR measurements and between iFR and FFR changes significantly depending on the underlying population studied. However, across all different samples, when the intrinsic variability of FFR is taken into account, iFR accuracy is almost identical, ranging from 94% to 96% (Table 2).

Discussion
The present study finds an excellent classification agreement between iFR and FFR in a registry population that is formed by coronary stenoses with predominantly intermediate physiological and angiographic severities, the most frequent clinical context of FFR use. The agreement between iFR and FFR was analysed taking into account the intrinsic variability of repeated FFR measurements (from DEFER) in the same population. We have also found that the close relationship between iFR and FFR is maintained across populations with different distributions of FFR values, such as in previous validation studies of FFR and iFR. The overall agreement between iFR and FFR mirrors the agreement between repeated FFR measurements and varies significantly depending on the type of population being studied. However, for multiple types of population distribution, if the intrinsic variability of FFR is accounted for, iFR accuracy ranges from 94% to 96%.
iFR AND FFR: CONTINUOUS VARIABLES INTERPRETED DICHOTOMOUSLY
Despite the pressure gradient across a coronary stenosis being a continuous variable, assessment of stenosis severity with FFR is interpreted dichotomously (“significant” versus “non-significant”). One of the consequences of comparing two techniques that use dichotomous classification based on continuous values, such as FFR and iFR, is that the classification agreement between measurements will decrease when the values studied are close to the established cut-off (i.e., 0.8 for FFR). This concept, which is schematically depicted in Figure 1, is valid for comparisons between techniques (iFR versus FFR) and, as we found in this present study, also affects the repeatability performance of an index (repeated FFR measurements). For instance, a small difference between measurements near the FFR cut-off value of 0.80 (for example, 0.79 versus 0.81) will have a direct effect on the stenosis classification. The same absolute difference in measurements when encountered away from the cut-point (for example 0.50 versus 0.52, or 0.95 versus 0.97) will have no impact on the classification of a lesion. Figure 5 illustrates how the agreement between two repeated FFR measurements decreases around its established cut-off value. This observation is of paramount importance, since comparisons against FFR (newly proposed modalities such as iFR or even established techniques such as intravascular ultrasound) cannot, on average, perform better than FFR would perform against itself13. This phenomenon also demonstrates that, despite contrary belief14, a coronary pressure index sometimes can lie –even to itself.
EFFECTS OF DATA DISTRIBUTION ON OVERALL AGREEMENT BETWEEN iFR AND FFR
As a consequence of the above phenomenon, the frequency distribution of values in any study population has a major influence on the overall classification agreement between tests. Direct comparison of the overall percentage agreement (total accuracy) between tests is therefore only valid when applied to samples with the same type of data distribution. To circumnavigate this we applied a method which allows the overall agreement between iFR and FFR to be estimated in any type of data distribution and interpreted in the context of FFR intrinsic variability in the same sample. First, we demonstrated that within each quantile of physiological disease severity, the agreement between iFR and FFR follows a similar pattern to the intrinsic or intra-technique agreement of FFR (Figure 5 and Figure 6). Subsequently, we calculated the overall agreement (or total accuracy) between iFR and FFR and the overall self-agreement (intrinsic accuracy) between repeated FFR measurements for the population encountered in this clinical registry. Finally, we extended this analysis to other populations, with different distributions of FFR values and demonstrated that iFR and FFR have a level of agreement which is as close as the FFR intrinsic agreement, when comparisons are made in the same type of population (Table 2 and Figure 8).
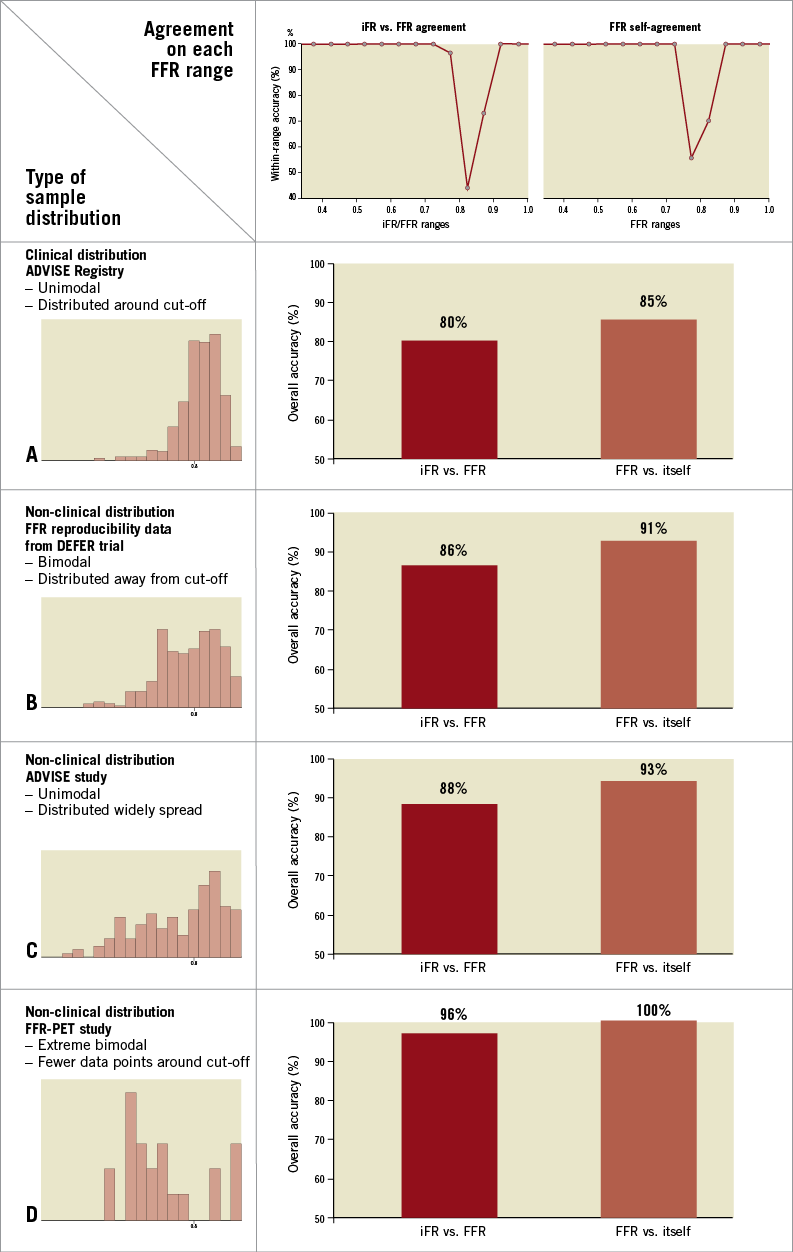
Figure 8. Overall classification agreement between iFR and FFR. Top panels are the per-range agreement charts (from Figure 5 and Figure 6) for iFR versus FFR (left) and repeated FFR measurements (right). The overall level of agreement (or total accuracy) between iFR and FFR and the intrinsic agreement of FFR are derived for different types of data distribution (left histograms, from Figure 7). In clinical samples such as this iFR registry (A), where values are distributed unimodally around the cut-off point, both iFR-FFR and FFR-FFR level of agreement are lower than those observed in samples where data are distributed bimodally, away from the cut-off area (B and D) or more widely (C). Agreement was considered when both tests were below (or equal to) or above their established cut-offs.
iFR PERFORMANCE IN A REPRESENTATIVE CLINICAL POPULATION
iFR was first tested as a diagnostic index in the ADVISE study. Being a methodological validation study, the main aim of ADVISE was to test iFR performance using FFR as a reference, over a wide range of stenosis severity. Indeed, 41% of the patients in ADVISE had FFR values <0.7. This pattern of distribution, with an almost equal proportion of significant and non-significant stenoses, is a common feature of validation studies, including those which compared FFR against invasive coronary flow2, non-invasive functional tests4 and positron emission tomography3. The ADVISE study documented a high level of agreement between iFR and FFR, setting the foundations of iFR as a coronary diagnostic modality.
This registry constitutes a second step in the validation of iFR, applied in this occasion to a clinically representative population of individuals undergoing coronary physiological assessment in the catheter laboratory. Although one of the messages arising from the FAME study15 was that even angiographically severe stenoses may have an associated FFR >0.80, most physicians currently limit the use FFR to the evaluation of angiographically intermediate stenoses, in agreement with the recommendation made by clinical practice guidelines5-7. This attitude is reflected in the characteristics of clinical cohorts, formed predominantly by physiologically intermediate stenoses. In the case of this clinical iFR registry the distribution of FFR data revealed that most FFR values (81%) fell between 0.60 and 0.90 (Figure 7), a pattern consistently shown in data from the three participating institutions. In this population of physiologically intermediate coronary stenoses, iFR maintained excellent classification agreement with FFR.
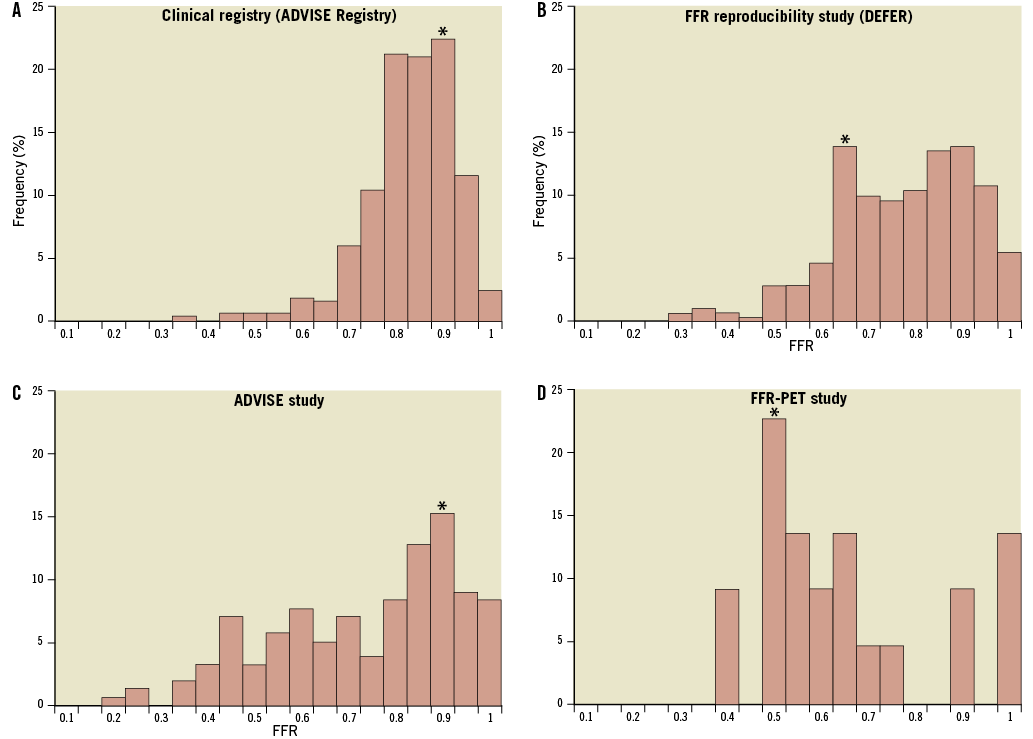
Figure 7. Distribution of data in this clinical iFR registry, ADVISE study, FFR reproducibility study and FFR-PET validation study. Frequency histograms reveal the unimodal type of data distribution of this clinical iFR registry, with predominantly higher FFR values (A). This contrasts with the bimodal pattern of data distribution observed in the FFR reproducibility study5 (B); the more widely spread data seen in the ADVISE study1 (C); and with the extreme type of distribution from the study which validated FFR against PET (D). These contrasts highlight the differences between the study populations of methodological validation studies and patients undergoing routine coronary physiological assessment in clinical practice included in this iFR registry. Each bar represents one 0.05 FFR quantile and the symbol (*) identifies the most frequent FFR quantile in each population.
THE EFFECTS OF DATA DISTRIBUTION ON THE OPTIMAL iFR CUT-OFF
In this clinical iFR registry, the optimal established cut-off value for iFR to identify stenoses with FFR of 0.80 was 0.89. This value is higher than the 0.83 optimal iFR cut-off observed in the ADVISE study but similar to the one observed in other studies comparing iFR and FFR in clinical populations16. As these cut-offs were identified using receiver-operating characteristic curves, accurate determination is highly dependent on adequate powering around the cut-off. As this iFR registry had the majority of its lesions in the intermediate zone (81%), it is both reflective of the population in which such physiological assessments are routinely made, and is well powered to explore the iFR cut-off best reflecting FFR 0.8. Therefore, the iFR 0.89 cut-off represents the value of iFR which will more often agree with dichotomous classification of stenoses by FFR in clinical populations, and can therefore be considered the best iFR cut-off to identify 0.8 FFR stenoses in clinical practice.
CLINICAL IMPLICATIONS OF OUR FINDINGS
Supported by multiple clinical studies demonstrating the benefits of physiology-guided revascularisation, FFR utilisation has expanded significantly over recent years and has culminated in recent proposals of interrogating every suitable stenosis, irrespective of its angiographic severity11,15,17. However, FFR is performed in only 6% of all coronary intervention procedures in the United States6. Undoubtedly, the need for adenosine administration is a contributor to this low adoption rate. As iFR is a pressure-derived index which does not require adenosine administration for its calculation, it is an attractive tool for the interventionalist, since it may simplify even further the utilisation of coronary physiology in the cardiac catheterisation laboratory. The idea of adenosine-free interrogation of coronary stenoses is also supported by recent demonstration that resting coronary haemodynamics can be used to infer the physiological significance of coronary lesions18.
FUTURE DIRECTIONS FOR iFR IMPLEMENTATION IN CLINICAL PRACTICE
The agreement between iFR and FFR observed in this clinical iFR registry is of similar magnitude than the accuracy of FFR to detect myocardial ischaemia in clinical populations, reported in a meta-analysis as 77%19. Additionally, in 81% of the cases in which iFR values were above cut-point and FFR was below cut-point, the FFR values fell within the “grey-zone” of (0.75-0.80), which further demonstrates their close relationship. At present, it is unknown, in situations when iFR and FFR classification disagree, which index correctly identify flow-limiting lesions. This uncertainty, however, cannot be resolved from studies which only compare iFR with FFR, such as ADVISE or this iFR registry. For such clarification, iFR and FFR need to be directly compared to perfusion modalities –either invasively using coronary flow or non-invasively with positron emission tomography or perfusion magnetic resonance imaging. Importantly, as the present study highlights, such direct comparisons should be carried out in representative clinical populations, predominantly made of intermediate stenoses.
Finally, as iFR can simply be calculated from digitised coronary pressure traces, the unique opportunity exists for the analysis of pre-existing studies with outcome data such as FAME or FAME II. This would overcome the ethical dilemmas of repeating such studies and would facilitate the introduction of iFR into clinical practice, potentially leading to improved adoption of physiological assessment in the catheter laboratory.
DATA DISTRIBUTION OF FUTURE iFR AND FFR STUDIES WITH CLINICAL OUTCOMES
We believe that our results highlight the foremost importance of knowing the type of data distribution when quoting the overall performance of diagnostic tests such as accuracy and predictive values. For a valid interpretation of the meaningfulness of study results, we suggest that future trials, especially those evaluating clinical endpoints11,20 such as the FAME II study, present their data distribution for universal comparison.
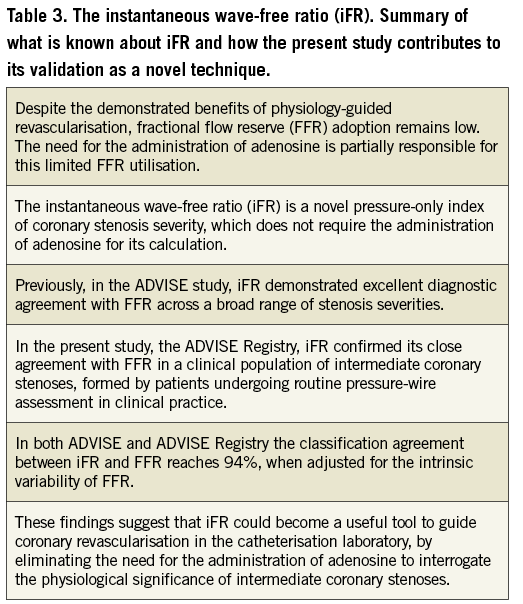
Table 3 summarises how our study findings add to the current understanding of iFR and what is currently known about the technique.
LIMITATIONS
Our study has limitations. The investigators had no control over the technique for measuring FFR across all three institutions. The recording of each FFR trace was performed relying solely on the clinicians’ expertise, which could potentially increase the chance for measuring error. However, this real-life method of data collection helps to strengthen the external validity of our results and its interpretation directly into clinical practice.
This registry included patients in whom FFR was performed using either intravenous (98%) or intracoronary (2%) routes. Whilst differences in methodology may introduce theoretical differences between the groups, these differences are small, and reflect the real-world assessment practices of the institutions in the study.
Finally, iFR was compared to FFR within the same digital pressure trace, whilst the FFR intrinsic variability was established in repeated FFR measurements, 10 minutes apart. It is unknown whether this time delay could influence the iFR-FFR relationship. iFR reproducibility studies are ongoing and will help clarify this discussion.
Conclusions
iFR demonstrated a high level of classification agreement with FFR in a large group of patients with intermediate coronary stenoses, typical of individuals undergoing cardiac catheterisation and invasive coronary physiological assessment. The agreement between iFR and FFR mirrors the intrinsic agreement of repeated FFR measurements when the same sample is being studied.
Funding
This study was funded by the National Institute for Health Research (NIHR) and Imperial College Healthcare NHS Trust Biomedical Research Centre. R. Petraco (FS/11/46/28861), J.E. Davies (FS/05/006), D.P. Francis (FS 04/079) and K.N. Asrress (FS/11/43/28760) are British Heart Foundation fellows. S. Sen (G1000357) and S. Nijjer (G1100443) are Medical Research Council fellows. C. Di Mario is a senior NIHR investigator.
Conflict of interest statement
J.E. Davies and J. Mayet hold patents pertaining to this technology, which is under licence to Volcano Corporation. J. E. Davies is a consultant for Volcano Corporation. The other authors have no conflicts of interest to declare.
