Abstract
Aims: The aim of this study was to develop a simplified model of FFR calculation (FFRsim) derived from three-dimensional (3D) coronary angiographic data and classic fluid dynamic equations without using finite element analysis.
Methods and results: Intracoronary pressure measurements were performed by pressure wire sensors. The lumens of the interrogated vessel segments were reconstructed in 3D. The coronary artery volumetric flow was calculated based on the velocity of the contrast material. Pressure gradients were computed by classic fluid dynamic equations. The diagnostic power of the simplified computation of the FFR (FFRsim) was assessed by comparing the results with standard invasive FFR measurements (FFRmeas) in 68 vessels with a single stenosis. We found a strong correlation between the FFRsim and the FFRmeas (r=0.86, p<0.0001). The sensitivity and specificity for predicting the abnormal FFR of ≤0.80 (indicating haemodynamically significant stenosis) were 90% and 100%, respectively. The area under the curve (AUC) was 0.96. To achieve 100% negative and positive predictive values we defined the FFRsim >0.88 and the FFRsim ≤0.8 ranges. In our patient population, these ranges were found in 69% of the cases.
Conclusions: According to our simplified model, the invasive FFR measurement can be omitted without misclassification in pre-specified ranges of the calculated FFRsim.
Abbreviations
3D: three-dimensional
AUC: area under the curve
CFD: computational fluid dynamic(s)
DS: diameter stenosis
FFR: fractional flow reserve
GTN: glyceryl trinitrate
IVUS: intravascular ultrasound
MLA: minimal lumen area
OCT: optical coherence tomography
QCA: quantitative coronary angiography
Introduction
Despite the strong recommendation (class I, level A) in the current guidelines for fractional flow reserve (FFR) assessment of angiographically intermediate coronary artery disease in the absence of evident ischaemia, a low adoption rate of this method has been documented1. Numerous reports have been published on assessing the ability of the imaging techniques to predict the functional significance of a coronary stenosis, including three-dimensional (3D) angiography2,3, intravascular ultrasound (IVUS)4,5, optical coherence tomography (OCT)5 and coronary computed tomographic angiography (CCTA)6. Fluid dynamic computation (CFD) of the pressure gradient has also been proposed recently for calculation of the virtual FFR by using the Navier-Stokes equations from both non-invasive7,8 and invasive coronary angiography9,10. However, this technique requires a special numerical method called finite element analysis (FEA) for solving problems by subdividing a large problem into simpler parts (i.e., finite elements). The special software package necessary for these calculations is one limitation of its broad availability. In addition to the methods referred to above, other results of extensive research from the past decades have contributed to the optimal treatment of coronary artery patients in the catheterisation laboratory11; however, even today various questions remain unanswered.
Our aim in the current study was to develop a simplified model to calculate FFR using anatomical data from 3D coronary angiography with contrast velocity measurement and classic fluid dynamic equations.
Methods
We investigated 64 patients with intermediate severity epicardial coronary artery disease and without visible collaterals from four centres undergoing coronary angiography and FFR measurement. This was a retrospective evaluation of the results of the FARAO study (Investigation of the Fractional Flow Reserve and the Presence of Collaterals during AdministRation of Adenosin and COntrast Material) (Cardiologia Hungarica. 2014. https://www.doki.net/tarsasag/kardiologia/upload/kardiologia/magazine/1_TarBalazs.pdf?web_id=8D342826388CAE0). Patients presented with stable angina and angiographically intermediate epicardial coronary artery disease (40-70% diameter stenosis) in a main branch of the coronary system with a diameter >2 mm. Bypass grafts, chronic total occlusions, bifurcation lesions, ostial stenoses and left main (LM) disease were excluded from the analysis.
CORONARY ANGIOGRAPHY AND FRACTIONAL FLOW RESERVE MEASUREMENT
Diagnostic angiographic pictures were recorded using standard fluoroscopic views on an AXIOM Artis X-ray device (Siemens Healthineers, Erlangen, Germany). Contrast dye was injected in 5 ml fractions with a speed of 3 ml/sec using the ACIST CVi® Injection System (ACIST Medical Systems, Eden Prairie, MN, USA). If a coronary lesion was deemed intermediate during visual assessment (40-70% diameter stenosis), then FFR measurement was performed using a RadiAnalyzer™ device (St. Jude Medical, St. Paul, MN, USA) and a pressure-sensor guidewire (PressureWire™ Certus™; St. Jude Medical). After calibrating the wire, pressures were equalised with the sensor positioned at the tip of the catheter. After administering intracoronary (ic.) glyceryl trinitrate (GTN) and flush of saline, the resting pressure curve was recorded. Then, 150-200 µg of ic. adenosine was administered, followed by the contrast injection (Supplementary Figure 1). To document the exact position of the pressure sensor during the measurement, the angiography was immediately recorded at the time of peak hyperaemia. These images were also used for the calculation of the coronary flow velocity by detecting the frame count until the contrast material reached the sensor. In all cases, measurements were performed approximately 2 cm below the coronary stenosis. If the FFRmeas was ≤0.80, then the coronary lesion was considered haemodynamically significant and percutaneous coronary intervention (PCI) was performed.
THREE-DIMENSIONAL QUANTITATIVE CORONARY RECONSTRUCTION
Following invasive measurements, 3D angiographic reconstructions were performed offline, using dedicated software (QAngio® XA Research Edition 1.0; Medis specials bv, Leiden, the Netherlands). During reconstructions, two angiographic recordings of good quality, with at least 25° difference in angle, were used. We modelled the interrogated vessel segment in 3D, starting from the coronary orifice to the level of the pressure wire sensor.
The software used for 3D reconstruction is commercially available. Our model required 3D imaging to acquire highly accurate anatomical data. Nonetheless, similar software from other manufacturers is also applicable. FFRsim values were calculated from the corresponding data of the precise anatomical reconstruction.
COMPUTATION OF FRACTIONAL FLOW RESERVE
FLOW EQUATIONS
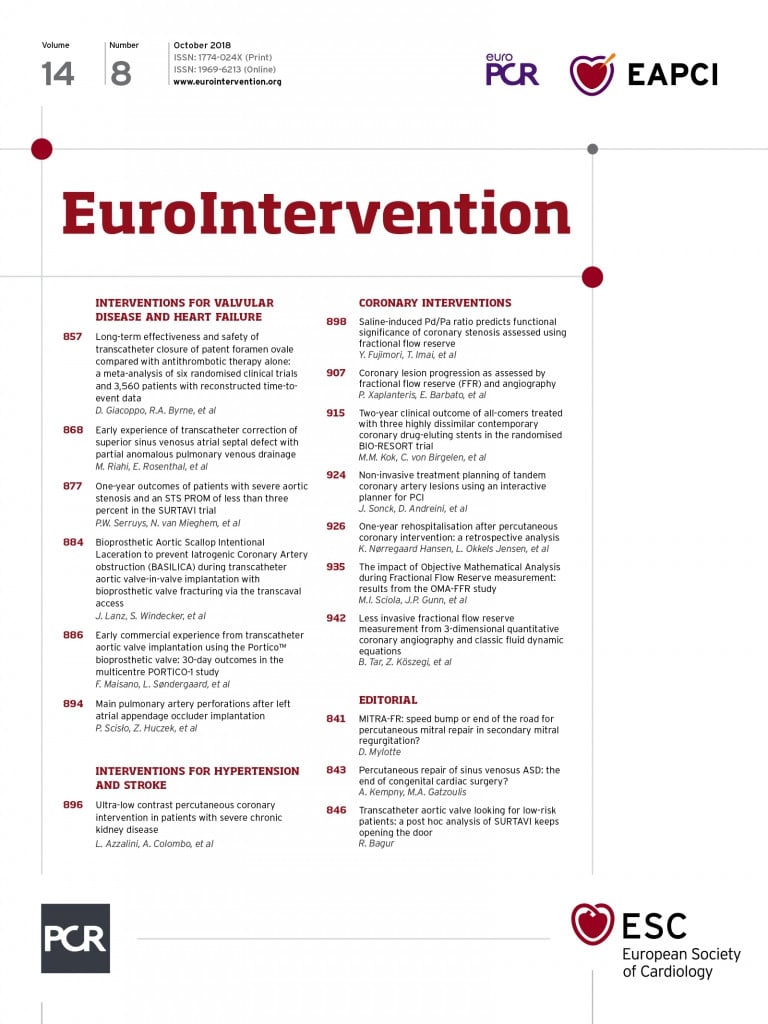
FFR can be calculated from the overall pressure drop across the vessel measured at the level of the pressure wire sensor, provided that the arterial pressure is known. Efforts have previously been made to determine the pressure drop in a coronary artery stenosis with simple equations describing fluid flow. These have been compared to direct pressure measurements and flow data in experimental animal models12,13 and human studies14-17. During our estimations, we used the simplified equation characterising the circumvented stenosis in the following form (Figure 1).
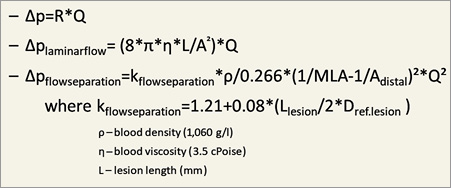
Figure 1. The applied fluid dynamics equations. The morphological data (Adistal, Alesion, Llesion, L) derived from 3D coronary angiography. To assess volumetric flow (Q), we used an averaged flow velocity. ∆p: pressure gradient; Q: volumetric flow; R: resistance
ANATOMICAL MODEL
During our calculations we applied the following anatomical model utilising data from 3D reconstruction (Figure 2).
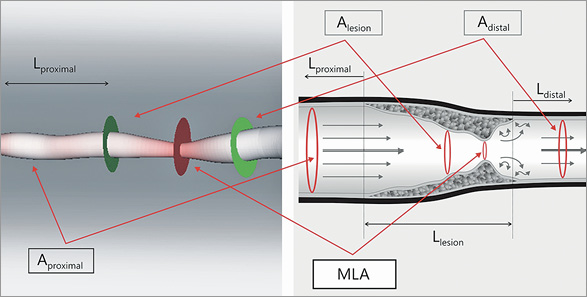
Figure 2. 3D reconstruction and the model of the studied coronary segment. We used the following anatomical parameters to solve fluid dynamic equations. Aproximal: mean area of the proximal part of the coronary artery (from the beginning of the reconstructed vessel to the stenotic segment); Alesion: mean area of the stenosis; MLA: minimal lumen area; Adistal: mean area of the distal part of the studied artery (from the end of the stenosis to the pressure wire sensor); Lproximal: length of the proximal segment; Llesion: length of the stenosis; Ldistal: length of the distal part of the vessel
VOLUMETRIC FLOW DETERMINATION
To assess volumetric flow (Q), we used an average flow velocity. Blood flow velocity was assumed identical proximal and distal to the stenosis during the time of peak vasodilatation. Volumetric flow was calculated from the average velocity of the contrast dye during maximal vasodilation. This velocity was determined from the distance travelled by the contrast material and its transport time.
Flow of the contrast material has been examined by the TIMI frame count method for a while now18. The number of frames between given anatomical landmarks can be used for the characterisation of flow. In order to define “distance” (scontrast) in our model, we used the distal pressure sensor position as a reference endpoint for the measurement of the contrast velocity. The exact length of the vessel segment was determined with the help of 3D reconstruction. Time (t) necessary for travelling a given distance was calculated from the frame rate (15-30 frames/sec) and the number of frames (TIMIframenumber) displaying contrast flow in the vessel:
tcontrast = TIMIframenumber × 1/15-30 sec
We applied a standard 3 ml/sec volumetric speed during the administration of the contrast medium. Flow velocity of the contrast blood, i.e., average flow velocity of the blood in the artery was defined as:
vcontrast = scontrast /tcontrast
The average velocity and the mean cross-sectional area of a given vessel segment were applied for calculating the average volumetric flow necessary for solving flow equations. We also took into account the different flow distribution present in the proximal and the distal part of the vessel. To this end, we determined the average cross-sectional area for the proximal and the distal segments separately. In addition to providing the minimal lumen diameter, minimal lumen area, reference diameter and area, as well as other morphological parameters, the 3D reconstruction software is also capable of calculating the average cross-sectional area of a vessel segment of given length. Thus, it does not require an additional step in the calculation.
The volumetric flow calculations are carried out using the standard equations:
Qprox = vcontrast average × Aproximal average
Qdist = vcontrast average × Adistal average
This concept applies the assumption of the constant mean velocity (vaverage) in the target epicardial coronary segment. As side branches are taking off, the volumetric flow rate (Q) will decrease proportionally with the decrease of the cross-sectional area of the distal reference segment (Adistal average)19.
We demonstrate the algorithm in a representative case (Figure 3).
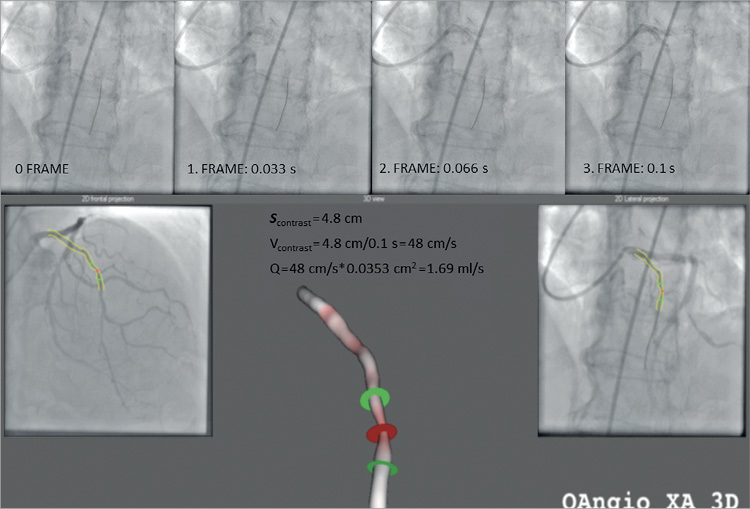
Figure 3. Calculation of volumetric flow (Q) from contrast material flow time and 3D distance. Q: volumetric flow of blood; scontrast: travelled distance of contrast material from 3D reconstruction; vcontrast: average velocity of contrast dye
DETERMINING THE CALCULATED FFR (FFRsim)
Following the substitution of the parameters derived as described in sections I-III into simple flow equations, we calculated the overall pressure drop across the lesion to the level of the pressure wire sensor. By subtracting the pressure drop from the mean arterial pressure (pa), we determined the calculated distal mean arterial pressure (pd). The FFRsim was calculated based on the known formula as follows (Figure 4):
FFRsim = pd/pa
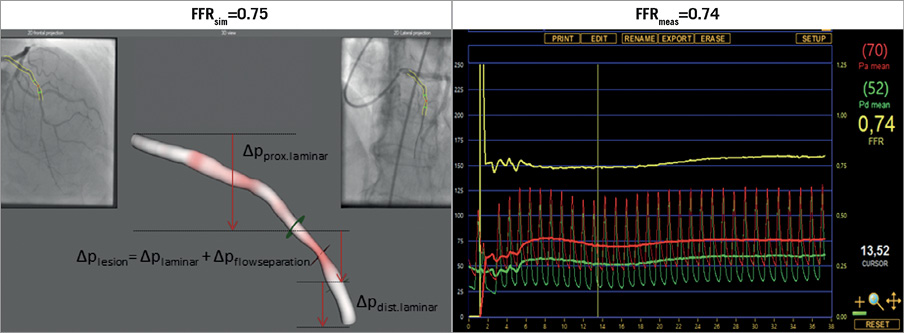
Figure 4. Calculated and measured FFR values. FFRmeas: measured fractional flow reserve; FFRsim: calculated fractional flow reserve; ∆pdist.laminar: pressure drop in the distal part of the vessel; ∆pflowseparation: pressure gradient because of the flow separation at the exit of the stenosis; ∆plaminar: pressure drop because of laminar flow; ∆plesion: pressure gradient of the stenotic lesion; ∆pprox.laminar: pressure drop in the proximal segment of the studied coronary artery
TIME NECESSARY FOR RECONSTRUCTION AND CALCULATIONS
Following the selection of the two runs that characterise the lesion well, the proposed procedure is only prolonged by the time necessary for the 3D reconstruction process, as pressure gradients can be instantaneously calculated from the simple equations based on some morphological data. The 3D reconstruction process may be carried out in approximately 3 minutes by a practised examiner, so the method we propose may be considered a truly prompt tool readily available for the interventional cardiologist right next to the operating table. The reading of the frame counts during vasodilatation from the moment the contrast dye enters the target vessel segment till it reaches the distal reference endpoint of the same segment requires approximately one minute.
STATISTICAL ANALYSIS
Continuous variables were expressed as mean (±SD), if normally distributed, or as median (with an interquartile range), in cases of non-normal distribution. Categorical variables were expressed as percentages. The correlation between FFRsim and FFRmeas was examined by Spearman’s correlation. Agreement between FFRsim and FFRmeas was assessed by Bland-Altman analysis. The area under the curve (AUC) by receiver operating characteristic (ROC) analysis was used to assess the diagnostic power of FFRsim. We used the Microsoft Excel for Windows programme (Microsoft Corporation, Redmond, WA, USA) for the calculation of FFR, and the MedCalc Statistical Software, Version 14.8.1 (MedCalc Software bvba, Ostend, Belgium) for statistical analysis.
Results
BASELINE CLINICAL AND LESION CHARACTERISTICS
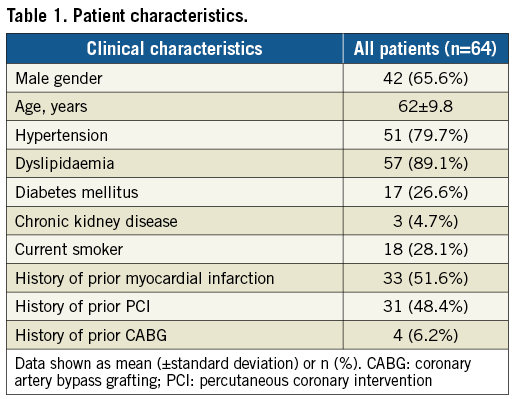
A total of 68 lesions with intermediate stenoses from 64 patients were investigated; 51.6% of patients had a history of prior myocardial infarction and 48.4% had a prior revascularisation procedure. We examined 68 vessels (44 LAD, 18 Cx/OM and 6 RCA). Mean maximal percent diameter stenosis (DS%), percent area stenosis (AS%) and minimal lumen area (MLA) by 3D-QCA were 46%, 71% and 1.98 cm², respectively. Patient characteristics are presented in Table 1.
CORRELATION AND AGREEMENT BETWEEN FFRsim AND FFRmeas
Following normality test, rank correlation analysis was performed. A strong correlation between FFRsim and FFRmeas was found: r (rho)=0.86 (p<0.0001) (Figure 5). With regard to the measured parameters, the Bland-Altman analysis also showed good agreement with a mean difference of -0.01±0.08 (p=0.579) (Figure 6).
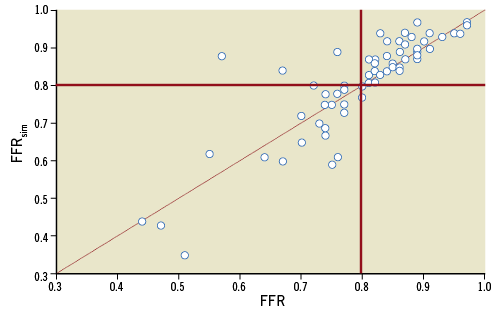
Figure 5. Correlation between FFRmeas and FFRsim. There was strong correlation between calculated and measured FFR values (r=0.86). The red lines indicate the diagnostic cut-off point of FFR (0.8).
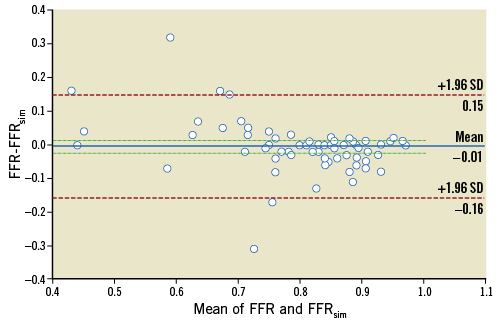
Figure 6. The Bland-Altman plot for the agreement between FFRmeas and FFRsim showing a mean difference of –0.01 (solid line). The dashed lines represent the values at mean±2SD.
DIAGNOSTIC POWER OF FFRsim FOR IDENTFYING HAEMODYNAMICALLY SIGNIFICANT STENOSES
The diagnostic power of the simplified computation of the FFR (FFRsim) was assessed by comparing the results with standard invasive FFR measurements (FFRmeas). Based on ROC curve analysis, the sensitivity and specificity were 90% and 100%, respectively, for predicting the abnormal FFR of ≤0.80 associated with haemodynamically significant stenoses. Positive and negative predictive values of FFRsim were calculated as 100% and 92.7%, respectively. The AUC was 0.96 (95% CI: 0.91-1).
To achieve 100% negative and positive predictive values, we defined distinct ranges of the FFRsim >0.88 and ≤0.8. In our patient population these ranges were found in 69% of the cases (Figure 7).
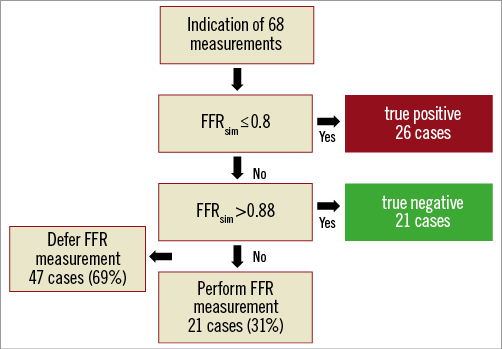
Figure 7. Post hoc analysis of our calculations to defer the unnecessary FFR measurements.
DIAGNOSTIC PERFORMANCE OF FFRsim ASSESSMENT AGAINST 3D-QCA DATA
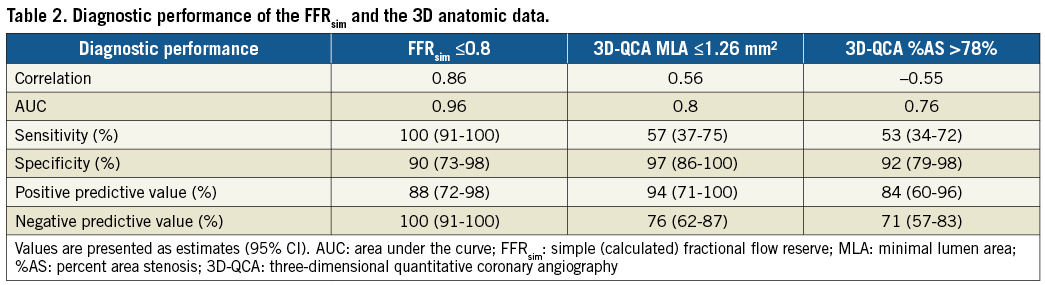
Previous data have repeatedly confirmed higher accuracy of 3D morphological measurements compared to 2D-QCA calculations2. Additionally, several authors using the CFD model for FFR calculations reported higher diagnostic accuracy of the calculated FFR when comparing to 3D morphological data9,10. In our study, the FFRsim showed a stronger association with the measured FFR values than the 3D-MLA and 3D AS% data (AUC FFRsim vs. MLA: 0.96 vs. 0.8 [p=0.0065]; AUC FFRsim vs. AS%: 0.96 vs. 0.76 [p=0.0005]) (Figure 8, Table 2).
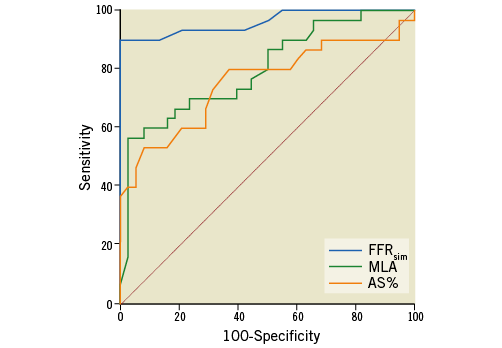
Figure 8. Comparison of ROC curves. The FFRsim showed a stronger correlation with the measured FFR values than the MLA and AS% data (AUC FFRsim vs. MLA: 0.96 vs. 0.8 [p=0.0065]; AUC FFRsim vs. AS%: 0.96 vs. 0.76 [p=0.0005]; AUC MLA vs. AS%: 0.8 vs. 0.76 [p=0.46]). AS%: percent area stenosis; AUC: area under the curve; FFRsim: simple (calculated) FFR; MLA: minimal lumen area; ROC: receiver operating characteristic
REPRODUCIBILITY OF FFRsim CALCULATIONS
Following calculation of the primary data set, repeated FFR calculations were carried out for 10 randomly selected stenoses at least one month after the last measurement. These calculations were performed by both the previous investigator and someone familiar with 3D reconstruction technique, who did not know the primary results. The intra-observer variability was 0.00±0.04, while the inter-observer variability was 0.01±0.04.
Discussion
Our aim was to develop a simplified model of FFR calculation of intermediate lesions, producing data that are in agreement with the measured FFR. We hoped the model would be adequate to predict the haemodynamic consequences of the significant part of stenoses, obviating the need for invasive measurement. On the other hand, if we could identify cases that really required invasive FFR assessment, the adherence to the pressure wire measurement could be increased and thus the quality of the clinical decision making would improve.
For calculation of the pressure gradient we used an algorithm that provides the simplest possible data but still sufficiently accurate. In our opinion, this method enables a fast estimation of the pressure gradient.
The pressure-flow relation of the coronary arteries based on experimental models has been proposed for decades12,13. Modelling the pressure gradient on a coronary stenosis based on 2D quantitative coronary angiography has also been described14,15, but has not penetrated into clinical practice. The limitations of this approach must have originated from the inaccuracy of the 2D parameters for characterising the 3D anatomical features of a stenosis and from the fact that the calculations were based on fictive assumed flow conditions instead of real patient specific flow information.
We also used similar fluid dynamic equations as were applied in the early publications, but we incorporated the more accurate 3D anatomical parameters of the lesions and we measured the actual flow velocity in the vessels by the frame count method for the calculation of the translesional pressure gradients.
The exact assessment of the intracoronary flow is a challenge in clinical practice. Intracoronary Doppler wire examination16 or thermodilution measurement by pressure wire sensor - also capable of detecting temperature - was proposed for the evaluation17. However, these methods have not reached general availability because of the inherent limitations of their invasive nature, expense and technical difficulties. On the other hand, TIMI frame count can be calculated easily from practically every coronary angiography. It has been used for decades as an estimate of the achieved resting coronary flow velocity during the treatment of myocardial infarction by primary percutaneous coronary intervention18,20. We have previously proposed a method for calculating volumetric coronary flow using the TIMI frame count21. The clinical utility of the TIMI frame count during adenosine provocation for FFR calculation has also been demonstrated in multicentre studies10,19.
In our opinion, the proposed FFRsim approach could potentially be readily available as a point of care solution to estimate FFR results in the catheterisation laboratory. In its present form, the method does not replace the invasive measurement of the FFR generally, but could serve as an effective pre-screening prior to the pressure wire measurement. Our results show that in 69% of the cases the invasive measurement could have been obviated based on the calculation of FFRsim without any misclassification of the haemodynamic consequence of the stenosis (Figure 7).
COMPARISON OF FFRsim TO PREVIOUS MODELS FOR VIRTUAL FFR COMPUTATIONS
In recent years, combining the CFD model with 3D reconstruction from invasive angiography has produced some promising results9,10,22-24.
In the VIRTU-1 study, CFD modelling was performed by the ANSYS CFX software (ANSYS, Inc., Canonsburg, PA, USA) on coronary stenoses of 35 patients. The Navier-Stokes equations were solved for approximately 106 volumetric elements for calculation of the pressure drop. The offline analysis required 24 hours per lesion9. In the study of Tu et al10, the calculation time decreased to about 5 minutes by the simplification of the model.
Currently, a number of manufacturers (e.g., Medis, CathWorks) offer software for estimating FFR using the fluid dynamics technique, assumed value of hyperaemic flow and 3D anatomical reconstruction, even without the need for vasodilatation. Instead of further simplification in the solving of the Navier-Stokes equations, in the quantitative flow ratio (QFR) model of Medis, the pressure loss in each 6 mm subsegment was calculated using the Gould formula. The QFR was derived as follows:
QFR = (Pa – ∫ΔP dx) / Pa19.
While elaborating our method, we sought to clarify whether the more easily exploitable, swiftly calculable flow equations using the standard parameters of any 3D reconstruction software are accurate enough to estimate the pressure drop developed across the stenosis during hyperaemia. Our findings demonstrate that the model predicts haemodynamically significant lesions with a similar accuracy to previous methods requiring specific software (Supplementary Table 1).
As our calculations require only a simple Excel sheet (Supplementary Figure 2), they can be performed easily by anyone, following a simplified image-based calculation with frame count measurement (provided that 3D coronary reconstruction is also available, built either in an X-ray machine or in a separate laptop). In our opinion, this simplified method can be incorporated very easily in any Roentgen device equipped with standard 3D reconstruction software.
Limitations
Validation of the current technique has been carried out in coronary lesions of a medium-sized patient population. The investigations and FFR measurements were executed by several examiners in multiple centres, while the data were later analysed retrospectively in the core centre.
For velocity estimation the TIMI frame count was determined. This method can be used in any coronary angiography; however, its application during vasodilatation requires some routine. We used intracoronary adenosine injection for achieving the maximal vasodilation and the TIMI frame count was calculated from the immediate intracoronary contrast injection. Intravenous adenosine infusion may provide a better opportunity for a proper evaluation of the TIMI frame count; however, the intracoronary adenosine route has the advantage of simplicity, easy repeatability and lower risk of systematic haemodynamic side effects. In addition, the drop of the blood pressure during intravenously provoked vasodilation could affect the coronary flow velocity.
We also tried to take into account the flow distribution present before and after a bifurcation. To this end, we determined the average cross-sectional area for the proximal, the stenosed and the distal segments separately. Therefore, quite reliable volumetric flows were calculated for each segment. Still, this can be considered a limitation of the method.
During the determination of pressure drop, the calculated values were consistently lower than the measured data. We assume that this could have resulted from the lower detectable velocity of the contrast blood, due to the fact that the velocity of the injected contrast dye is generally lower than the blood velocity during vasodilatation. The frame count may also be influenced by the rate of the contrast injection, administered either manually or by power injection.
As we have characterised solely focal lesions while elaborating the current model, further validation is necessary for the characterisation of bifurcation and tandem lesions, as well as diffuse disease.
Conclusions
Our simplified model developed for the estimation of FFR without direct pressure measurement can help to change our everyday clinical approach from relying predominantly on morphological data to using mainly haemodynamic data. The simplicity and promptness of this method could make it suitable for the characterisation of every single intermediate stenosis. As our method has an especially good positive predictive value, it can be safely used to pre-screen those lesions and decide whether or not an invasive FFR measurement is necessary. It seems that in 69% of the cases the invasive measurement could be omitted on the basis of the calculation of FFRsim without any misclassification of the haemodynamic consequence of the stenosis.
| Impact on daily practice Fluid dynamic computation of the pressure gradient for calculation of the virtual FFR has required the use of sophisticated software. Our new simplified model assesses the functional significance of intermediate coronary artery lesions using only the hyperaemic 3D coronary angiography data. On the basis of the results, the need for application of a pressure wire can be obviated without the risk of misclassification in pre-specified ranges of the calculated FFRsim. |
Acknowledgements
The authors thank Bela Kezy for his assistance in manuscript translation.
Funding
Daniel Czuriga was supported by the Janos Bolyai Research Scholarship of the Hungarian Academy of Sciences.
Conflict of interest statement
The authors have no conflicts of interest to declare.
Supplementary data
Supplementary Table 1. Comparison of FFRsim to previous models for virtual FFR computations.
Supplementary Figure 1. Administration of ic. adenosine followed by physiological NaCl flush and contrast injection.
Supplementary Figure 2. Computation of FFRsim in Excel.
To read the full content of this article, please download the PDF.