Abstract
Aims: Fractional flow reserve (FFR) represents the percentage reduction in coronary flow relative to a hypothetically normal artery; however, percutaneous coronary intervention (PCI) seldom achieves physiological normality (FFR 1.00), particularly in the context of diffuse disease. In this study we describe a method for calculating the vessel-specific maximal achievable FFR (FFRmax) providing a personalised assessment of what PCI can achieve.
Methods and results: FFR measurements were obtained from 71 patients (100 arteries) undergoing angiography. Three-dimensional (3D) coronary anatomy was reconstructed from angiographic images. An ideal intervention, in which all stenoses are removed, was modelled, and the FFRmax calculated. The “personalised” FFR (FFRpers) was calculated as measured FFR/FFRmax. PCI was performed in 52 vessels and post-PCI FFR measured in 50. FFRmax was compared to post-PCI measured FFRs. The mean FFRmax was 0.92 (±0.04). This was on average 0.04 (±0.05) higher than the corresponding post-PCI measured FFR (p<0.001). FFRpers was significantly higher (0.06±0.04) than measured FFR (p<0.001), indicating that FFR overestimates flow restoration achievable with PCI.
Conclusions: A patient’s maximal achievable FFR can now be determined prior to PCI. This approach provides a more realistic assessment of the physiological benefit of PCI than is implied by baseline FFR and may prevent unnecessary intervention.
Introduction
Fractional flow reserve (FFR) is the gold standard method by which the physiological significance of epicardial coronary artery disease is determined in the cardiac catheterisation laboratory1,2. When FFR is used to guide percutaneous coronary intervention (PCI), clinical and economic outcomes are improved3. FFR represents the ratio of blood flow through a stenosed vessel relative to that in a hypothetically normal vessel. Measuring flow in vivo is challenging; therefore, pressure is used as a surrogate for flow. However, PCI seldom achieves a post-treatment FFR of 1.0, even when there is a satisfactory angiographic result. Therefore, by assuming that an FFR of 1.0 is achievable, the baseline FFR may suggest a greater potential benefit to be achieved by PCI than is actually possible. This is especially true in the presence of complex, diffuse disease and serial lesions. A suboptimal post-PCI FFR can lead to further unnecessary treatment with little cumulative gain in FFR. This could pose additional risk without significant clinical benefit. Knowing the maximal achievable FFR (FFRmax) prior to intervention would be advantageous in planning revascularisation. In this study, we aimed to introduce a method which personalises FFR assessment from the coronary angiogram by predicting the best possible physiological response that PCI can achieve at an artery-specific level.
Methods
STUDY DESIGN
This was an observational cohort study performed in the South Yorkshire Cardiothoracic Centre, Sheffield Teaching Hospitals NHS Foundation Trust, and the University of Sheffield, United Kingdom.
STUDY POPULATION
Data were collected prospectively from patients undergoing coronary angiography and pressure wire assessment between January 2014 and June 2016. Consecutive patients >18 years of age with angiographically confirmed coronary disease (30-90% stenosis by visual angiographic assessment) were recruited. Patients were excluded if they had presented acutely within the previous 60 days, had prior coronary artery bypass graft surgery, chronic total occlusions, if passage of a pressure wire would be unsafe, or if the patient was unable or unwilling to consent. All patients provided informed written consent and the study was approved by the regional ethics committee. Coronary artery segments were defined according to the American Heart Association reporting system4. Diffuse disease and serial lesions were defined according to SYNTAX score definitions5.
INVASIVE ANGIOGRAPHY AND MEASURED FFR
Coronary angiograms were performed according to standard practice. Diseased arteries were assessed with a pressure wire (Philips Volcano or Abbott Vascular). Hyperaemia was induced by an intravenous infusion of adenosine at 140 µg/kg/min. The FFR measurement was taken during maximal stable hyperaemia according to the methods originally described by Pijls et al6. The decision to proceed to PCI was made by the operator, guided by angiographic and invasive FFR assessment. In patients who underwent PCI, FFR measurement was repeated after treatment.
3D RECONSTRUCTION
A 3D reconstruction of the arterial anatomy was created using a Philips workstation offline after the procedure. The operator performing the reconstruction was blinded to the FFR results and procedural details. Two angiographic images ≥30° apart were selected. The images were imported alongside the ECG signal data which allowed end-diastolic frames to be selected for reconstruction (segmentation). The 3D reconstruction was exported to the Sheffield VIRTUheart™ software.
VIRTUAL CORONARY INTERVENTION AND PHYSIOLOGICAL SIMULATION
The vessel geometry was represented as a set of connected circular cross-sections following points along the centreline of the vessel. Using a dedicated graphical user interface, the operator selected the location of all stenoses they wished to treat or virtually remove. The cross-sectional radius was then adjusted and the vessel trajectory smoothed using a cubic spline and virtual coronary intervention (VCI) was performed, i.e., the artery was “virtually” stented7. As a validation step, the actual PCI procedure that was performed in vivo was replicated in the model system. To compute the maximal achievable FFR, a theoretical, ideal intervention in which all discernible stenoses were treated was modelled. The virtually treated artery was then subjected to computational fluid dynamics (CFD) simulation and computation of FFR. All CFD analyses were performed using ANSYS CFX v18.2 (ANSYS Inc., Canonsburg, PA, USA). Personalised proximal and distal boundary conditions were applied on the assumption that the coronary microvascular resistance was not altered by removal of stenoses8,9. The result obtained was the “virtual FFR” of the normalised vessel, i.e., FFRmax. The distal boundary was tuned using personalised pressure measurements10. Because the simulation was tuned using the invasive pressure wire data, no assumptions were made about boundary condition selection. CFD simulation was used to derive and evaluate personalised FFR assessment and was not a test of virtual FFR accuracy, which is a separate concept. To assess the reproducibility of FFRmax computation, ten percent of cases were reprocessed, with the operator blinded to the original results. The focus was on reproducibility of FFRmax computation; therefore, the baseline vessel 3D reconstruction was not repeated. FFRmax results were compared and the intra-class correlation coefficient calculated.
CALCULATION OF PERSONALISED FFR
Personalised FFR (FFRpers) was calculated as invasively measured (m)FFR divided by FFRmax (mFFR/FFRmax). Therefore, it represents the degree of flow restoration potentially achievable on a vessel-specific basis. The mathematical derivation of this index is provided in Supplementary Appendix 1.
DATA ANALYSIS
Data are described as mean (±SD) and % (proportions) unless otherwise stated. FFRmax was compared to post-PCI FFR using a paired samples t-test and Pearson correlation. All statistical analyses were performed using SPSS, Version 24 (IBM Corp., Armonk, NY, USA).
Results
PATIENT, LESION AND PROCEDURAL CHARACTERISTICS
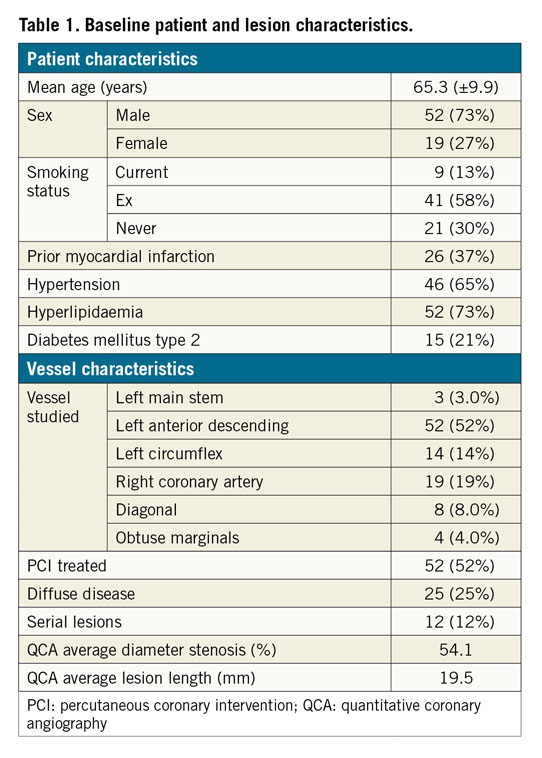
Seventy-one patients with angiographically confirmed disease were studied. The mean age was 65.2 (±9.9) years, 52 (73%) were male, 15 (21%) had type 2 diabetes mellitus, 46 (65%) had hypertension and 52 (73%) had hyperlipidaemia (Table 1). These patients provided one hundred vessels for study – three left main stem (LMS), 52 left anterior descending (LAD), eight diagonal, four obtuse marginal, 14 left circumflex (LCX), and 19 right coronary arteries (RCA). Twelve (12%) had serial lesions and 25 (25%) had diffuse disease. The average % diameter stenosis, determined by QCA, was 54.1 (±12). The mean invasively measured baseline FFR (mFFR) was 0.76 (±0.13). Fifty-two (52%) vessels underwent PCI, and the post-PCI FFR was measured in 50. Mean stent length and diameter were 27.5 (±10.8) mm and 3.0 (±0.5) mm, respectively. All patients received second-generation drug-eluting stents.
ACCURACY OF VCI TO PREDICT POST-PCI FFR
After PCI, the measured FFR was 0.89 (±0.05) and the virtual (v)FFR was 0.90 (±0.05). The difference between measured and modelled post-VCI FFR was 0.009 (±0.03). The average absolute error was ±0.01 (±2%). The correlation between post-PCI measured FFR and post-VCI modelled FFR was 0.88.
MAXIMAL ACHIEVABLE FFR (FFRmax)
FFRmax was successfully computed in a mean time of 95 s. Segmentation time is additional to this. The entire process from loading the image to obtaining the FFR takes approximately five minutes per case. Mean FFRmax was 0.92 (±0.04) (range = 0.81-0.99). A vessel-specific breakdown is shown in Table 2. In the 50 cases with a post-PCI FFR measurement, the post-PCI mFFR was 0.89 (±0.05), on average 0.04 (±0.05) lower than the corresponding FFRmax, and the range of the difference was 0-0.18 (p=<0.001). A subgroup analysis of the post-PCI cases is shown in Table 3. In 14 vessels, FFRmax was >0.05 higher than post-PCI FFR. In 13/14, this was due to uncovered disease distal to the stented segment (Figure 1). In one, there was a residual pressure drop across the stented segment. The average length of “virtual stent” used to achieve the FFRmax was 30.7 (±9.6) mm per vessel. The per-vessel virtual stent length was on average 2.8 mm longer than the stent length deployed during PCI (p=0.18).
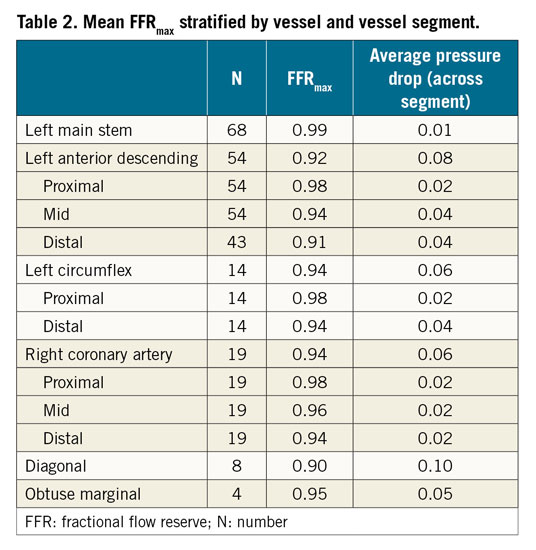
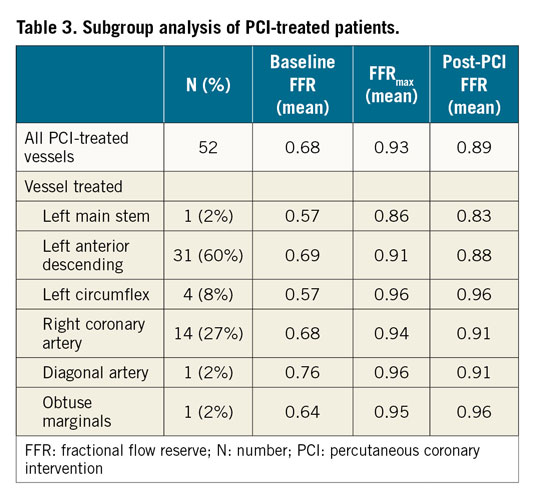
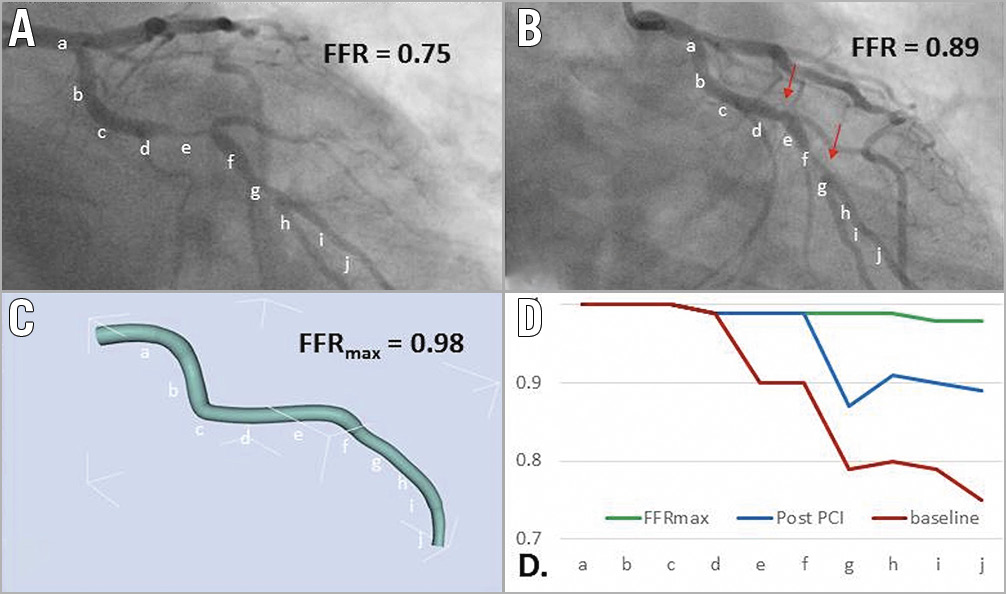
Figure 1. Using co-registration to determine the difference between FFRmax and post-PCI FFR. A 55-year-old with stable angina underwent coronary angiography, revealing a lesion in the LCX. The invasively measured FFR was 0.75 (A). The patient underwent PCI and measured post-PCI FFR was 0.89 (B). The FFRmax was calculated as 0.98 (C). This result is significantly higher than the achieved post-PCI FFR, suggesting that further optimisation may have been possible (there are residual diseased segments distal to the stent, marked in panel B). By plotting the FFR values along the length of the vessel, a comparison between baseline, post-PCI and FFRmax values is made (D); a-j along the x-axis represent the 10 vessel segments identified on the angiographic images. This demonstrates a second distal lesion which accounts for the difference between the FFRmax and post-PCI FFR.
REPRODUCIBILITY OF FFRmax COMPUTATION
The computation of FFRmax was highly reproducible. Of the 10 cases reprocessed, the average difference was 0.002 (±0.003). The intra-class correlation coefficient was 0.99 (p<0.001).
COMPARISON BETWEEN MEASURED FFR AND PERSONALISED FFR (FFRpers)
FFRpers was calculated in all vessels. The mean FFRpers was 0.82 (±0.14). The mean difference between FFRpers and measured FFR was 0.06 (±0.04) (p=<0.001). All measured FFR and corresponding FFRpers results are shown in Figure 2.
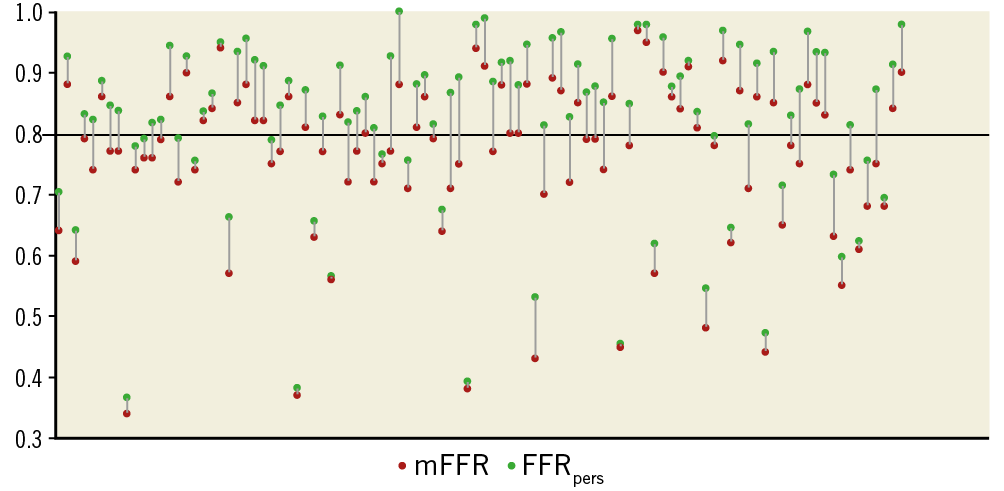
Figure 2. Individually plotted mFFR and corresponding FFRpers values for all lesions studied. The mFFR value is plotted for all 100 lesions studied (red dot). The corresponding FFRpers is plotted (green dot) and joined by a grey line. The black horizontal line represents the 0.80 treatment threshold.
Discussion
We have demonstrated a method of determining the maximal achievable FFR (FFRmax) prior to intervention based upon the invasive coronary angiogram and standard pressure wire data on a vessel-specific basis. This allowed personalisation of FFR assessment. In a cohort of real-world patients with stable coronary artery disease, FFRmax was successfully computed in all cases in a mean time of 95 s. The mean value of the FFRmax was 0.92.
FFR represents the percentage reduction in coronary flow relative to a hypothetically normal artery. However, it does not accurately reflect the potential flow restoration achievable with PCI in a particular patient. This is because the maximal achievable FFR on a case-by-case basis is not known prior to intervention. As such, it does not always accurately predict which patients will benefit from PCI and to what degree. Therefore, even with FFR guidance, it may still be challenging to determine which patients will benefit from revascularisation, especially when the measured FFR is close to 0.8011. A universal threshold of 0.80 is applied to all patients to determine when revascularisation is likely to provide benefit. Although this threshold is supported by clinical outcome data in large groups as a whole, and is probably satisfactory in most cases, an FFR of 0.78 can describe a number of different physiological situations which may respond differently to PCI.
A personalised approach to coronary physiological assessment using FFRmax and FFRpers may help to identify patients who will gain benefit from targeted PCI (Figure 3), patients who are likely to get limited physiological benefit from PCI due to underlying diffuse disease (Figure 4) and patients in whom further procedural optimisation may be possible (Figure 5).
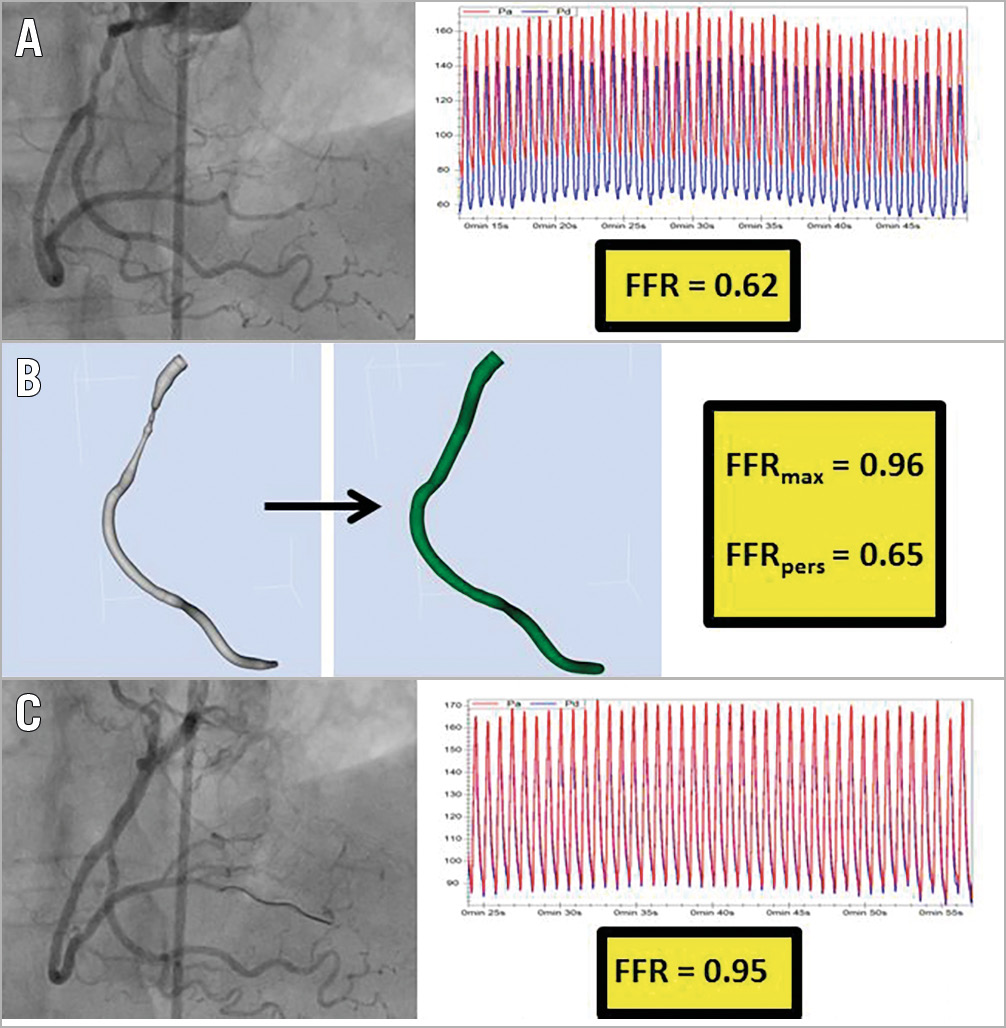
Figure 3. Identifying a focal lesion that is likely to achieve a good physiological result from targeted PCI. An 81-year-old with stable angina underwent angiography, identifying a lesion in the RCA. Pressure wire assessment revealed an FFR of 0.62 (A). A reconstruction of the arterial geometry was created (B, left image) and the stenoses virtually removed to reveal the “normalised” geometry (B, central image). The FFRmax and FFRpers were calculated as 0.96 and 0.65, respectively. These results advise the operator that this lesion is likely to lead to an excellent physiological result from focal PCI. PCI was performed with a good angiographic result (C, left image). Post-PCI measured FFR was 0.95 (C, right image).
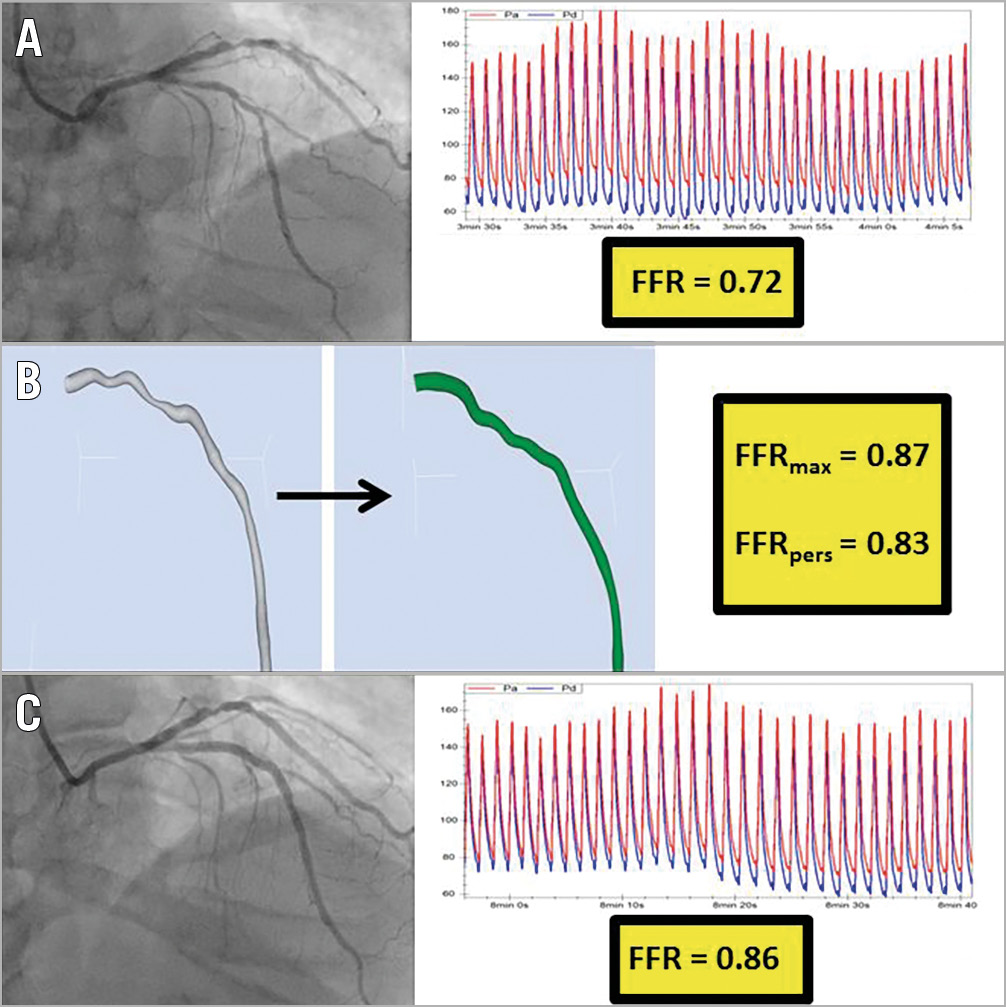
Figure 4. Identifying a lesion that is unlikely to achieve a significant physiological improvement from focal PCI. A 61-year-old with stable angina underwent coronary angiography, revealing a lesion in the LAD. The invasive FFR measurement was 0.72 (A). A reconstruction of the arterial geometry was created (B, left image) and the stenoses virtually removed to reveal the “normalised” geometry (B, central image). The FFRmax and FFRpers were calculated as 0.87 and 0.83, respectively. These results suggest that only a modest physiological benefit is likely to be achieved from focal PCI. This patient proceeded to PCI with a good local angiographic result (C, left image). The post-PCI FFR was, however, only 0.86 (C, right image), which is in keeping with the predicted FFRmax. Knowing the FFRmax in this case would have informed the decision to perform PCI in the first place, and would help to prevent futile attempts to improve the post-PCI FFR.
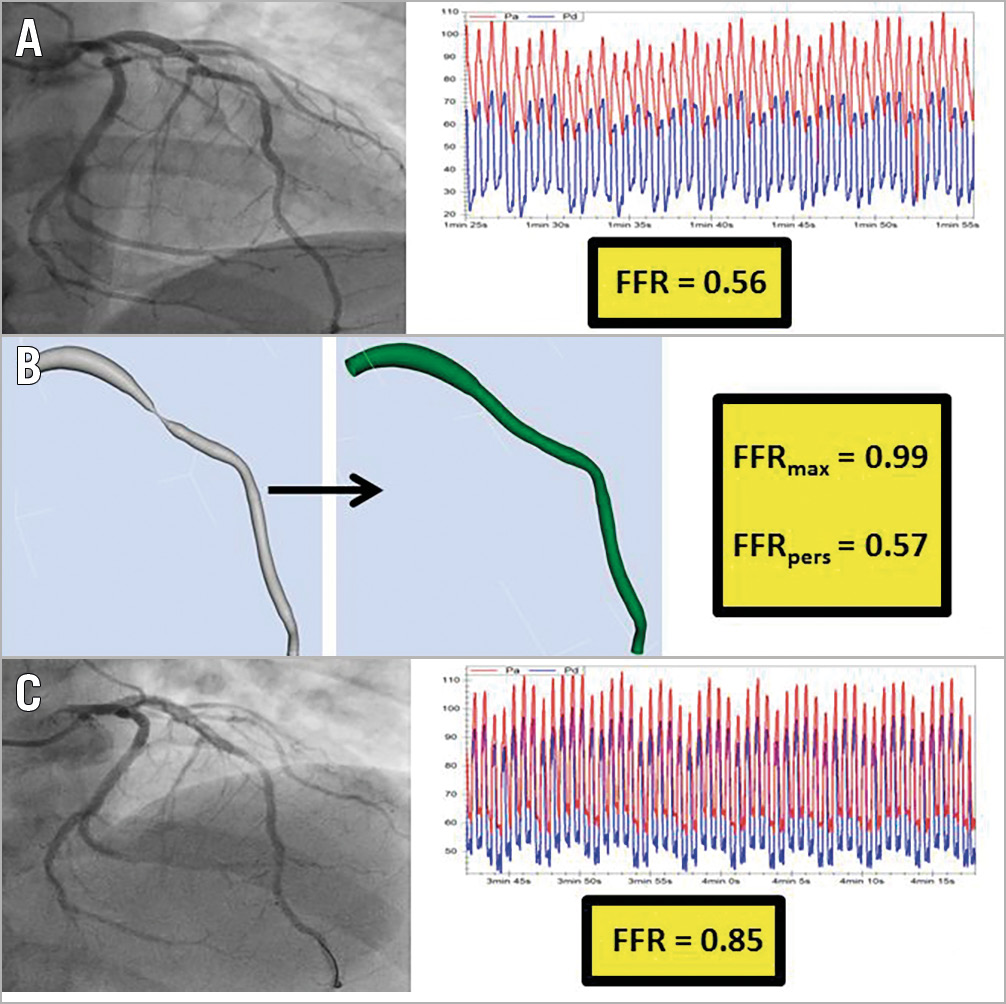
Figure 5. Identifying a lesion that may benefit from further post-PCI optimisation. A 55-year-old with stable angina underwent coronary angiography, revealing a lesion in the LAD. The invasively measured FFR was 0.56 (A). A reconstruction of the arterial geometry was created (B, left image) and the stenoses virtually removed to reveal the “normalised” geometry (B, central image). The FFRmax and FFRpers were calculated as 0.99 and 0.57, respectively. These results advise the operator that this lesion is likely to lead to a good physiological result from focal PCI. The patient underwent PCI and the invasively measured post-PCI FFR was 0.85 (C). This initial result is significantly lower than the FFRmax, suggesting that further procedural optimisation may have been possible.
It is unclear what degree of flow restoration is required for the patient to gain symptomatic and/or prognostic benefit. Some limited outcome data suggest that patients with a post-PCI measured FFR >0.90 have reduced rates of major adverse cardiac events following PCI12. Our method will require outcome studies to determine the value of FFRpers which might more accurately define the threshold for treatment.
Not only was FFRmax significantly lower than 1.0, but it varied considerably between cases (range 0.81-0.99). This is consistent with previous work showing that, even in the absence of an angiographic stenosis, there is a pressure drop along the length of the vessel13. In patients with confirmed coronary artery disease elsewhere, the average drop in pressure along an apparently normal vessel was 10 (±8) mmHg under hyperaemic conditions (FFR 0.89±0.08, range 0.69-1.00). For eight percent of these patients, the FFR value was below the threshold for treatment (≤0.80). In patients with apparently completely normal arteries, the average FFR was 0.97±0.02 (range 0.92-1.00).
A gradual pressure drop in the presence of diffuse disease can be associated with increased mortality, and it is usually not amenable to intervention14. An optimal physiological result is seldom achieved following PCI, despite the use of long (>30 mm) and ultra-long (>50 mm) drug-eluting stents15. In patients with a lesion length >30 mm, fewer than one third achieved a post-PCI FFR of >0.90, with only 11% >0.95. Eight (11%) vessels remained haemodynamically significant (FFR ≤0.80). In another study, 17.8% of vessels remained ischaemic (FFR <0.80) immediately after treatment, and 9.5% continued to be ischaemic despite further attempts at PCI optimisation. Diffuse disease was a predictor of a post-PCI FFR ≤0.8016. In our study, similar post-PCI FFR results were seen. Eighteen (36%) patients had a post-PCI FFR >0.90 and four (8%) >0.95. Three (6%) remained haemodynamically significant (FFR <0.80). Higher post-PCI FFR results are associated with improved outcomes12,17,18,19, yet in clinical practice this is not always achievable. Identifying patients likely to have a suboptimal physiological result following PCI would therefore be advantageous. FFRmax could provide this.
In some cases, a suboptimal post-PCI FFR is not due to the presence of untreatable diffuse disease but can be the result of a poorly optimised procedure. The FFRmax can help the operator to distinguish between these two scenarios, either by guiding further optimisation or conversely by preventing further treatment that is futile and potentially harmful. Procedural optimisation with post-dilatation, and in some cases further stent implantation, has previously been shown to result in modest increases in FFR. In the ILUMIEN 1 trial, a statistically non-significant increase in post-PCI FFR from 0.86 to 0.90 was achieved with OCT-driven optimisation20. In our study, FFRmax was on average 0.04 (range 0-0.18) higher than the post-PCI FFR, suggesting that a similar level of optimisation may have been possible. In 14 (28%) cases, the FFRmax was >0.05 higher than the post-PCI FFR. This was most frequently (in 13 out of these 14 cases) due to the presence of uncovered disease distal to the stented segment.
Limitations
Our computational model is based upon a single lumen reconstruction. This could lead to an overestimation of FFR. The accuracy of the vFFR computation is affected by the accuracy of the vessel reconstruction (segmentation). Previous studies using this approach have shown the ability to predict the FFR with high accuracy10,21. The accuracy of FFRmax cannot be fully validated as there is no method of in vivo measurement available. However, our results are consistent with other studies of in vivo post-PCI results. Furthermore, our model has previously been shown to have extremely high accuracy in predicting FFR10 and we would expect similar accuracy to be extrapolated in the normalised geometries. Although our model can predict FFR with high accuracy, it is still subject to the same limitations (notably its reliance on minimising microvascular resistance) as invasive FFR measurement.
Conclusions
We have demonstrated the feasibility of calculating the maximal achievable FFR prior to PCI on a vessel-specific basis, allowing the personalisation of FFR assessment. Unlike standard FFR, our methods of personalising FFR reflect the potential benefit of PCI relative to patient-specific anatomy rather than an unachievable hypothetical norm. This new concept opens new horizons for treatment planning and could prevent unnecessary PCI or excessive stenting.
|
Impact on daily practice PCI seldom achieves a post-treatment FFR of 1.0, even when there is a satisfactory angiographic result. Therefore, in many cases, FFR leads the operator to overestimate the potential benefit of PCI. We have developed a method of personalising FFR which reflects flow reduction relative to patient-specific anatomy rather than a hypothetical norm and therefore more accurately predicts the potential physiological benefit from PCI. |
Funding
R.C. Gosling is funded by a BHF FS/16/48/32306 CRTF. P.D. Morris is funded by an NIHR Clinical Lectureship. Clinical data collection was supported by a Wellcome Trust and Department of Health, Health Innovation Challenge Fund grant (R/135171-11-1).
Conflict of interest statement
The authors have no conflicts of interest to declare.