Abstract
Background: Fractional flow reserve (FFR)-guided percutaneous coronary intervention (PCI) is superior to angiography-guided PCI. The clinical uptake of FFR has been limited, however, by the need to advance a wire in the coronary artery, the additional time required and the need for hyperaemic agents which can cause patient discomfort. FFR derived from routine coronary angiography eliminates these issues.
Aims: The aim of this study was to assess the diagnostic performance and accuracy of three-dimensional quantitative coronary angiography (3D-QCA)-based vessel FFR (vFFR) compared to pressure wire-based FFR (≤0.80).
Methods: The FAST II (Fast Assessment of STenosis severity) study was a prospective observational multicentre study designed to evaluate the diagnostic accuracy of vFFR compared to the reference standard (pressure wire-based FFR ≤0.80). A total of 334 patients from six centres were enrolled. Both site-determined and blinded independent core lab vFFR measurements were compared to FFR.
Results: The core lab vFFR was 0.83±0.09 and pressure wire-based FFR 0.83±0.08. A good correlation was found between core lab vFFR and pressure wire-based FFR (R=0.74; p<0.001; mean bias 0.0029±0.0642). vFFR had an excellent diagnostic accuracy in identifying lesions with an invasive wire-based FFR ≤0.80 (area under the curve [AUC] 0.93; 95% confidence interval [CI]: 0.90-0.96; p<0.001). Positive predictive value, negative predictive value, diagnostic accuracy, sensitivity and specificity of vFFR were 90%, 90%, 90%, 81% and 95%, respectively.
Conclusions: 3D-QCA-based vFFR has excellent diagnostic performance to detect FFR ≤0.80. The study was registered on clinicaltrials.gov under identifier NCT03791320.
Introduction
Contemporary guidelines have underlined the importance of a physiological assessment of intermediate coronary artery lesions1. Numerous randomised controlled trials support the super-iority of an FFR- versus angiography-guided approach to percutaneous coronary intervention (PCI). An FFR-guided approach has been shown to reduce the number of stents, repeat revascularisation, myocardial infarction and cost2,3,4,5. Despite a growing body of evidence, the use of FFR in clinical practice remains limited. Instrumentation of the coronary artery, consumable costs and patient discomfort related to hyperaemia are some of the presumed hurdles to greater adoption6. Multivessel FFR is performed very infrequently, even in the presence of multiple intermediate lesions, due to the added time, risk and equipment changes required. We recently demonstrated in two retrospective single-centre studies (FAST I [Fast Assessment of STenosis severity] and FAST Extend) the feasibility and diagnostic accuracy of a novel three-dimensional quantitative coronary angiography (3D-QCA)-based software tool to calculate vessel FFR (vFFR) as a more patient-friendly alternative to invasive physiology7,8. The aim of the present multicentre, observational FAST II study was to prospectively assess the performance and accuracy of vFFR for the prediction of invasive pressure wire-based FFR, in a blinded core laboratory.
Methods
STUDY DESIGN AND STUDY POPULATION
The FAST II study was a prospective, international multicentre study designed to evaluate the diagnostic accuracy of offline vFFR in identifying physiologically significant coronary artery disease (CAD) by using invasive pressure wire-based FFR (≤0.80) as the reference standard. The study protocol was approved by the local ethics committees of all participating sites and was conducted in accordance with both Good Clinical Practice and with the Declaration of Helsinki (64th WMA General Assembly, Fortaleza, Brazil, October 2013). All patients provided written informed consent. The study was registered on clinicaltrials.gov under the identifier NCT03791320.
Patients presenting with chronic coronary syndromes, unstable angina or non-ST-elevation acute coronary syndrome (NSTEMI) undergoing diagnostic coronary angiography and/or PCI with an indication to perform invasive pre-PCI FFR assessment of coronary artery lesions were included. One vessel per patient was included in the study. Clinical exclusion criteria included ST-elevation myocardial infarction (STEMI) at presentation, previous coronary artery bypass graft (CABG), cardiogenic shock or severe haemodynamic instability and adenosine intolerance. Angiographic exclusion criteria included ostial left main (LM) or ostial right coronary artery (RCA) lesions, thrombus-containing lesions and excessive overlap or tortuosity precluding vFFR computation.
STUDY PROCEDURES
All procedures were performed according to standard clinical practice. Aortic root pressure measured at the catheter tip was recorded at the start of the FFR procedure in all cases. Pressure wire-based FFR (PressureWire Aeris; Abbott Laboratories) was performed in intermediate coronary lesions (defined as diameter stenosis of 30-70% by visual assessment). “Diffuse disease” was defined as diffuse wall irregularity without focal lesions (diameter stenosis 30-70%). Angiographic lesion severity was assessed by two angiographic projections (at least 30° apart, preferably orthogonal) after a bolus of 200 mcg intracoronary nitroglycerine. FFR measurements were performed under maximum hyperaemia achieved by either intra-coronary bolus of adenosine (200 µg in the LCA and 100 µg in the RCA) (12% of the cases) or continuous intravenous infusion of adenosine at a rate of 140 μg/kg/min through an antecubital vein for at least two minutes (88% of the cases). FFR was defined as mean distal coronary artery pressure divided by mean aortic pressure during maximal hyperaemia. One additional projection was recorded to capture the position of the pressure wire. Angiograms and pressure waveforms were stored in DICOM image format for offline analyses.
3D CORONARY RECONSTRUCTION AND COMPUTATION OF vFFR
All angiographic images, haemodynamic data (including invasively measured aortic pressure) and pressure waveform tracings were anonymised and sent to an independent, blinded core laboratory (Cardialysis) for offline analysis. In addition, computation of vFFR was performed offline and assessed blind by trained observers in the participating sites. A total of three, two-dimensional images were exported to the CAAS workstation 8.2 (Pie Medical Imaging): two orthogonal views to create a 3D reconstruction of the coronary arteries and one view to ascertain the position of the FFR pressure wire. Table movement during cine-angio acquisition was not allowed. Temporal alignment of the two orthogonal view phases in the cardiac cycle was performed automatically by electrocardiogram (ECG) triggering. End-diastolic frames were identified automatically. Contour detecting was performed automatically, delineating the vessel contour from the ostium to the position at which the pressure wire sensor was positioned (3 cm from the tip). Manual correction was allowed in case of suboptimal automatic contour detection following a standard operating procedure. Percent diameter stenosis, minimal lumen diameter, reference lumen diameter, minimal lumen area and lesion length were derived from the same 3D-QCA model from which the vFFR was derived. vFFR was calculated automatically using the invasively measured aortic root pressure as an input boundary condition (Figure 1).
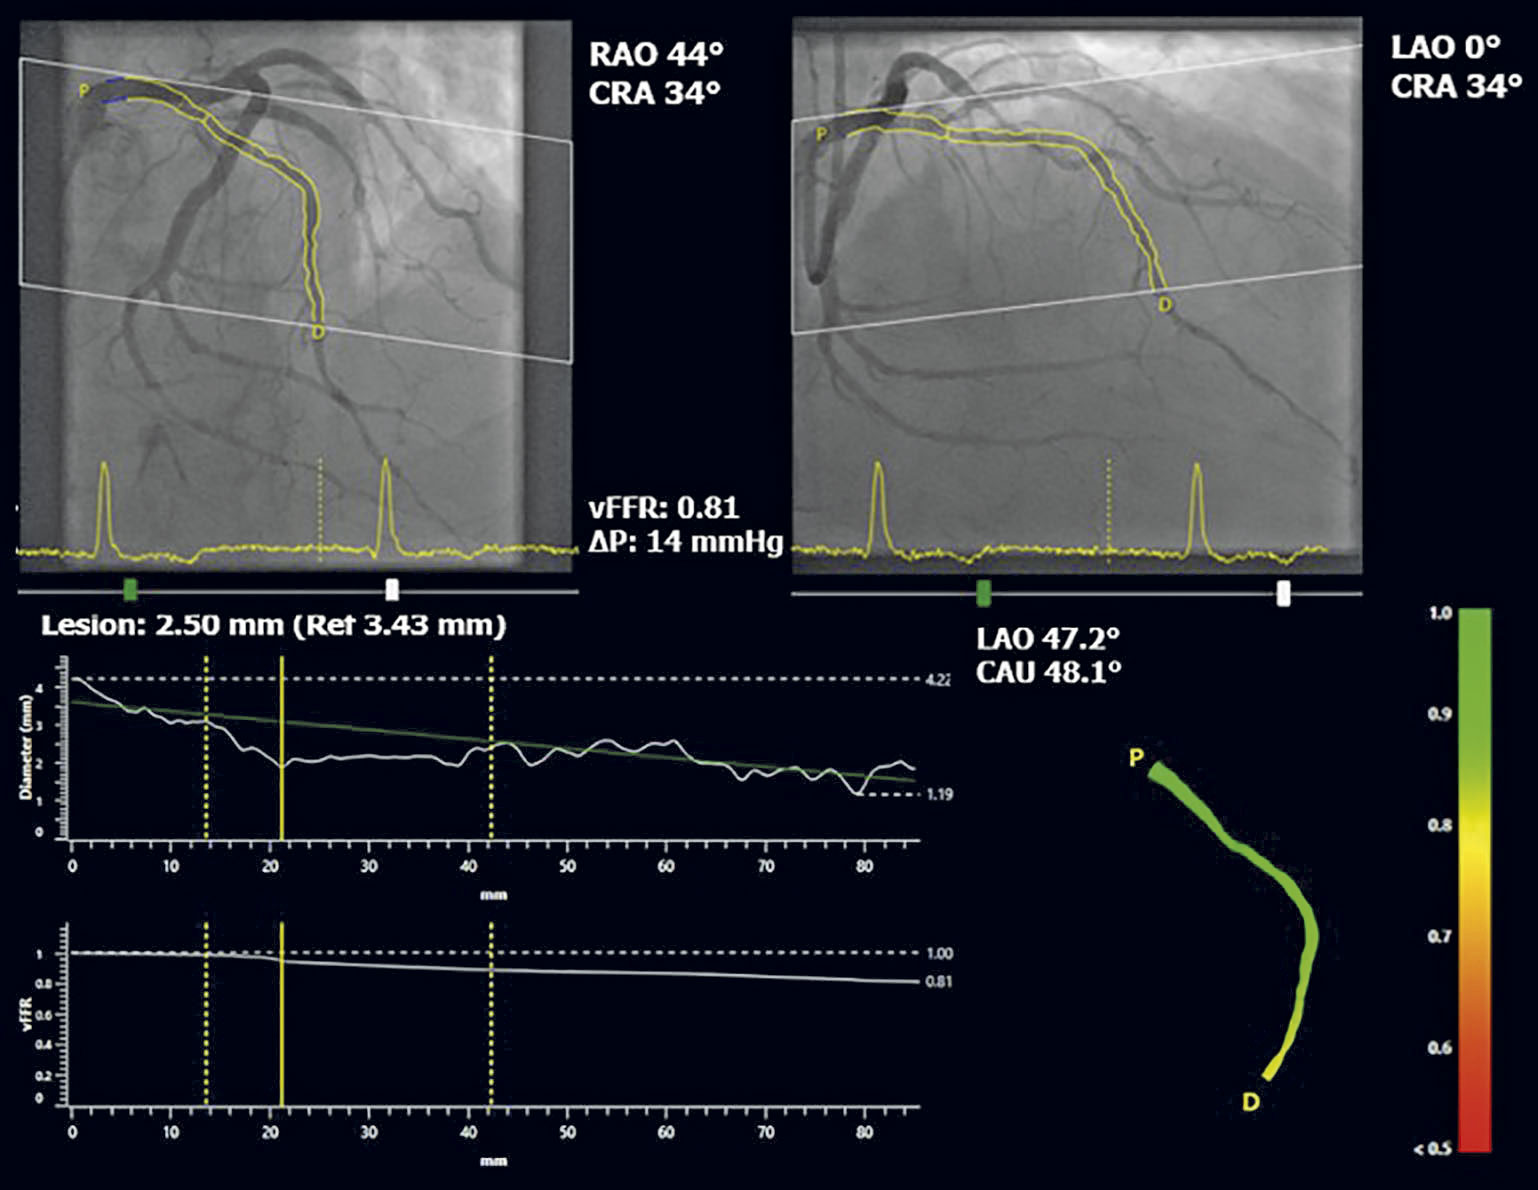
Figure 1. Three-dimensional reconstruction of coronary artery and computation of vFFR, using two angiographic projections at least 30° apart and invasively measured aortic root pressure. CRA: cranial; LAO: left anterior oblique; RAO: right anterior oblique; vFFR: vessel fractional flow reserve
Within the CAAS workstation vFFR, the pressure drop is calculated instantaneously by applying physical laws including viscous resistance and separation loss effects present in coronary flow behaviour, as described by Gould and Kirkeeide9,10. Vessel geometry was derived from well-validated 3D reconstructions11,12 reducing the effects of foreshortening, out-of-plane magnification and non-symmetric coronary lesions.
STUDY ENDPOINTS
vFFR recordings were assessed offline by a blinded core laboratory. FFR was site reported and the quality of waveforms was centrally reviewed by the steering committee. While evaluating FFR, personnel were blinded to vFFR measurements and the steering committee was blinded to the FFR values, as well as to any other patient-related data. The primary endpoint was the diagnostic accuracy of core lab-defined offline vFFR to identify a physiologically significant coronary stenosis, defined as a lesion with invasive FFR ≤0.80. The key secondary endpoint was the diagnostic accuracy of site-determined vFFR to identify invasive FFR ≤0.80.
SAMPLE SIZE
Sample size calculations were performed based on the results of the FAST I study in which 42% of the patients had a positive FFR defined as invasive FFR ≤0.807. A vFFR threshold of 0.83 was associated with a sensitivity of 90% and a specificity of 77% to identify FFR ≤0.80. We aimed to confirm these findings and describe the sensitivity and specificity of vFFR to identify FFR ≤0.80 in the target population with a 95% confidence interval (CI) of ±5%. Based on these data, we aimed to enrol a total of 330 patients (±140 with FFR ≤0.80).
STATISTICAL ANALYSIS
The normality of continuous variables was evaluated by a visual inspection of histograms, and by Shapiro-Wilk tests. Variables with normal distribution are then presented as mean±standard deviation (SD), while variables with non-normal distributions are reported as medians (25th-75th percentile). Categorical variables are expressed as counts and percentages. The relation between vFFR and FFR was visualised in a scatter plot and quantified as Pearson’s correlation coefficient (r). The agreement between both indices, as well as the agreement between on-site (investigator) and offline (core lab) vFFR, was assessed by Bland-Altman plots with corresponding 95% limits of agreement. Receiver operating characteristic (ROC) curves were plotted to visualise the diagnostic performance of vFFR for FFR ≤80, whereas the area under the curve (AUC) was calculated. The sensitivity, specificity, positive predictive value (PPV) and negative predictive value (NPV) were then determined for vFFR ≤0.80 to predict FFR ≤0.80. We present these metrics with corresponding 95% CIs. Statistical analyses were performed using SPSS statistical package, Version 24 (IBM Corp.). P-values are two-sided (unless specified otherwise), whereas a p-value <0.05 was considered statistically significant.
Results
ENROLMENT
The participating sites were in Europe, the USA and Japan and a total of 391 patients were enrolled between October 2018 and September 2020. A total of 54 patients were excluded due to angiographic exclusion criteria including overlap (n=18), poor angiography quality (n=13), table movement during cine-angio acquisition (n=9), foreshortening (n=7), ostial lesions (n=5) and unknown position of the pressure wire (n=2). Three additional patients were excluded due to absence of the FFR value, leaving a total of 334 patients (one vessel per patient) for the final analysis (Figure 2).
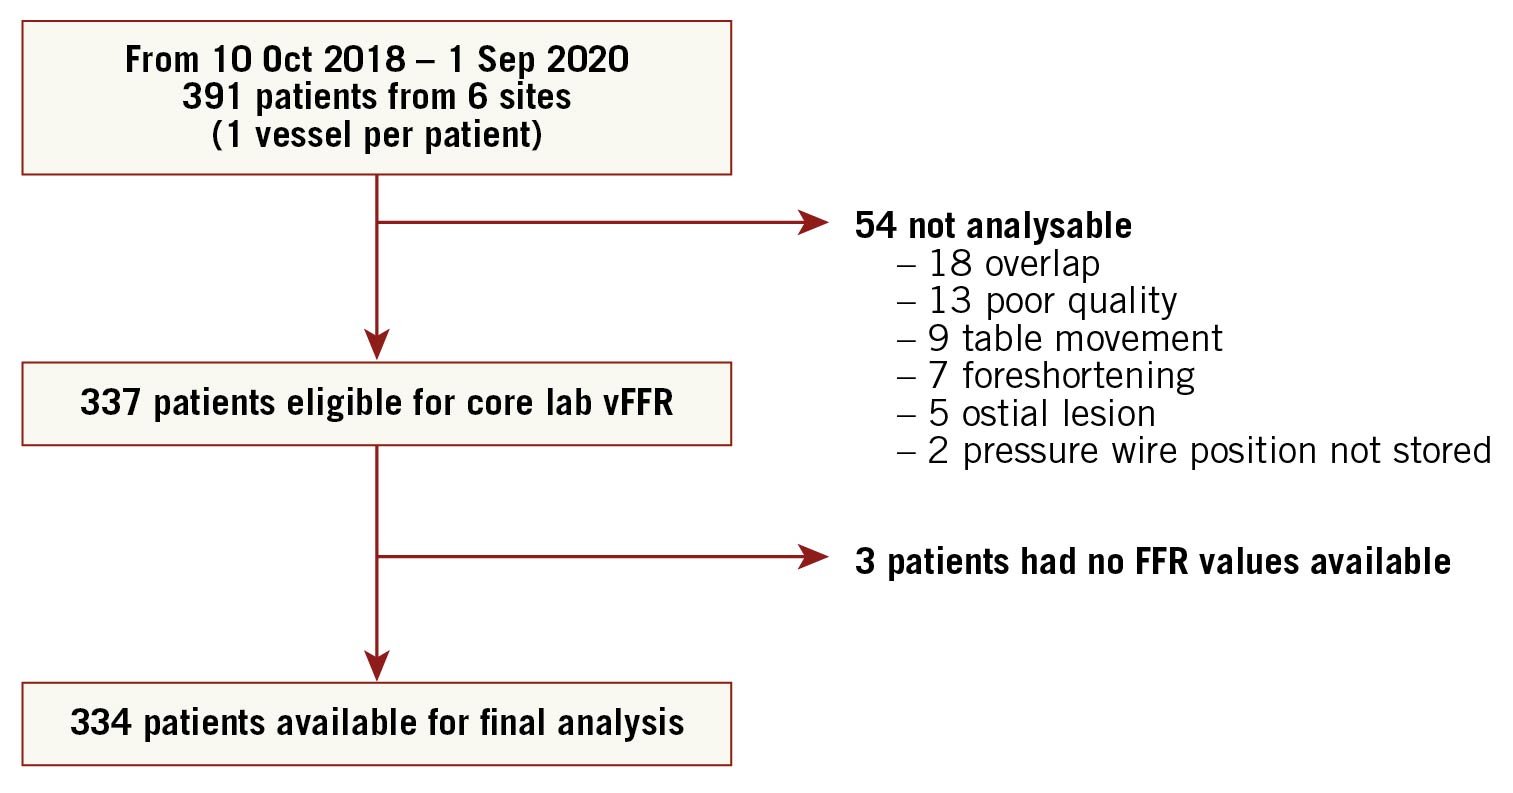
Figure 2. Flow chart of all included and excluded patients. FFR: fractional flow reserve; vFFR: vessel fractional flow reserve
PATIENTS AND PROCEDURAL DATA
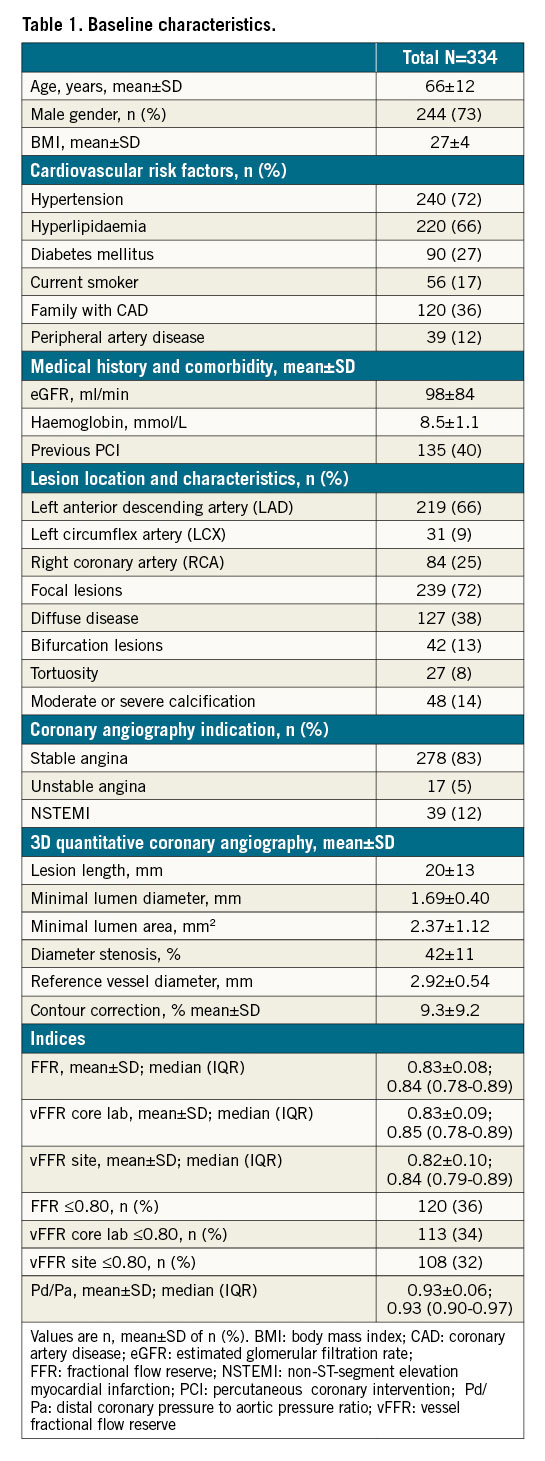
Patient and procedural characteristics are reported in Table 1. Mean age was 66±12 years and 73% of patients were male. The majority of the patients had hypertension (72%), 27% were diabetic and 88% presented with stable or unstable angina. Target vessels were left anterior descending arteries in 66%, left circumflex arteries in 9% and right coronary arteries in 25% of cases. Mean % diameter stenosis was 42±11%, lesion length 20±13 mm and minimal lumen diameter 1.69±0.40 mm. The majority of the vessels had a focal lesion (72%) and bifurcation lesions were present in 13% of the cases. Manual correction was applied to 9.3±9.2% of the automatically defined vessels contours. Mean invasive FFR was 0.83±0.08, core lab vFFR 0.83±0.09 and site-determined vFFR 0.82±0.10. Pressure wire-based FFR was ≤0.80 in 36%, core lab vFFR 34% and on-site vFFR 32%.
CORRELATION AND DIAGNOSTIC PERFORMANCE
Receiver operating characteristic (ROC) curve analysis revealed excellent accuracy of core lab vFFR in predicting FFR ≤0.80 (AUC 0.93; 95% CI: 0.90-0.96). Using a cut-off value of ≤0.80 for vFFR, sensitivity, specificity, PPV, NPV, and diagnostic accuracy were 81%, 95%, 90%, 90%, and 90%, respectively (Figure 3, Central illustration). A good correlation was found between core lab vFFR and pressure wire-based FFR (R=0.74; p<0.001) with a mean bias of 0.0029±0.0642 (Figure 4).
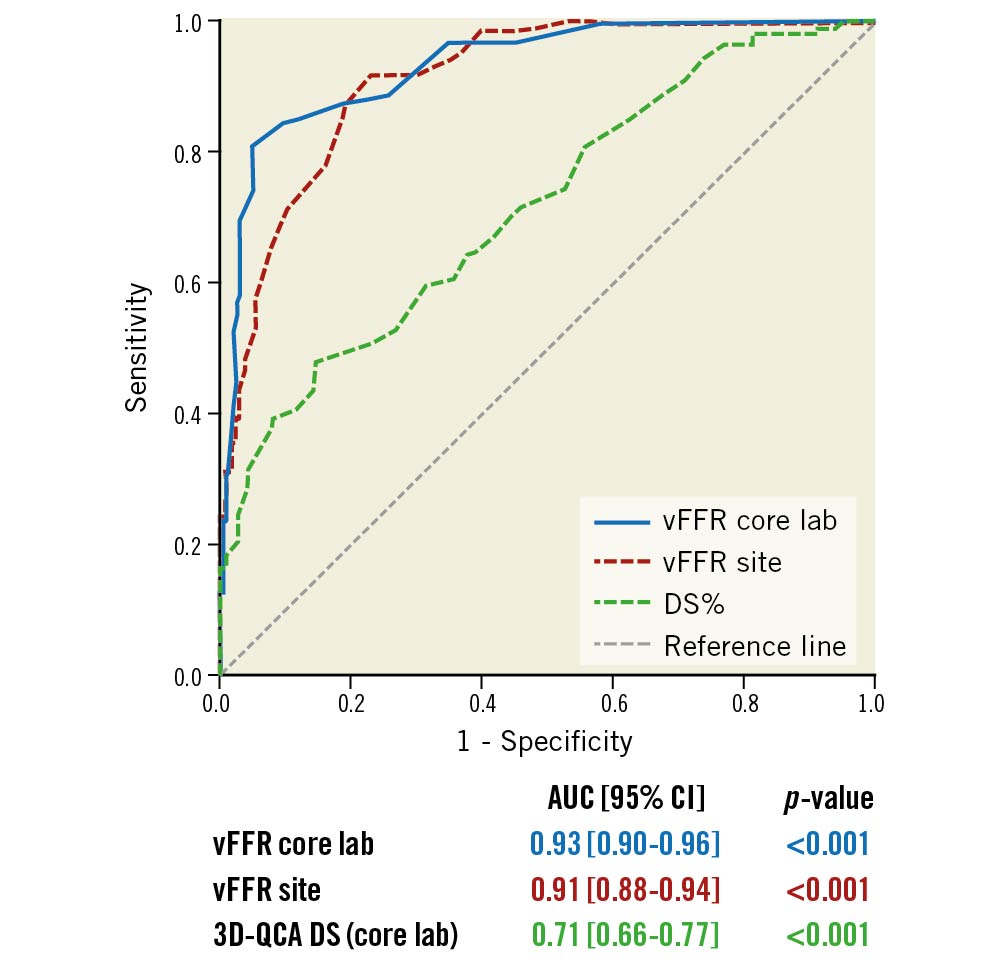
Figure 3. ROC for core lab vFFR, site vFFR and 3D-QCA. Comparison is made with a pressure wire-based FFR at a cut point of 0.80. AUC: area under the curve; DS: diameter stenosis; ROC: receiver operating characteristic; 3D-QCA: three-dimensional quantitative coronary angiography; vFFR: vessel fractional flow reserve
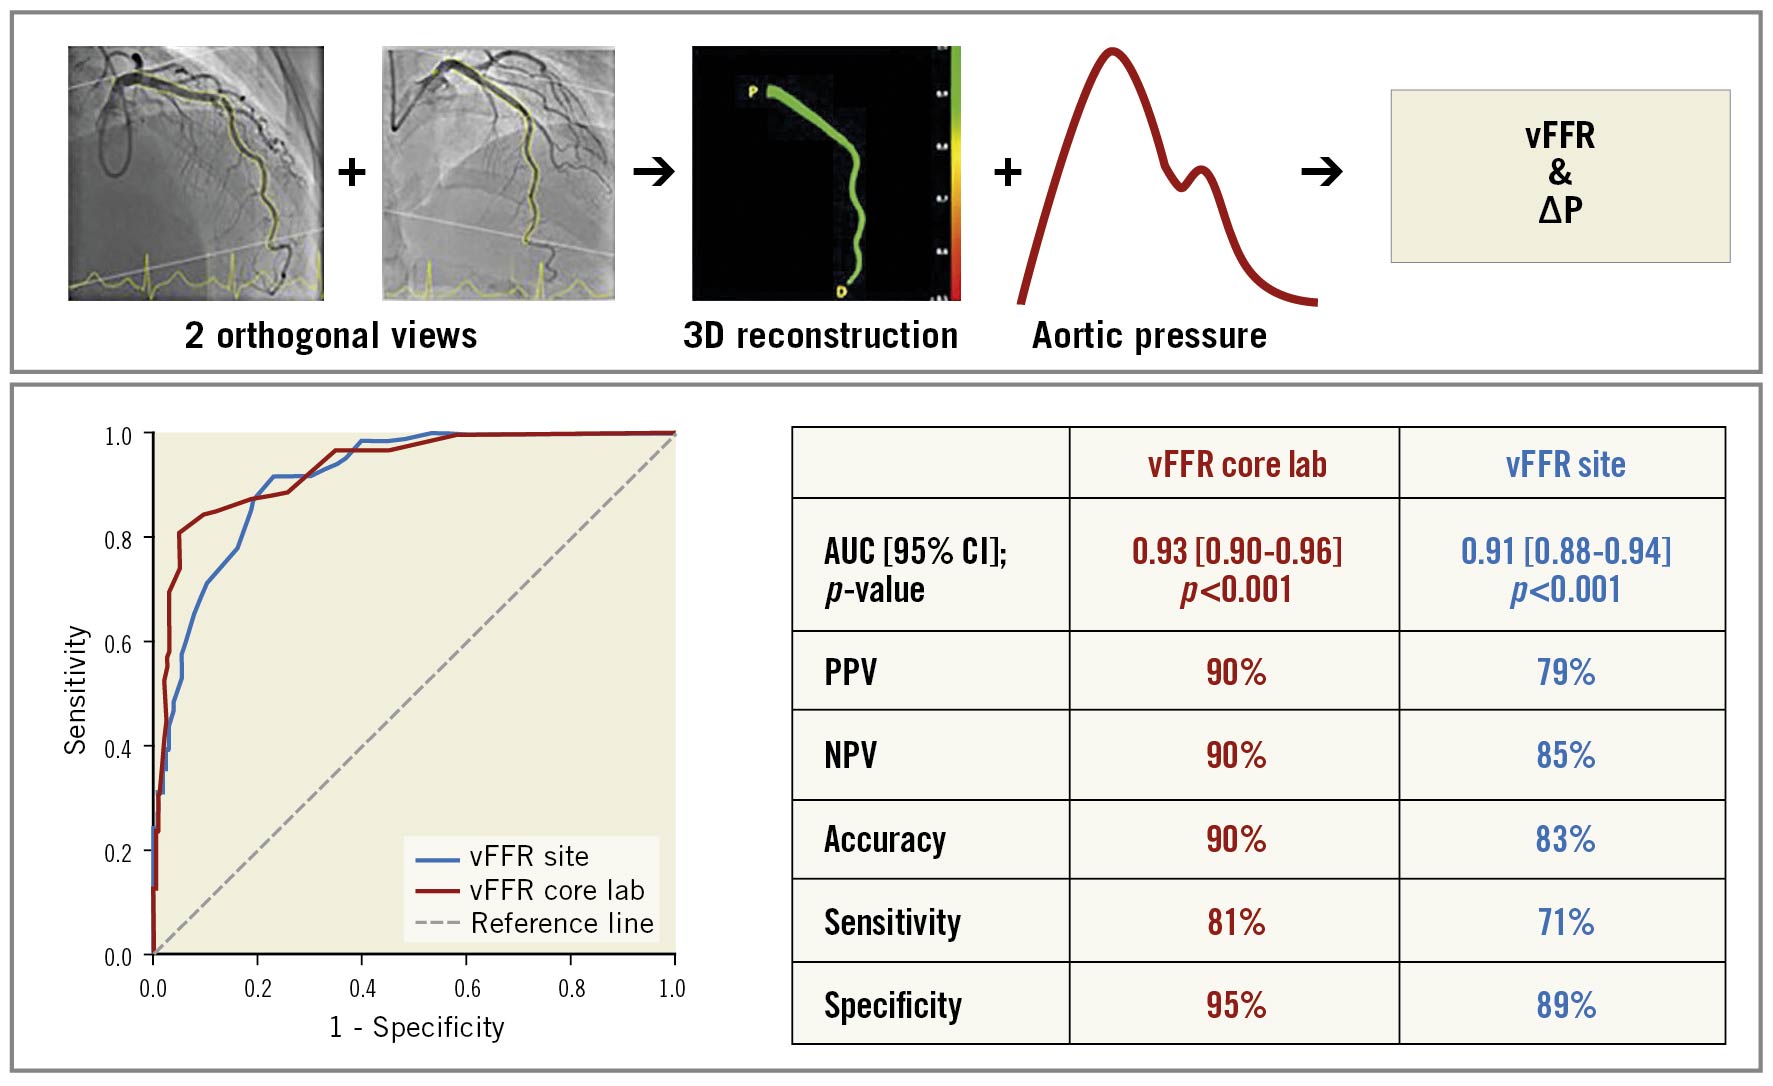
Central illustration. Vessel FFR calculation and the diagnostic performance of vFFR. NPV: negative predictive value; PPV: positive predictive value; vFFR core lab: vFFR calculated by independent core lab; vFFR site: vFFR calculated by participating centres.
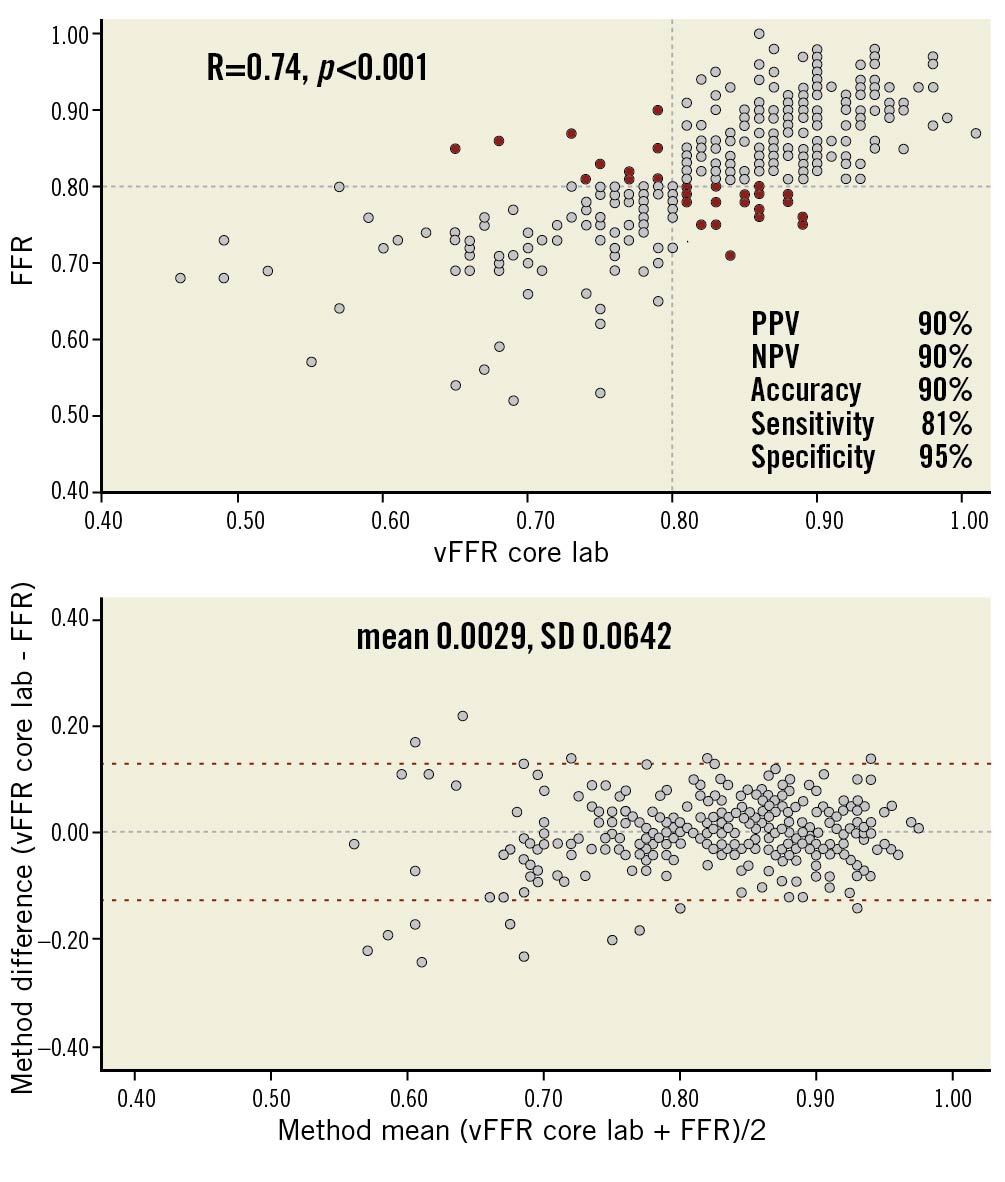
Figure 4. Scatter plots showing the relationship between core lab vFFR vs pressure wire-based FFR and Bland-Altman plots of differences against the means. The mean bias is represented by the dashed grey line and the 95% confidence interval is represented by the dashed red lines. Grey dots represent true positive and true negative vFFR while red dots represent false positive and false negative vFFR.
Similar findings were observed comparing on-site vFFR to invasive FFR ≤0.80 (AUC: 0.91; 95% CI: 0.8 8-0.94). Using a cut-off value of ≤0.80 for vFFR, sensitivity, specificity, PPV, NPV, and diagnostic accuracy were 71%, 89%, 79%, 85%, and 83%, respectively (Figure 3). A good correlation was found between site-reported vFFR and pressure wire-based FFR (R=0.76; p<0.001) with a mean bias of 0.0057±0.0666 (Figure 5).
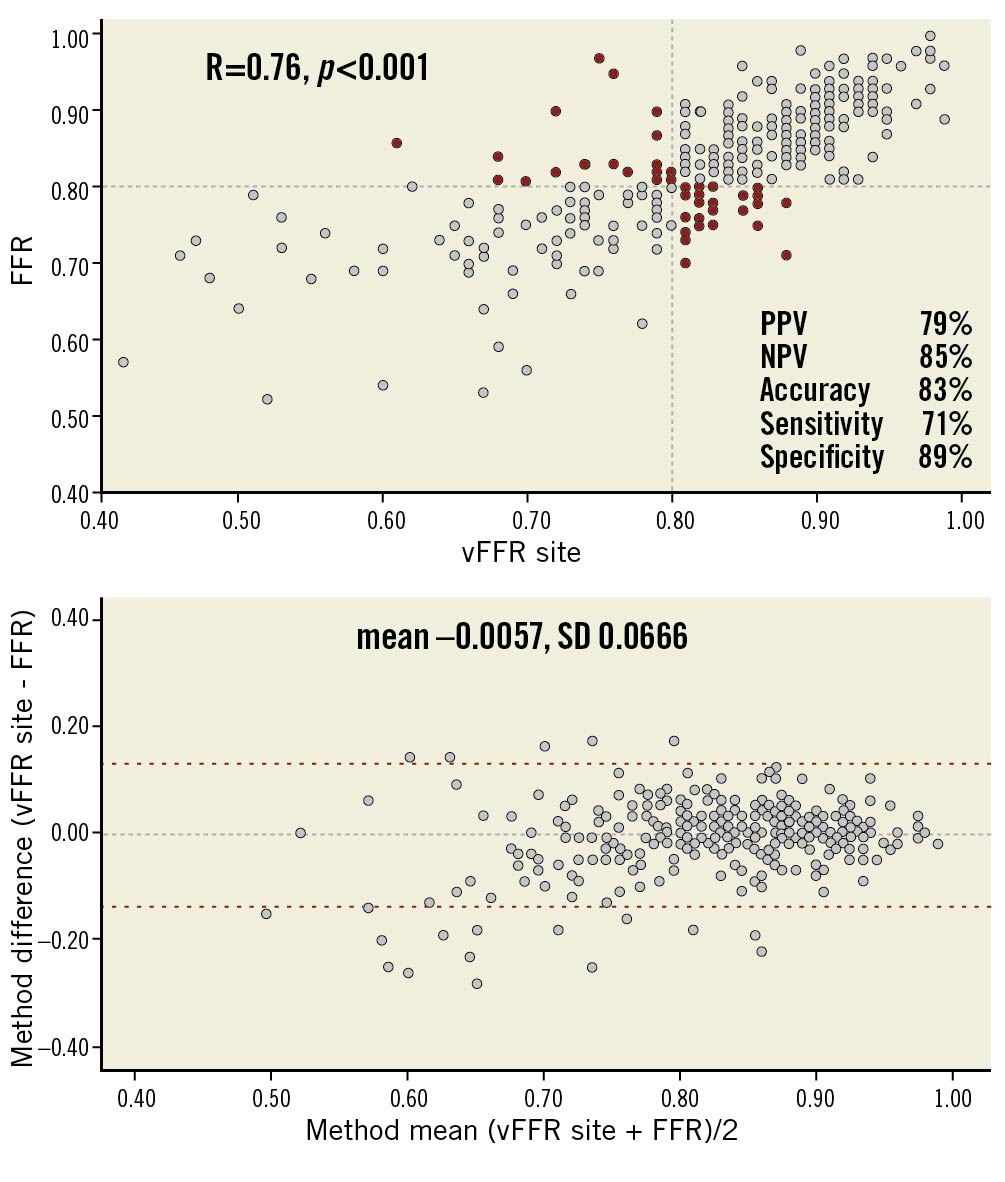
Figure 5. Scatter plots showing the relationship between site vFFR vs pressure wire-based FFR and Bland-Altman plots of differences against the means. The mean bias is represented by the dashed grey line and the 95% confidence interval is represented by the dashed red lines. Grey dots represent true positive and true negative vFFR while red dots represent false positive and false negative vFFR.
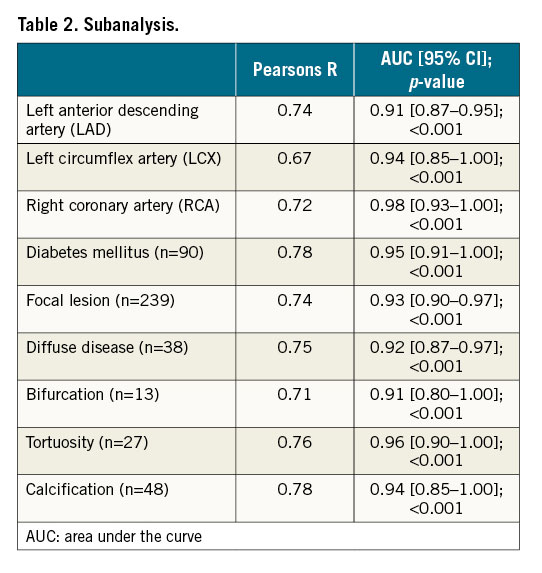
A strong correlation was observed between the core lab vFFR and the on-site vFFR (R=0.87; p<0.001). Additional sub-analyses in specific lesion and patient subsets showed consistent correlation figures: LAD (R=0.74), diabetic patients (R=0.78), focal lesions (R=0.74), diffuse disease (R=0.75), bifurcation (R=0.71) and calcified lesions (R=0.78) for core lab vFFR versus invasive FFR (Table 2).
Discussion
The FAST II (Fast Assessment of STenosis severity) study was a prospective observational international multicentre study demonstrating an excellent diagnostic performance of 3D-QCA-based vessel FFR (vFFR) in identifying a positive pressure wire-based FFR with high sensitivity, specificity, NPV and PPV. Additionally, vFFR correlated well to pressure wire-based FFR.
The present study thereby confirms and strengthens the findings of the retrospective single-centre FAST I and FAST Extend studies in a prospective multicentre fashion with the use of a blinded core lab7,8. With consistent correlation and diagnostic accuracy figures among all three studies, vFFR has been proven to be a powerful diagnostic alternative to invasive pressure wire-based physiological lesion assessment and supports the uptake of 3D-angiography-based FFR in general.
In recent years, a number of 3D-QCA-based FFR indices have been validated and have shown consistent and comparable correlation and diagnostic accuracy figures with pressure wire-based FFR as a reference. Having the use of simplified computational fluid dynamics as the common denominator in their functionality, significant differences should be noted in the workflow of each of the indices and software packages. As such, quantitative flow ratio (QFR) (QFR; QAngio XA 3D prototype; Medis Medical Imaging), with the largest body of evidence to date, is based on frame counting and contrast flow modelling on a per vessel basis13,14,15,16,17. Conversely, FFRangio (Cathworks) is based on rapid flow analysis for the functional angiographic mapping of the entire coronary tree, a workflow that is more time-consuming as compared to indices with a per vessel approach18. The issue of speed of use was recently addressed in the recently published FLASH-FFR study which demonstrated the diagnostic performance of coronary angiography-derived FFR (FlashAngio caFFR System; RainMed Medical), a more recent computational pressure-fluid dynamics-derived FFR19. The authors reported a total operation time of less than five minutes with less than one minute computation time. No mention was made about the operational time in the FAST-FFR Study by Fearon et al18 while Westra et al reported a median time to calculate QFR of five minutes which was shorter than the time to complete pressure wire-based FFR (seven minutes)14. All in all, the value of computation time for a measurement that was not used for clinical decision making in single arm observations remains questionable.
As compared to other available angiography-based FFR technologies, vFFR, as calculated by the CAAS workstation, may offer advantages. At first, and in contrast to FFRangio, vFFR allows physiological lesion assessment of a specific target segment or vessel of interest, precluding the need to perform an assessment of the full cardiac tree. vFFR reduces the total number of dedicated and suitable angiographic images needed to adequately construct the 3D vessel geometry thereby saving time, contrast and radiation. Second, the vFFR algorithm applies automated and harmonised optimal end-diastolic frame selection in the two orthogonal projections by ECG triggering. This automated process saves time in finding and harmonising optimal frames. Third, vFFR uses the readily available aortic root pressure as a boundary inlet condition without the need for contrast flow modelling using manual frame counting (QFR). Fourth, vFFR allows highly accurate contour detection, as demonstrated by the low percentage (9.3%) of contouring that needs to be manually corrected due to, for example, vessel overlap or suboptimal contrast opacification. The present study is thereby the first to report these figures as no data are available on the time and amount of necessary manual contour corrections by any of the alternative angiography-based FFR technologies.
With respect to interobserver variability, we demonstrated in the FAST I study a very low interobserver variability (r=0.95; p>0.001)7. In the present study, we were able to confirm a low variability in the vFFR assessment as performed by a blinded core lab or by independent local personnel in the six individual participating centres (r=0.87; p<0.001). These promising results indicate the reliability of physiological lesion assessment using vFFR by trained local site personnel in the absence of a well-trained core lab.
Previous studies on alternative angiography-based FFR technologies included only a limited number of bifurcations, calcifications, tandem lesions and tortuosity and, in some cases, even excluded vessels with diffuse disease18. In the present study, the correlation between vFFR with pressure wire-based FFR as a reference proved to be consistent among a broad range of specific patient and lesion subsets, providing evidence for the applicability of the technologies in a broad range of patients and lesions.
Finally, sample size calculations for the present study were based on a rate of 42% positive FFR values in the FAST I study whereas in the present study, only 36% of FFR values were positive. In the present study, the sensitivity, specificity and diagnostic accuracy of vFFR with a threshold of 0.83 were 88%, 80% and 83%, respectively, to detect an FFR ≤0.80. In the meantime, FAST Extend identified vFFR ≤0.80 as the most optimal binary cut-off8. Also in the present study, taking a vFFR threshold of ≤0.80, the diagnostic accuracy increased from 83% (with a threshold 0.83) to 90% with sensitivity and specificity figures of 81% and 95%, respectively. Of note, only 1 of 334 cases with an FFR <0.75 had a core lab-defined vFFR >0.80, further strengthening the sensitivity figures in the present study.
Addressing the need for larger clinical outcome trials, the coronary angiography-based vessel Fractional Flow Reserve for Fast Physiologic Assessment of Stenosis severity (FAST III trial, NCT04931771) will randomise 2,228 patients to vFFR vs invasive FFR with a one year patient-oriented clinical endpoint.
Limitations
Some study limitations must be mentioned. First, the vFFR calculation was done offline, which means that its feasibility during the procedure remains unclear. Furthermore, the accuracy of the technique is strongly dependent on the quality of the angiographic cine-images; image acquisition should meet the criteria of non-overlapping images with at least 30° difference in angulation. Although these are prerequisites that theoretically should be fulfilled in all preprocedural angiographies, previous studies showed that up to 65% of routine angiograms are of insufficient quality to be used in angiography-based FFR software due to insufficient luminal contrast opacification, overlap, or lack of adequate orthogonal views. The present study, however, demonstrated that with adequate site training the percentage of analysable angiograms as identified by a dedicated core lab could go up to 88%. Finally, adequate and objective registration of the time needed to perform offline vFFR computation in the present study was not considered feasible and, as such, we refrained from reporting vFFR computation times. Comparative procedure time associated with FFR vs vFFR will be reported in the upcoming randomised FAST III trial.
Conclusions
3D-QCA-based vessel FFR, as calculated by either a blinded core lab or site personnel, correlates well with pressure wire-based FFR and has an excellent diagnostic performance to detect FFR ≤0.80.
Impact on daily practice
FFR-guided decision making is still underused in real-world practice. Using vFFR offers a less invasive alternative to the haemodynamic assessment of lesion severity. By discarding hyperaemic agents and perhaps event invasive devices in general, the arguments for not using physiological assessment become scarcer every day.
Conflict of interest statement
Z. Ali received grants from Abbott Vascular, Cardiovascular Systems Inc., personal fees from Amgen, AstraZeneca and Boston Scientific, and equity from Shockwave Medical, outside the submitted work. N. Van Mieghem received research grant support from Abbott Vascular, Boston Scientific, Edwards Lifesciences, Medtronic, PulseCath BV, Abiomed, Daiichi Sankyo, and Pie Medical. J. Daemen received institutional grant/research support from AstraZeneca, Abbott Vascular, Boston Scientific, ACIST Medical, Medtronic, MicroPort, Pie Medical, and ReCor Medical. N. Tanaka serves as a consultant for Abbott Medical Japan, Kaneka Medix, and Boston Scientific Japan. The other authors have no conflicts of interest to declare.
Supplementary data
To read the full content of this article, please download the PDF.