Abstract
Aims: Despite the fact that fractional flow reserve (FFR) is better than angiography in guiding PCI, in the real world the choice to perform PCI is generally based on angiography. Three-dimensional quantitative coronary angiography (3D-QCA) may increase the accuracy of angiography, especially in intermediate coronary artery stenosis (ICAS). The aim of the study was to assess the best cut-off values of area stenosis % (AS%) and the extent of jeopardised myocardium for predicting FFR and for excluding the need to perform FFR.
Methods and results: FFR, AS% and Myocardial Jeopardy Index (MJI) were assessed in 211 ICAS. MJI (β=-0.36; p=0.001), AS% (β=-0.35; p=0.001) and presence of a chronic total occlusion (CTO) (β=-0.15; p=0.01) were independent predictors of FFR. In patients without CTO (174 lesions), the best cut-offs for the detection of FFR ≤0.80 for AS% and MJI were 61% (AUC=0.76; p<0.001) and 30% (AUC=0.71; p<0.001), respectively. More importantly, the cut-offs of AS% safely to exclude (100% sensitivity) an FFR ≤0.80 were 40% (AUC=0.85, p<0.001) for an MJI ≥30% and 50% (AUC=0.70, p<0.04) for an MJI <30%, respectively.
Conclusions: AS%, MJI and the presence of a CTO predicted FFR values. 3D-QCA in addition to MJI allows the safe exclusion of FFR ≤0.80, limiting FFR assessment to doubtful cases with considerable reduction of costs.
Abbreviations
AS%: percentage area stenosis
CTO: chronic total occlusion
DS%: percentage diameter stenosis
FFR: fractional flow reserve
ICAS: intermediate coronary artery stenosis
MJI: Myocardial Jeopardy Index
MLA: minimal lumen area
MLD: minimal lumen diameter
PV%: percentage plaque volume
3D-QCA: three-dimensional quantitative coronary angiography
Introduction
Fractional flow reserve (FFR), which is derived from the ratio between distal and proximal pressures under conditions of maximal hyperaemia, has progressively emerged as a powerful tool to identify ischaemia-inducing lesions and to guide PCI1,2.
Despite the relative increase of FFR-guided PCI, in everyday practice the vast majority of decisions about coronary revascularisation are taken on visual estimation of angiography3, which relies on subjective evaluation by the operator and often overestimates stenosis severity in comparison to quantitative coronary angiography4.
Three-dimensional quantitative coronary angiography (3D-QCA) uses standard images acquired during coronary angiography to reconstruct a 3D model of a coronary artery by fusing two or more orthogonal angiographic images5. 3D-QCA measurements can be performed on existing standard coronary angiography images without the need for additional time or equipment during the procedure and could potentially overcome some well-known limitations of standard angiography such as foreshortening6,7 and lesion eccentricity8. Consequently, 3D-QCA may increase the accuracy of angiography, especially in intermediate coronary artery stenosis (ICAS), limiting FFR use only to doubtful cases. However, the absence of standardised 3D-QCA lesion-related cut-off values to guide PCI has limited its current use in the cathlab.
The aim of the present study was to assess the best cut-off values of 3D-QCA parameters in predicting FFR in ICAS, particularly in relation to the amount of jeopardised myocardium subtended by the stenosis, which is known to affect the physiological significance of coronary stenoses9.
Methods
PATIENTS
We retrospectively identified 225 consecutive patients in the FFR database of two tertiary referral hospitals (Agostino Gemelli Hospital, Catholic University of the Sacred Heart, Rome, Italy, and John Radcliffe Hospital, Oxford, UK) with de novo evidence of at least one angiographically identified ICAS (40% to 80% diameter stenosis at visual estimation), who underwent FFR evaluation from February 2010 to June 2012.
Clinical exclusion criteria were myocardial infarction within seven days or prior myocardial infarction in the territory supplied by the target vessel, severe valvular heart disease, acutely decompensated chronic heart failure or advanced renal failure (estimated glomerular filtration rate ≤30 ml/min). Angiographic exclusion criteria were more than one ICAS within the target vessel (lesions were considered separate if they were more than three reference vessel diameters apart), lesions on left and right coronary ostia, extremely tortuous coronary arteries, lack of two angiographic projections separated by >30°, coronary artery diffusely diseased with no obvious angiographic reference segment and lesion located in the bypass graft or distally to bypass graft anastomosis. In case of intermediate stenosis located at the site of a true bifurcation (Medina 1,1,1) or not involving the side branch (Medina 1,1,0 or 1,0,0 or 0,1,0), FFR and 3D-QCA analysis was performed on the main branch. Isolated ostial lesions of the side branch (Medina 0,0,1) were excluded due to the inability to perform 3D-QCA for the lack of a reliable proximal reference vessel.
From a total of 225 patients, 15 patients were excluded for clinical exclusion criteria and 27 were excluded due to the inability to perform 3D-QCA analysis. Thus, 183 patients for a total of 211 ICAS were included in the analysis.
All patients gave their informed consent and all procedures were performed in accordance with the Declaration of Helsinki.
ANGIOGRAPHIC ANALYSIS
Coronary angiography was performed by radial or femoral approach in all patients using a non-ionic contrast medium. At least two different angiographic views differing by more than 30° were obtained for each lesion assessed. Coronary stenoses were visually assessed by two independent reviewers (AML and ARDC).
3D-QCA was performed off-line by two skilled angiographers (ARDC and DL), who were blinded to FFR analysis, using dedicated 3D reconstruction software (CardiOp-B system; Paieon Medical, Ltd, Rosh Ha’ayin, Israel). 3D-QCA analysis was performed according to a standardised protocol described in detail elsewhere10. Proximal and distal reference vessel area, lesion length, minimum luminal diameter (MLD), minimal lumen area (MLA), percentage diameter stenosis (DS%), percentage area stenosis (AS%), plaque volume and percentage plaque volume (PV%) were measured.
FRACTIONAL FLOW RESERVE ANALYSIS
After visual assessment of coronary stenoses, the operator chose to perform FFR in case of angiographic ICAS (see above) according to a standardised protocol11, using a 0.014 inch pressure monitoring guidewire (PressureWire™ Certus™; St. Jude Medical, St. Paul, MN, USA, or PrimeWire®; Volcano Therapeutics, Inc., Rancho Cordova, CA, USA). FFR was calculated as the lowest ratio of distal coronary pressure divided by aortic pressure after achievement of maximal hyperaemia, obtained using intravenous or intracoronary adenosine. The femoral or brachial vein was used for intravenous 140 μgkg–1minute–1 adenosine administration, and maximal hyperaemia was assumed after at least 60 seconds in the presence of stable systemic blood pressure decrease compared with baseline remaining for at least 10 beats. For intracoronary adenosine, incremental boli of intracoronary adenosine (60 μg, 300 μg, and 600 μg) were administered, with each dose given at least 60 seconds apart from the previous one or after returning to baseline haemodynamic conditions. The next (higher) dose was not administered in case of atrioventricular block lasting >5 seconds, and intravenous adenosine was used to induce maximal hyperaemia. Similarly, in case of FFR values between 0.81 and 0.83 with 600 μg intracoronary adenosine, FFR was re-tested using intravenous adenosine according to our internal protocol11. Finally, an FFR ≤0.80 was considered abnormal.
QUANTIFICATION OF THE JEOPARDISED MYOCARDIUM
Quantification of the jeopardised myocardium was performed using the Myocardial Jeopardy Index (MJI), which is the score showing the best correlation with FFR9. In brief, the MJI is a well-validated method, coming from the Bypass Angioplasty Revascularization Investigation group, to calculate jeopardised myocardium based on the size and the distribution of the coronary arteries, and it is described in detail elsewhere12. Figure 1 sums up the main steps of the methods adopted in a typical case.
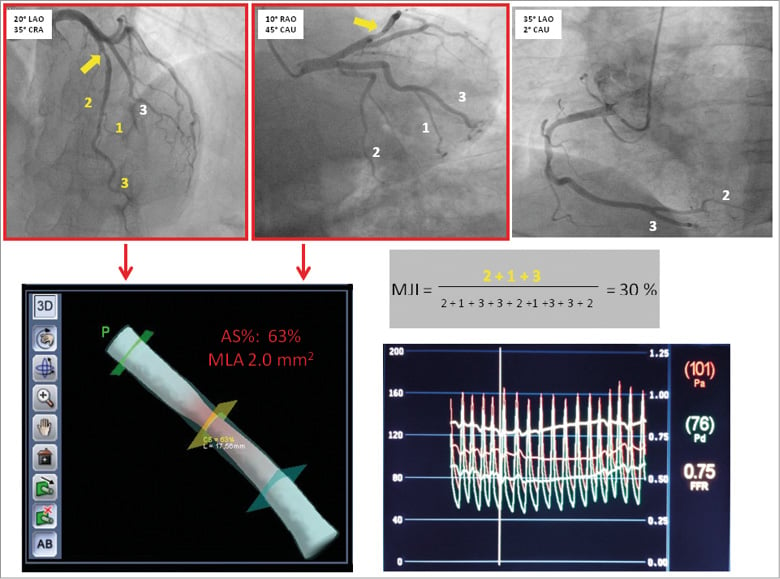
Figure 1. Main steps of methods adopted in the study. At the top of the Figure there are the projections for LAD, Cx and RCA used for calculation of MJI. The intermediate stenosis is highlighted by a yellow arrow. The first two projections, with red borders, were used for 3D reconstruction and measurement of MLA and AS% (bottom of the Figure, left side). At the bottom of the Figure, right side, the FFR value obtained for the index lesion is reported.
STATISTICAL ANALYSIS
Continuous variables were expressed as mean and (±) standard deviation (SD) or as median accompanied by interquartile range (IQR), as appropriate. Normal distribution was tested by the Shapiro-Wilk test. Common logarithmic transformation was applied in order to allow the use of parametric tests. After transformation, a paired samples t-test was performed to compare continuous variables. Categorical variables were expressed as percentages and analysed using Fisher’s exact test, as appropriate. Correlations between MLA, AS%, PV%, lesion length, MJI and FFR values were assessed by Pearson’s r correlation coefficient.
In order to identify the main independent predictors of FFR values, a linear logistic regression model was used. Initially, a univariate exploratory analysis was performed, comparing 3D-QCA parameters with variables potentially related to FFR, including the presence of a coronary chronic total occlusion (CTO), MJI, diabetes mellitus, hypertension, and acute coronary syndrome9,13. Of note, MLA, MLD and DS% were not considered in the model because they are strictly related to AS%. Afterwards, only those variables with a probability value <0.05 were entered en bloc into the multivariate model, with age and gender as background variables.
Receiver operating curves (ROC) were analysed to assess the best cut-off values of MJI, AS% and MLA which predicted an FFR value ≤0.80 with maximal accuracy. The optimal cut-off was calculated using the Youden index. For each cut-off value the sensitivity, specificity, positive predictive value and negative predictive value were calculated.
All the statistical analysis, with the exception of receiver operating curve analysis (performed using MedCalc; MedCalc, Mariakerke, Belgium), was performed using SPSS 17.0 (SPSS, Inc., Chicago, IL, USA) and p-values <0.05 were considered statistically significant.
Results
PATIENT AND LESION CHARACTERISTICS
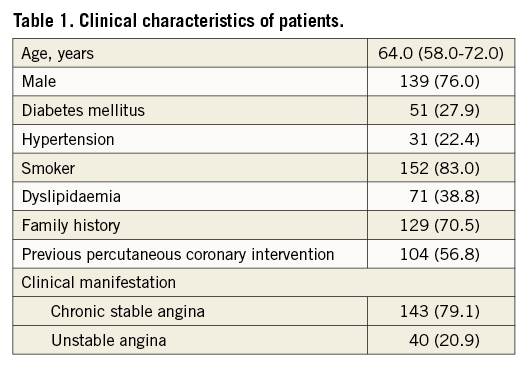
FFR and 3D-QCA were calculated on 211 ICAS in 183 patients. The main clinical characteristics of patients are summarised in Table 1. Angiographic and 3D-QCA data of the 211 intermediate stenoses are subdivided according to a cut-off FFR value ≤ or >0.80 in Table 2.
The extent of jeopardised myocardium expressed as MJI was significantly higher in ICAS presenting an FFR value ≤0.80 than in those with an FFR value >0.80 (37.0% [27.0-43.0] vs. 26.0% [21.0-36.0], p<0.001) (Table 2).
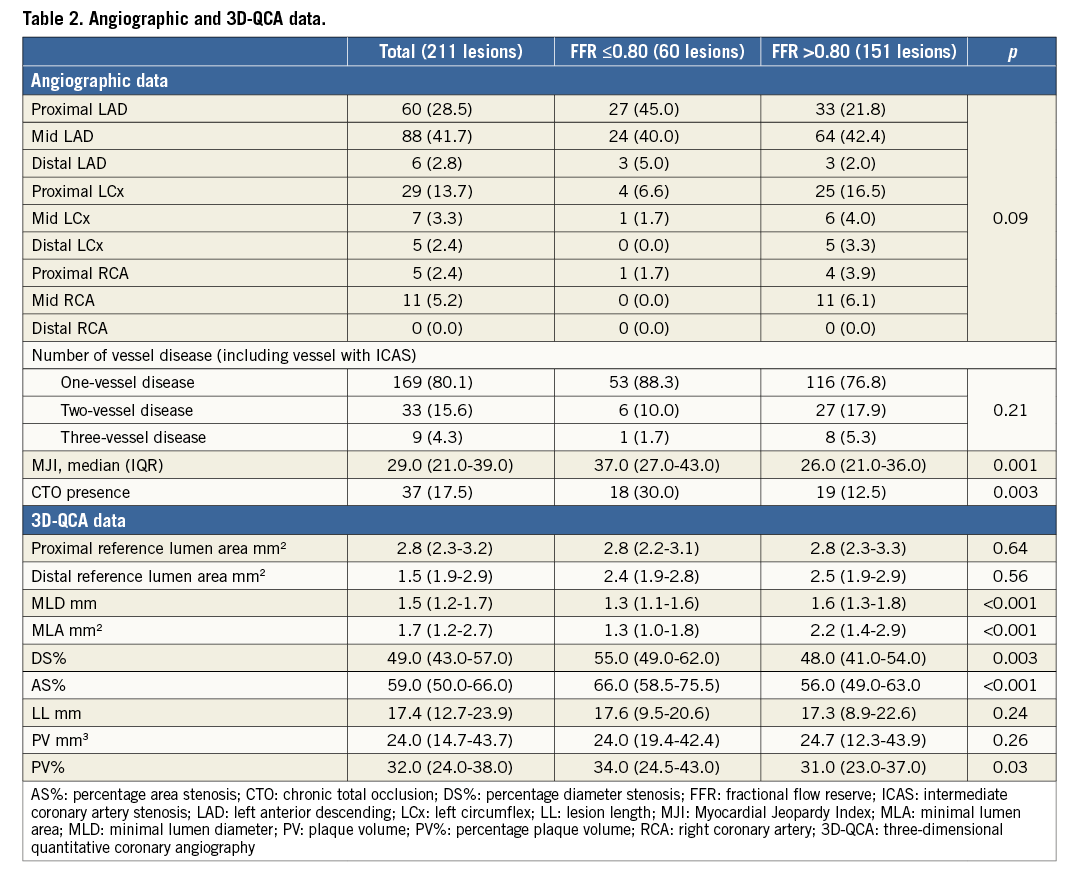
Of note, 17.5% of all ICAS was detected in patients with evidence of a collateralised CTO and, interestingly, CTO occurrence was significantly higher in patients with ICAS presenting an FFR value ≤0.80 than in those with an FFR value >0.80 (30.0% vs. 12.5%, p=0.003). Among all 3D-QCA parameters, MLD, MLA, DS%, AS% and PV% significantly differed in ICAS with an FFR value ≤0.80 in comparison to those with an FFR value >0.80 (Table 2).
CORRELATIONS OF FFR WITH 3D-QCA PARAMETERS AND WITH THE EXTENT OF JEOPARDISED MYOCARDIUM
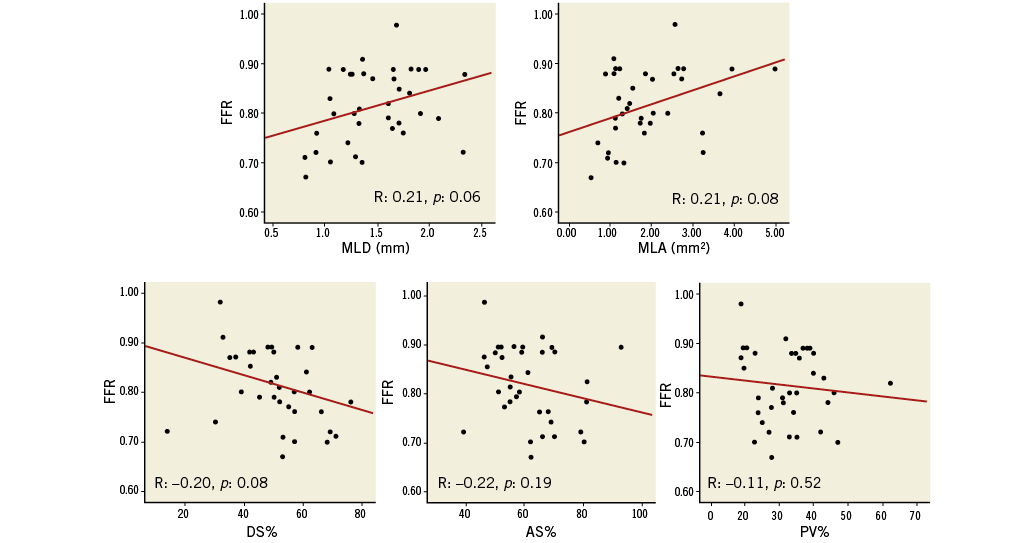
In the 211 ICAS, FFR values were significantly correlated to 3D-QCA parameters of stenosis severity (MLD: r=0.27, p<0.001; MLA: r=0.36, p<0.001; DS% r=-0.45, p<0.001; AS%: r=-0.38, p<0.001; PV%: r=-0.22, p=0.002) (Figure 2, Table 3). Correlations between FFR values and 3D-QCA parameters were not significant in the 37 ICAS with a concomitant presence of a collateralised CTO (Online Figure 1, Table 3), being, on the contrary, significant in the 174 ICAS without a concomitant presence of a collateralised CTO (Figure 3, Table 3). This was evident despite no differences being observed in terms of diameter stenosis, MLA, AS%, lesion length, PV and PV% between lesions with and without a simultaneous presence of a collateralised CTO (data not shown).
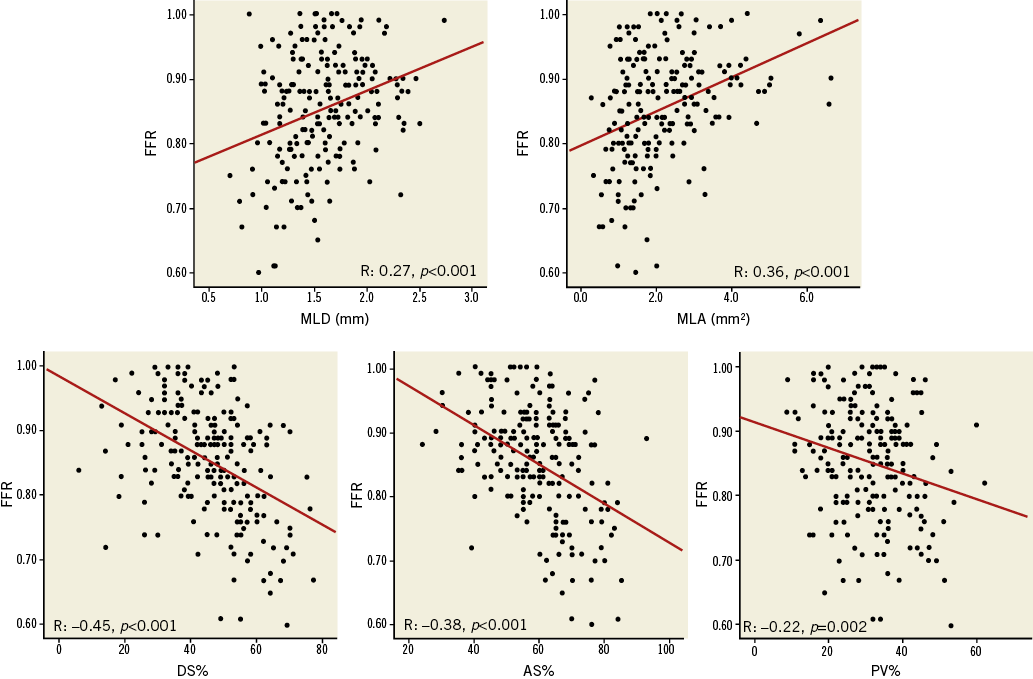
Figure 2. Correlations between 3D-QCA parameters and FFR in all 211 ICAS.
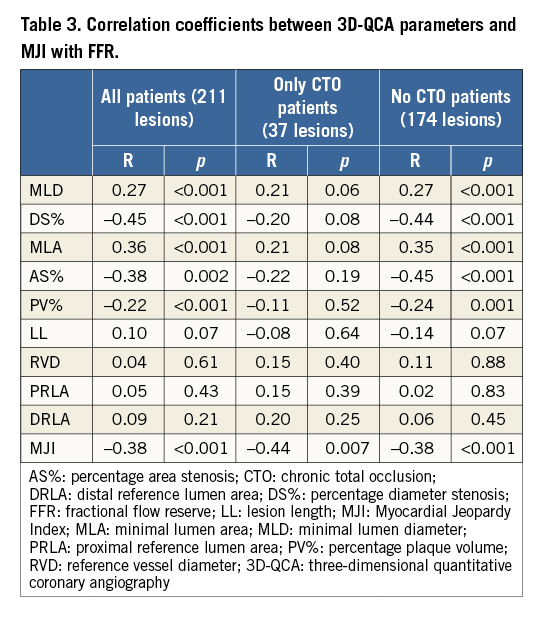
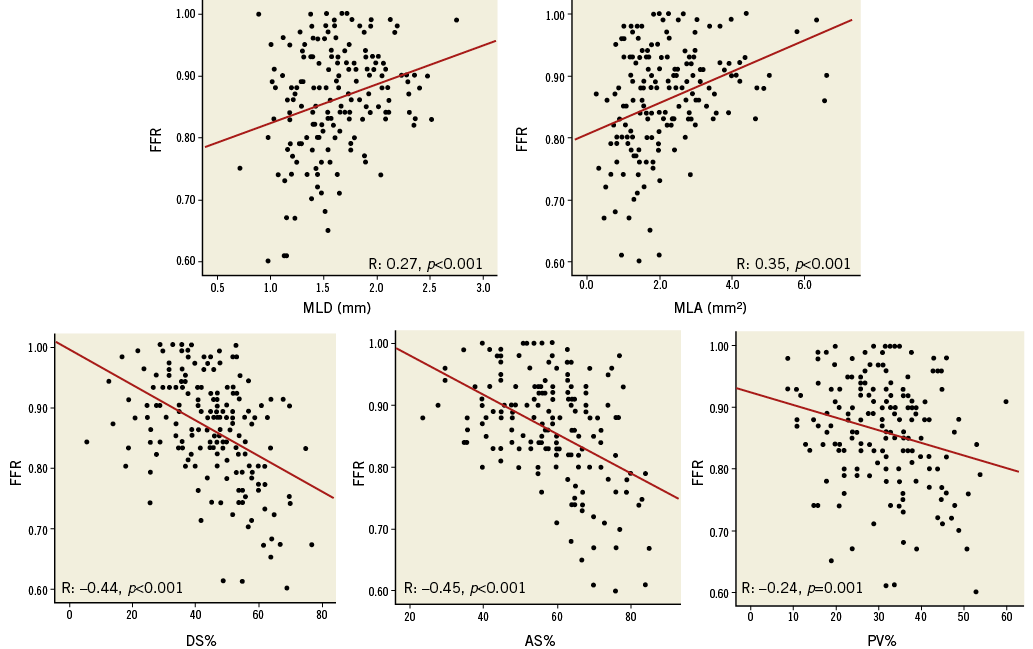
Figure 3. Correlations between 3D-QCA parameters and FFR in 174 ICAS after exclusion of ICAS with concomitant collateralised CTO.
In the 211 lesions FFR values were also significantly correlated with the MJI (r=–0.38, p<0.001), and this correlation remained significant both in patients with CTO (r=–0.44, p=0.007) and without CTO (r=–0.38, p<0.001) (Figure 4, Table 3).
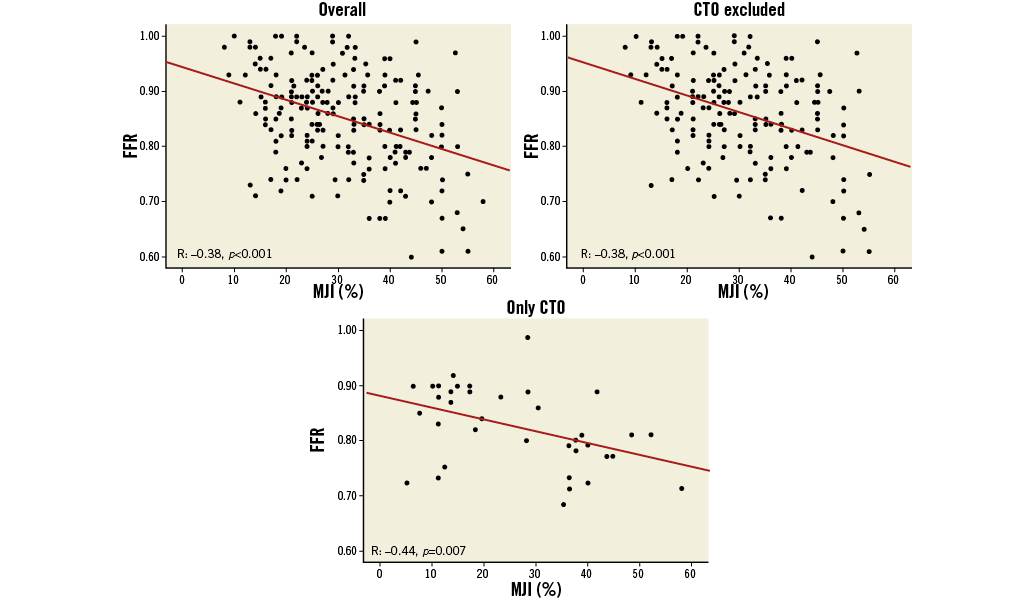
Figure 4. Correlations between MJI and FFR in all 211 ICAS, in 174 ICAS without concomitant collateralised CTO and in 37 ICAS with concomitant collateralised CTO.
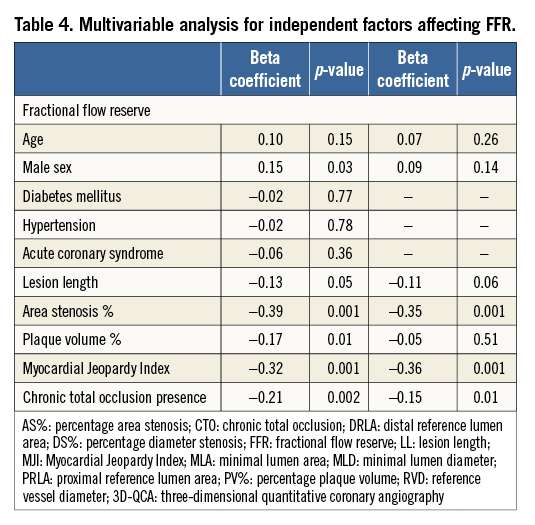
At multivariate analysis only the MJI (β=–0.36; p=0.001), AS% (β=–0.35; p=0.001) and the presence of a concomitant collateralised CTO (β=–0.15; p=0.01) were independent predictors of FFR, explaining 32% of its variability (R2=0.32; p=0.001) (Table 4).
ROC CURVE ANALYSIS
In the 211 lesions at ROC curve analysis for detection of an FFR value ≤0.80, AS% presented an area under the curve (AUC) of 0.76 (95% CI: 0.69-0.81; p<0.001), with a 78% sensitivity and 66% specificity, at a cut-off value of ≥60% (Online Figure 2). MLA had an AUC of 0.76 (95% CI: 0.70-0.82; p<0.001), with a 90% sensitivity and 57% specificity at a cut-off value of ≤2.0 mm2 (Online Figure 3). Finally, MJI had an AUC of 0.71 (95% CI: 0.64-0.77; p<0.001), with a 75% sensitivity and 62% specificity at a cut-off value of ≥30% (Online Figure 4).
Since in ICAS with the concomitant presence of a CTO no correlation between FFR and 3D-QCA parameters was found, ROC analysis for AS%, MLA and MJI was repeated on 174 intermediate lesions without a concomitant collateralised CTO. Of note, AUC values increased for both AS% (0.83 [95% CI: 0.76-0.88; p<0.001]) (Online Figure 5) and MLA (0.79 [95% CI: 0.73-0.85; p<0.001]) (Online Figure 6) with improved sensitivity and specificity, while no changes were observed for MJI (0.70 [95% CI: 0.61-0.76; p<0.001]) (Online Figure 7).
Finally, since AS% presented the highest AUC for the detection of FFR ≤0.80, ROC analysis was repeated for AS% after dividing the 174 lesions without CTO according to an MJI score ≥30 or <30% (cut-off value obtained from the previous ROC analysis). In both subgroups (MJI ≥30% and MJI <30%) an AS% cut-off value with a 100% sensitivity was calculated: in the subgroup of lesions with an MJI ≥30%, AS% presented an AUC of 0.85 (95% CI: 0.75-0.92; p<0.001), with a 100% sensitivity and 16% specificity, at a cut-off value of ≥40% (Figure 5). Conversely, in the subgroup of lesions with an MJI <30%, AS% presented an AUC of 0.70 (95% CI: 0.56-0.77; p=0.04), with a 100% sensitivity and a 32% specificity, at a cut-off value of ≥50% (Figure 6).
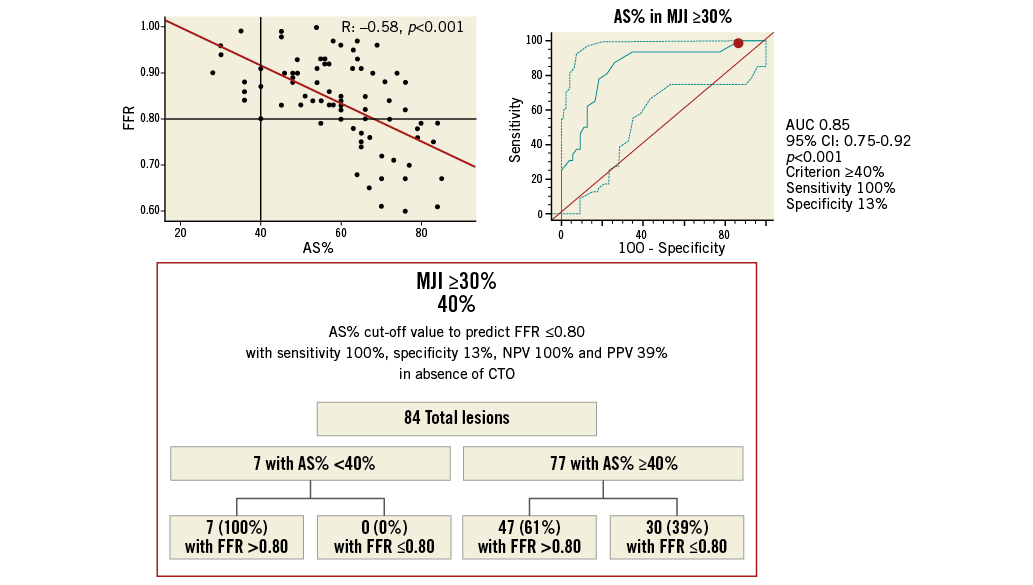
Figure 5. Best AS% cut-off value in ICAS subtending an MJI ≥30% for prediction of FFR ≥0.80 with a 100% sensitivity and 100% positive predictive value. Scatter plot (on the left) shows as AS% ≥40%, obtained from ROC analysis (on the right), allowing the exclusion of cases with FFR ≤0.80 below this cut-off. The chart (at the bottom) shows sensitivity, specificity, NPV and PPV by the application of this cut-off. NPV: negative predictive value; PPV: positive predictive value
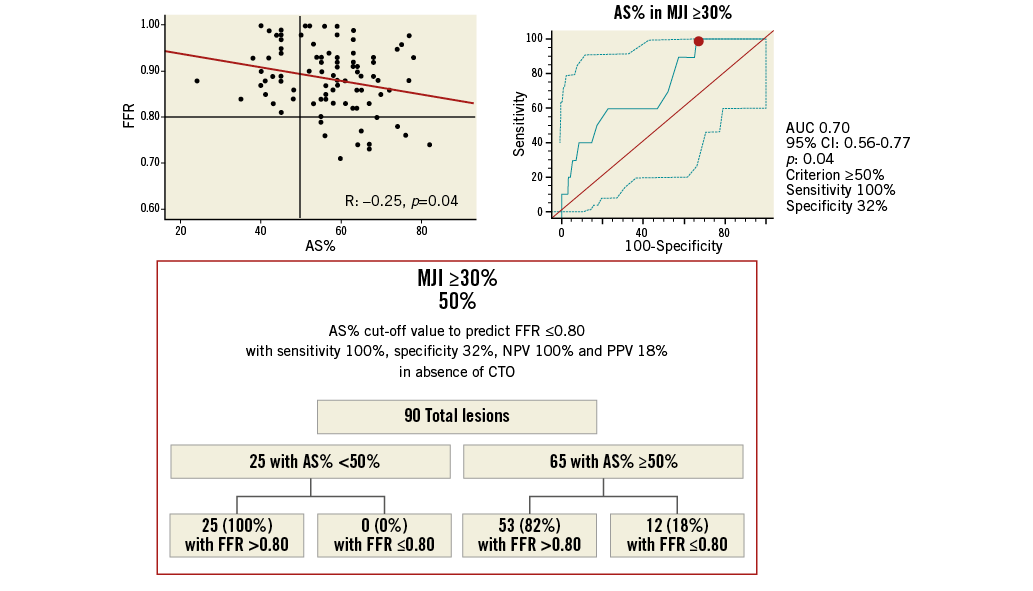
Figure 6. Best AS% cut-off value in ICAS subtending an MJI <30% for prediction of FFR ≥0.80 with a 100% sensitivity and 100% positive predictive value. Scatter plot (on the left) shows as AS% ≥50%, obtained from ROC analysis (on the right), allowing the exclusion of cases with FFR ≤0.80 below this cut-off. The chart (at the bottom) shows sensitivity, specificity, NPV and PPV by the application of this cut-off. NPV: negative predictive value; PPV: positive predictive value
Discussion
In the present study we aimed to assess the correlation between 3D-QCA parameters and FFR values, particularly in relation to the amount of jeopardised myocardium in the presence of coronary stenoses judged to be intermediate on visual assessment. Our results confirm the moderate correlation between anatomic and functional measures in the assessment of ICAS, while an important role in the physiological significance of a stenosis is represented by the amount of jeopardised myocardium. More importantly, our study shows that the combined use of 3D-QCA, which can increase diagnostic accuracy in comparison to conventional coronary angiography, and MJI, for the quantification of the amount of jeopardised myocardium subtended by the stenosis, allows the safe exclusion of the need for FFR, the current gold standard in the evaluation of stenosis severity, in a sizeable proportion of patients with intermediate stenoses.
FFR has gained a primary role in the assessment of the functional significance of ICAS. Of note, current ESC Guidelines recommend performing FFR in the absence of clear evidence of lesion-related inducible ischaemia (Class I, Level of evidence A)14. In spite of this recommendation, in the real world FFR continues to be underutilised: in Italy less than 3% of all coronary angiography is followed by FFR assessment15 and, in other countries, for several reasons including constraints of reimbursement, the situation is not substantially better16.
In this scenario, clinical decisions, including performing PCI, are often taken solely on the basis of a coronary angiogram. For this reason, the possibility to improve the diagnostic accuracy of coronary angiography using 3D-QCA has gained a wide interest among interventional cardiologists. In general, QCA was introduced to overcome the subjectivity of visual estimation; in addition, by combining information from two projections, 3D-QCA can overcome the two main limitations of 2D-QCA, represented by underestimation of lesion length6 and overestimation of lesion area stenosis severity17. The first pitfall of 2D-QCA is mainly related to foreshortening and out-of-plane magnification, particularly relevant when assessing a curved and tortuous coronary segment8. On the other hand, by only using the projection in which the target lesion shows the highest stenosis degree, 2D-QCA can easily overestimate stenosis severity, especially in case of eccentric lesions8-17. Consequently, in the last 10 years, evidence has accumulated that 3D angiographic reconstruction is accurate, sensitive, and reproducible18. A few studies with small sample sizes have compared 3D-QCA systems with more objective measurements of stenosis severity19,20 or functional significance21. Interestingly, although good concordance has been found between 3D-QCA and intravascular ultrasound, Yong et al reported only moderate correlations between 3D-QCA measures and FFR, questioning again the possibility of having reliable anatomic cut-offs predicting functional significance of an ICAS21. Our data expand the findings of Yong et al in a much larger population: we found that measures indicating anatomic severity of narrowing, including MLD, MLA, DS% and also AS%, were only moderately correlated per se to FFR values, suggesting that other factors, including the presence of a CTO and more generally the amount of jeopardised myocardium, can be important in determining the functional significance of ICAS.
In the present study, we found that the concomitant presence of a collateralised CTO significantly influenced FFR values, further reducing the correlation between anatomic and functional measures9. Indeed, the exclusion of patients with concomitant CTO made the correlation between FFR and 3D-QCA measures somewhat stronger. Even so, the correlation between AS% (or even MLA) and FFR values was moderate, suggesting that other factors, such as the maximal achievable myocardial blood flow and consequently the extent of myocardium subtended by a stenosis, could participate in determining a functionally significant stenosis. We recently demonstrated that MJI , by allowing a semi-quantitative evaluation of the percentage of myocardium subtended by a stenosis, is an independent predictor of FFR ≤0.809. In the present study, we expand our experience by identifying, at the ROC curves, a cut-off of MJI ≥30% that makes an FFR ≤0.80 more probable. Similarly, the analysis of the ROC curves showed that the best cut-offs for MLA and AS% were 2.0 mm2 and 61%, respectively. However, these cut-offs showed limited sensitivity and specificity, suggesting again that anatomic measures are not substitutes for functional assessment with FFR. Regarding anatomic cut-offs, recently Waksman et al, in the FIRST study comparing FFR with IVUS, showed the inadequacy of the “magic number” of 4 mm2 in MLA and, in the discussion, claimed the use of vessel-specific MLA cut-offs22. However, both using stringent lesion-specific cut-offs and the more liberal cut-off of 4 mm2, not only were a large number of anatomically significant lesions functionally insignificant, as expected, but, more importantly, a relevant number of functionally significant stenoses had MLA values above 4 mm2. This could underline not only that AS%, incorporating the measure of the reference vessel, could be more accurate than the MLA in predicting the functional significance of an ICAS (as resulted in our study) but also, notably, that no single anatomic measure can substitute functional assessment using FFR21. Nevertheless, by combining MJI and 3D-QCA, we could identify anatomic cut-offs that can safely exclude the need for FFR assessment. Specifically, after the exclusion of patients with CTO, in which correlation between AS% and FFR values is particularly weak, we identified an AS% cut-off of 40% for an MJI ≥30% and an AS% cut-off of 50% for an MJI <30%, beneath which no significant FFR was detectable. In summary, the lower the extent of the myocardium underlying the stenosis, the higher is the severity of a stenosis in order for it to be functionally significant.
We have summarised our results in an algorithm that could help in deciding when to use FFR, limiting this technique to those cases with a reasonable probability of an FFR ≤0.80 (Figure 7). First, given the scarce correlation in the presence of a collateralised CTO, we suggest excluding all patients showing a CTO. In these cases, FFR should always be performed, especially if CTO recanalisation is not planned22. Second, assess MJI. In the presence of an MJI ≥30%, a 3D-QCA-based AS% <40% allows the safe exclusion of the need of FFR, while an AS% ≥40% requires FFR assessment (with a 38% probability in our experience of an FFR ≤0.80). Conversely, in the presence of an MJI <30%, while a 3D-QCA-based AS% <50% allows the safe exclusion of the need of FFR, an AS% ≥50% should be followed by FFR assessment (with a 20% probability in our experience of an FFR ≤0.80). According to our data, by applying this algorithm, in our cohort FFR could have been safely avoided in 20.7% of cases, with a relevant economic impact in terms of a reduced use of pressure wires and adenosine23, allowing a consensual cost reduction amounting to US $34,200 (about 26,650 euros).
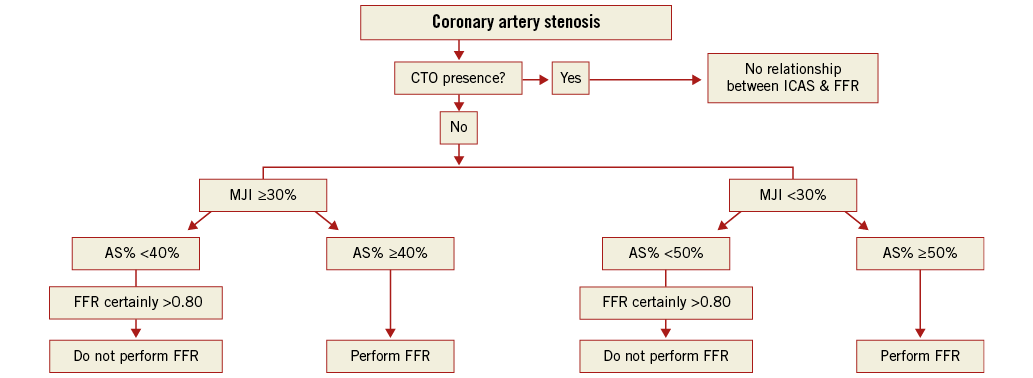
Figure 7. Proposed algorithm. After exclusion of cases with concomitant collateralised CTO, it is safe not to perform FFR in case of ICAS with AS% <40% if the subtended jeopardised myocardium is ≥30%, and in case of ICAS with AS% <50% if the subtended jeopardised myocardium is <30%.
Limitations
Our study presents some limitations. First, we performed our analysis in a retrospectively enrolled population. For this reason, our proposed AS% cut-off values should be validated in a prospectively enrolled population. Second, MJI only represents a rough semi-quantitative estimation of the myocardium subtended by a stenosis and does not provide any precise indication of the effective viability of myocardium itself. However, we believe that for a rapid decision, as occurs in everyday practice, adding MJI to 3D-QCA-based anatomical assessment might be of value in deciding the need for functional assessment of ICAS. In our population, we did not find any correlation between lesion length and FFR. This is partially in contrast with some previous evidence24, and we do not have a clear explanation for this; however, it is likely that, since 3D-QCA measures the length of the lesion from healthy-to-healthy vessel, it overestimates the effective length of the lesion responsible for flow limitation.
Conclusions
FFR values are moderately and independently predicted by the percentage of area stenosis at 3D-QCA, by the amount of jeopardised myocardium and by the presence of a concomitant chronic total occlusion. 3D-QCA in addition to MJI allows the safe exclusion of FFR ≤0.80, limiting FFR assessment to doubtful cases with a considerable reduction of costs.
| Impact on daily practice FFR is better than angiography in guiding PCI, and it is recommended for the evaluation of ICAS in the absence of clear evidence of lesion-related inducible ischaemia. However, its cost is partially responsible for the poor use in common daily practice. The use of our proposed algorithm, based on the combination of 3D-QCA assessment and MJI calculation, could limit the use of FFR to only doubtful cases, leading to a significant saving of time and money. |
Conflict of interest statement
The authors have no conflicts of interest to declare.
Online data supplement
Online Figure 1. Correlations between 3D-QCA parameters and FFR in 37 ICAS with concomitant collateralised CTO. CTO: chronic total occlusion; FFR: fractional flow reserve; ICAS: intermediate coronary artery stenosis; 3D-QCA: three-dimensional quantitative coronary angiography
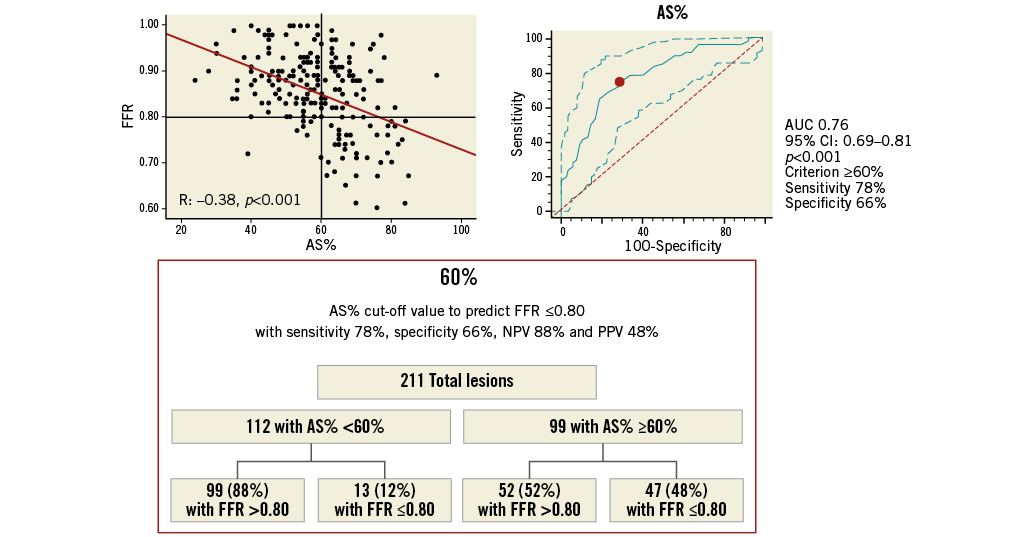
Online Figure 2. Best AS% cut-off value in all ICAS for prediction of FFR ≥0.80. Scatter plot (on the left) shows as AS% ≥61%, obtained from ROC analysis (on the right), allowing the prediction of FFR ≤0.80 with 73% sensitivity, 71% specificity, 69% NPV and 77% PPV, as highlighted in the chart (at the bottom). AS%: percentage area stenosis; FFR: fractional flow reserve; ICAS: intermediate coronary artery stenosis; NPV: negative predictive value; PPV: positive predictive value
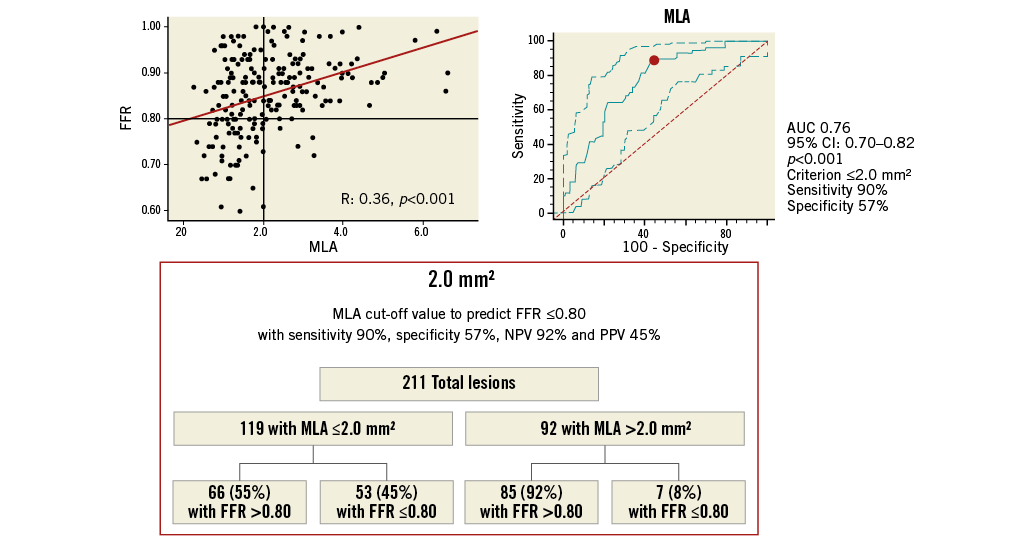
Online Figure 3. MLA cut-off value in all ICAS for prediction of FFR ≥0.80. Scatter plot (on the left) shows as MLA ≤2.0 mm2, obtained from ROC analysis (on the right), allowing the prediction of FFR ≤0.80 with 88% sensitivity, 57% specificity, 56% NPV and 87% PPV, as highlighted in the chart (at the bottom). FFR: fractional flow reserve; ICAS: intermediate coronary artery stenosis; MLA: minimal lumen area; NPV: negative predictive value; PPV: positive predictive value
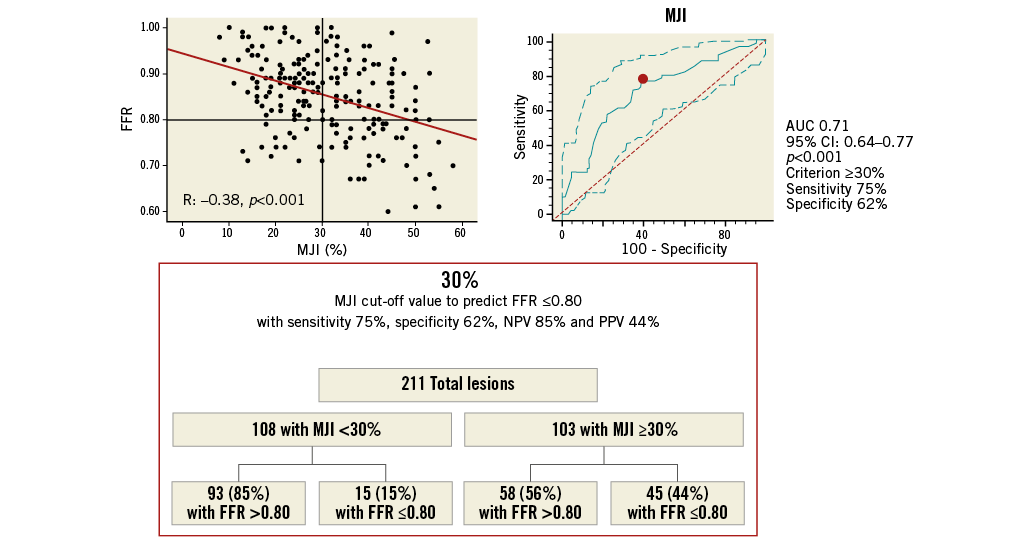
Online Figure 4. MJI cut-off value in all ICAS for prediction of FFR ≥0.80. Scatter plot (on the left) shows as MJI >29%, obtained from ROC analysis (on the right), allowing the prediction of FFR ≤0.80 with 75% sensitivity, 62% specificity, 61% NPV and 73% PPV, as highlighted in the chart (at the bottom). FFR: fractional flow reserve; ICAS: intermediate coronary artery stenosis; MJI: Myocardial Jeopardy Index; NPV: negative predictive value; PPV: positive predictive value
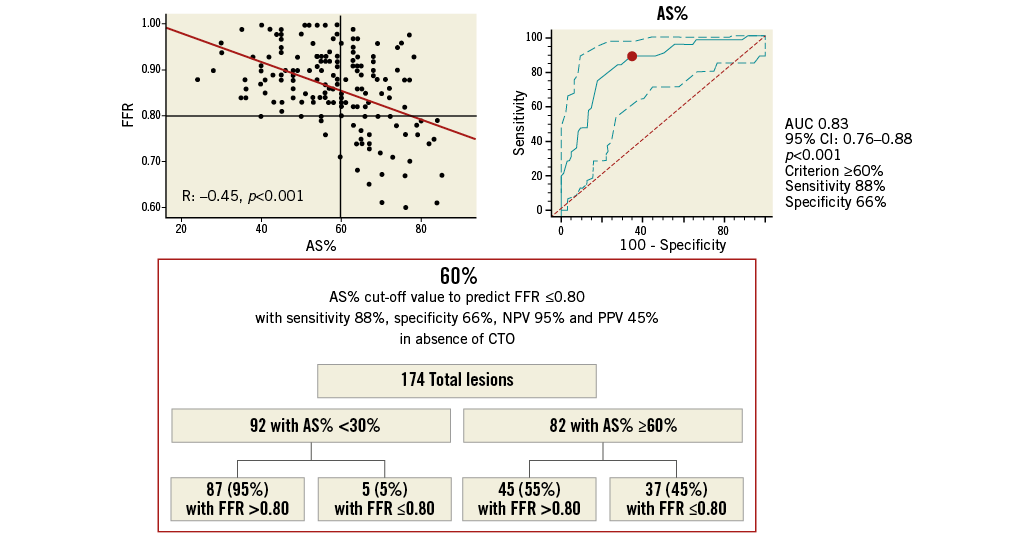
Online Figure 5. AS% cut-off value in 174 ICAS without concomitant collateralised CTO for prediction of FFR ≥0.80. Scatter plot (on the left) shows as AS% ≥61%, obtained from ROC analysis (on the right), allowing the prediction of FFR ≤0.80 with 78% sensitivity, 77% specificity, 67% NPV and 81% PPV, as highlighted in the chart (at the bottom). AS%: percentage area stenosis; CTO: chronic total occlusion; FFR: fractional flow reserve; ICAS: intermediate coronary artery stenosis; NPV: negative predictive value; PPV: positive predictive value
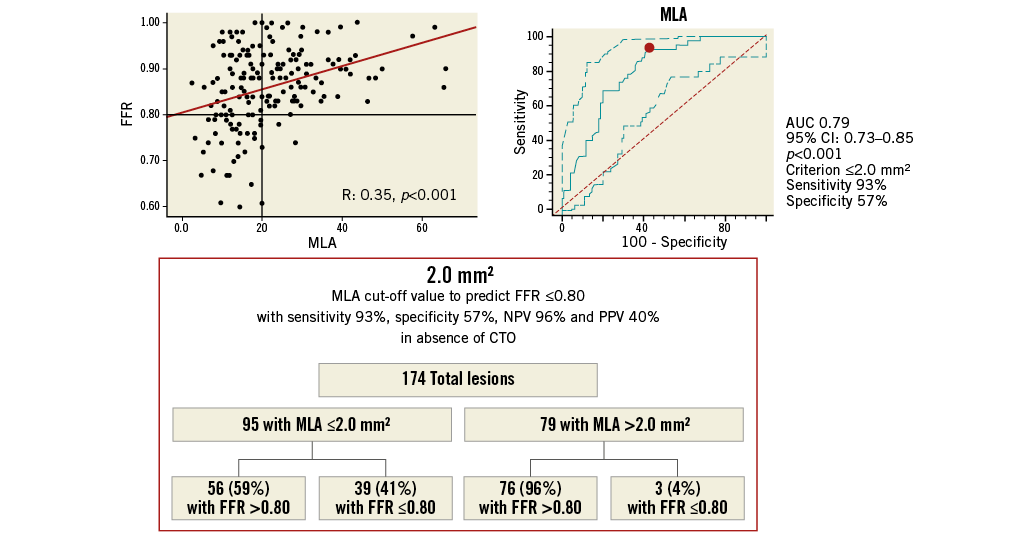
Online Figure 6. MLA cut-off value in 174 ICAS without concomitant collateralised CTO for prediction of FFR ≥0.80. Scatter plot (on the left) shows as MLA ≤2.0 mm2, obtained from ROC analysis (on the right), allowing the prediction of FFR ≤0.80 with 88% sensitivity, 57% specificity, 57% NPV and 93% PPV, as highlighted in the chart (at the bottom). CTO: chronic total occlusion; FFR: fractional flow reserve; ICAS: intermediate coronary artery stenosis; MLA: minimal lumen area; NPV: negative predictive value; PPV: positive predictive value
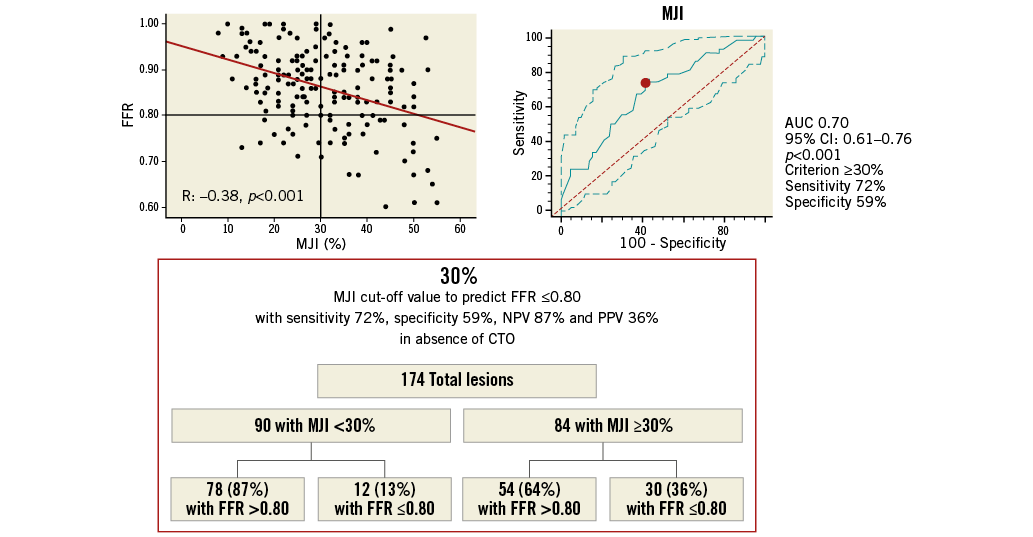
Online Figure 7. MJI cut-off value in 174 ICAS without concomitant collateralised CTO for prediction of FFR ≥0.80. Scatter plot (on the left) shows as MJI >29%, obtained from ROC analysis (on the right), allowing the prediction of FFR ≤0.80 with 72% sensitivity, 59% specificity, 57% NPV and 60% PPV, as highlighted in the chart (at the bottom). CTO: chronic total occlusion; FFR: fractional flow reserve; ICAS: intermediate coronary artery stenosis; MJI: Myocardial Jeopardy Index; NPV: negative predictive value; PPV: positive predictive value