Abstract
Background: It would be ideal for a non-hyperaemic index to predict fractional flow reserve (FFR) more accurately, given FFR’s extensive validation in a multitude of clinical settings.
Aims: The aim of this study was to derive a novel non-hyperaemic algorithm based on deep learning and to validate it in an internal validation cohort against FFR.
Methods: The ARTIST study is a post hoc analysis of three previously published studies. In a derivation cohort (random 80% sample of the total cohort) a deep neural network was trained (deep learning) with paired examples of resting coronary pressure curves and their FFR values. The resulting algorithm was validated against unseen resting pressure curves from a random 20% sample of the total cohort. The primary endpoint was diagnostic accuracy of the deep learning-derived algorithms against binary FFR ≤0.8. To reduce the variance in the precision, we used a fivefold cross-validation procedure.
Results: A total of 1,666 patients with 1,718 coronary lesions and 2,928 coronary pressure tracings were included. The diagnostic accuracy of our convolutional neural network (CNN) and recurrent neural networks (RNN) against binary FFR ≤0.80 was 79.6±1.9% and 77.6±2.3%, respectively. There was no statistically significant difference between the accuracy of our neural networks to predict binary FFR and the most accurate non-hyperaemic pressure ratio (NHPR).
Conclusions: Compared to standard derivation of resting pressure ratios, we did not find a significant improvement in FFR prediction when resting data are analysed using artificial intelligence approaches. Our findings strongly suggest that a larger class of hidden information within resting pressure traces is not the main cause of the known disagreement between resting indices and FFR. Therefore, if clinicians want to use FFR for clinical decision making, hyperaemia induction should remain the standard practice.

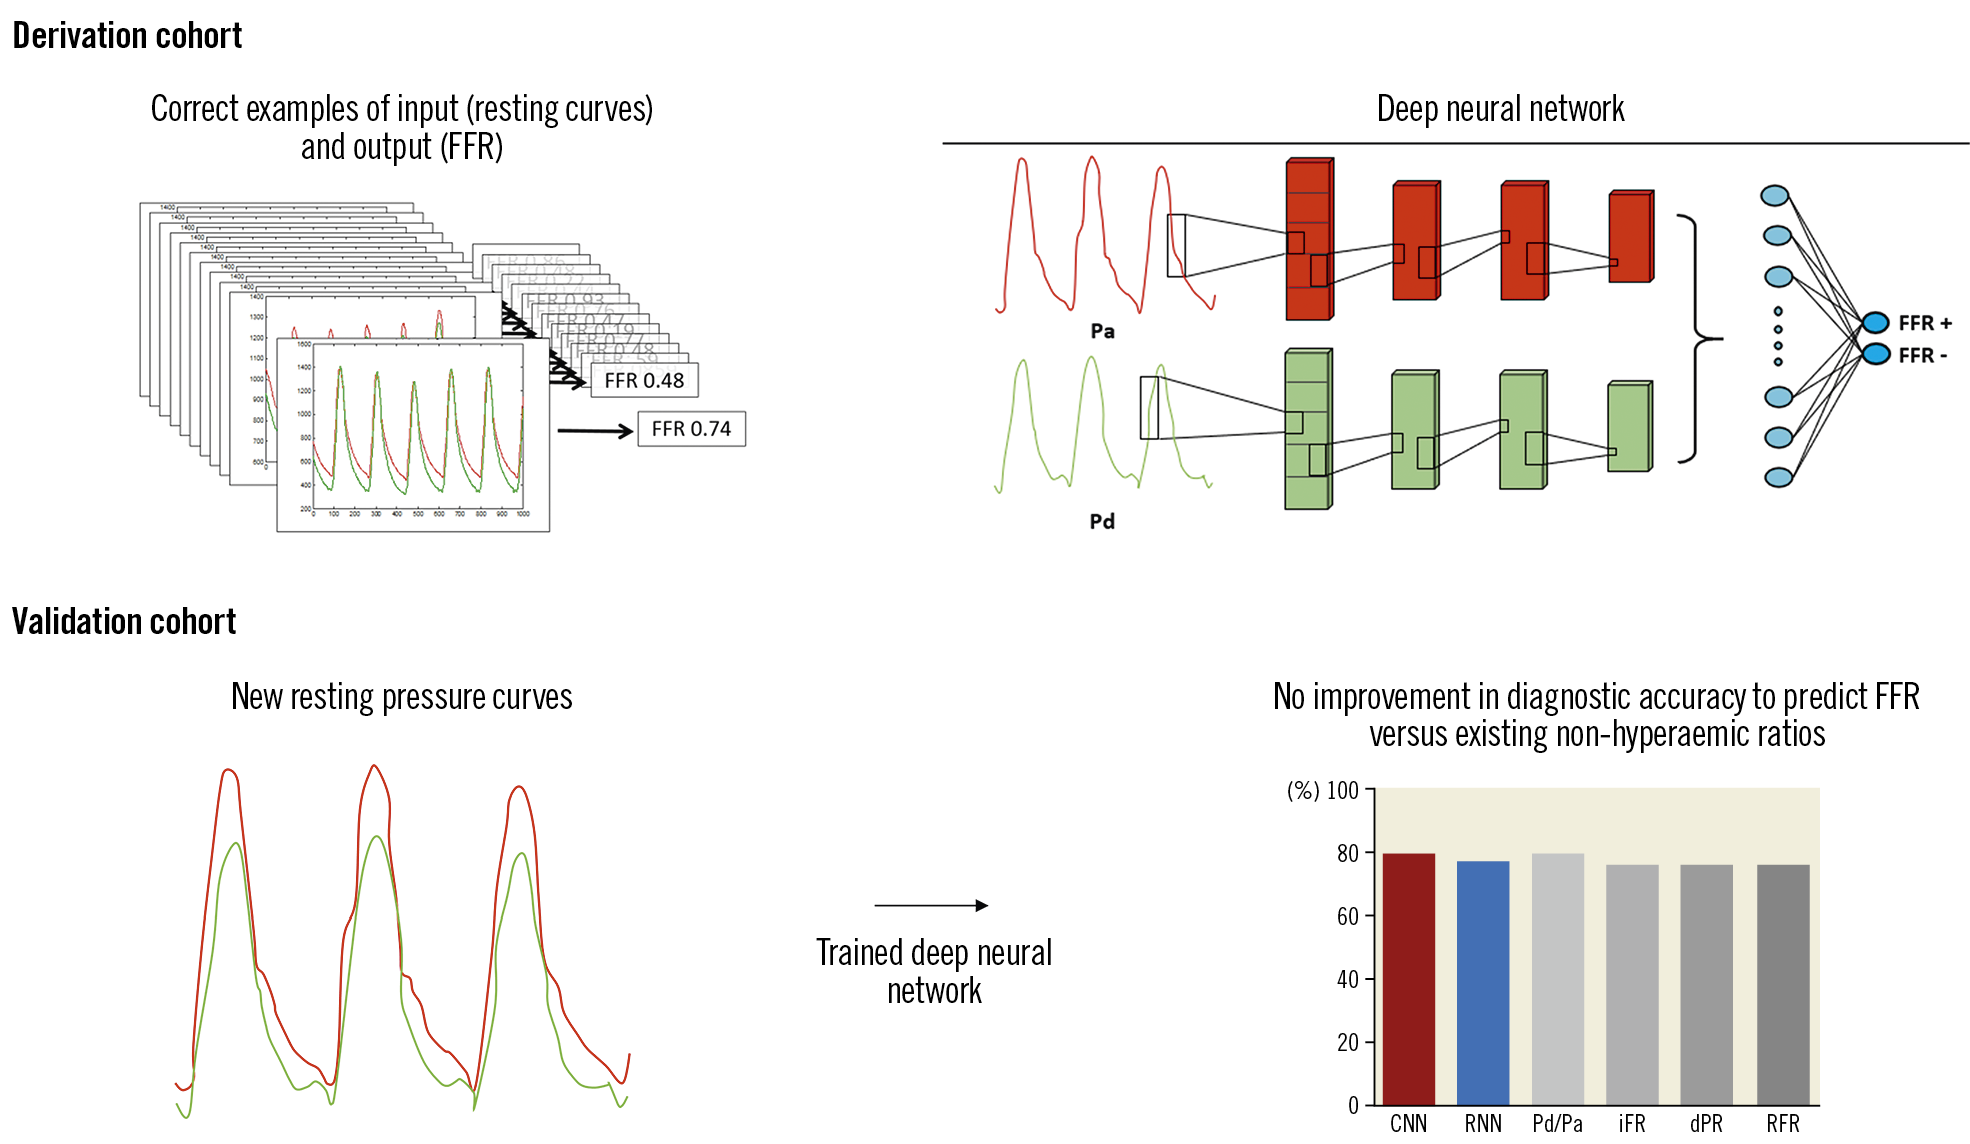
Visual summary. Development and validation of deep neural networks to predict fractional flow reserve (FFR) from resting coronary pressure curves. In a derivation cohort, a deep neural network was trained (deep learning) with examples of resting coronary pressure curves and matching FFR values. After the neural network was trained, its new algorithm was validated using different resting pressure curves. Deep learning-based algorithms did not improve the diagnos-tic accuracy of predicting FFR compared to other non-hyperae-mic indices in a clinically relevant way.
Introduction
Fractional flow reserve (FFR) has become the invasive reference standard for assessing the physiological significance of a coronary stenosis based on randomised clinical outcome trials and mechanistic studies1,2,3,4. Guidance of percutaneous coronary intervention (PCI) by FFR has been shown to be superior to angiography-guided PCI and medical therapy for improving both symptoms and prognosis and is recommended by current guidelines1,2,3,4,5,6.
In order to measure FFR, adenosine (or another vasodilator drug) is required to induce hyperaemia, which adds some cost and might cause transient, short-lasting symptoms1. Therefore, several non-hyperaemic indices have been proposed that do not require adenosine but are derived from non-hyperaemic (resting) coronary pressure curves7,8,9,10.
Such a resting index usually assesses the pressure ratio during a specific period within the cardiac cycle or focuses on qualitative parameters. Unfortunately, the accuracy of existing non-hyperaemic indices to predict FFR ≤0.80 has consistently been shown to be approximately 80%7,8,9,10.
A possible explanation for this suboptimal predictive value of resting indices is that the information needed to predict FFR from resting curves exists in a more complex and subtle manner beyond simplistic pressure ratios or known qualitative features. In addition, traditional waveform analysis might have limits to discover complex information contained within the pressure curves. However, it would be ideal for a non-hyperaemic index to predict FFR more accurately, given its extensive validation in a multitude of clinical settings.
Deep learning, a subfield of artificial intelligence, can model extremely complicated relationships between inputs and outputs, and has shown potential to improve health care in several areas11,12. A deep learning algorithm, a so-called deep neural network, can train itself when provided with a sufficient number of correct examples of input and output. Therefore, we hypothesised that a deep neural network could be trained to predict FFR after receiving many examples of resting pressure curves and their corresponding FFR values.
The aim of this study was to derive a novel non-hyperaemic algorithm based on deep learning and to validate it in an internal validation cohort against FFR.
Methods
STUDY POPULATION
The ARTIST study (ARTificial Intelligence to identify functionally SignificanT coronary stenoses) is a post hoc analysis of three previously published studies: CONTRAST (clinicaltrials.gov NCT02184117), VERIFY (clinicaltrials.gov NCT01559493), and VERIFY 2 (clinicaltrials.gov NCT02377310). All studies included in this analysis were approved by the institutional review boards of the individual sites. Detailed descriptions and primary results of these studies have been published previously13,14,15. In short, all three studies recorded raw tracings of simultaneous aortic (Pa) and distal coronary pressure (Pd) during both resting (non-hyperaemic) conditions and maximal hyperaemia induced by either intravenous or intracoronary adenosine.
FRACTIONAL FLOW RESERVE (FFR)
In order to assess FFR uniformly among trials, all hyperaemic pressure curves were anonymised and independently analysed for calculation of smart minimum FFR (smFFR) using an automated algorithm16 at the Weatherhead PET Imaging Center in Houston, TX, USA. Calculation of smFFR occurred without knowledge of matching non-hyperaemic data.
NON-HYPERAEMIC PRESSURE RATIOS (NHPR)
The following definitions were used to calculate various NHPR – diastolic pressure ratio (dPR): average Pd/Pa from dicrotic notch to 5 ms before end of diastole; resting Pd/Pa: average Pd/Pa over the entire heart cycle; instantaneous wave-free ratio (iFR): average Pd/Pa from 25% into diastole until 5 ms before end of diastole; relative flow reserve (RFR): value at which the filtered ratio of Pd and Pa is lowest during the entire cardiac cycle. According to the literature, a binary cut-off of ≤0.92 was used for resting Pd/Pa and ≤0.89 for other NHPR8.
DERIVATION COHORT
The Visual summary provides an overview of the study design. In a derivation cohort (random 80% sample of the total cohort) a deep neural network was trained (deep learning) with paired examples of resting coronary pressure curves and their FFR values. To reduce the variance in the precision, we used a fivefold cross-validation procedure.
ARTIFICIAL NEURAL NETWORK
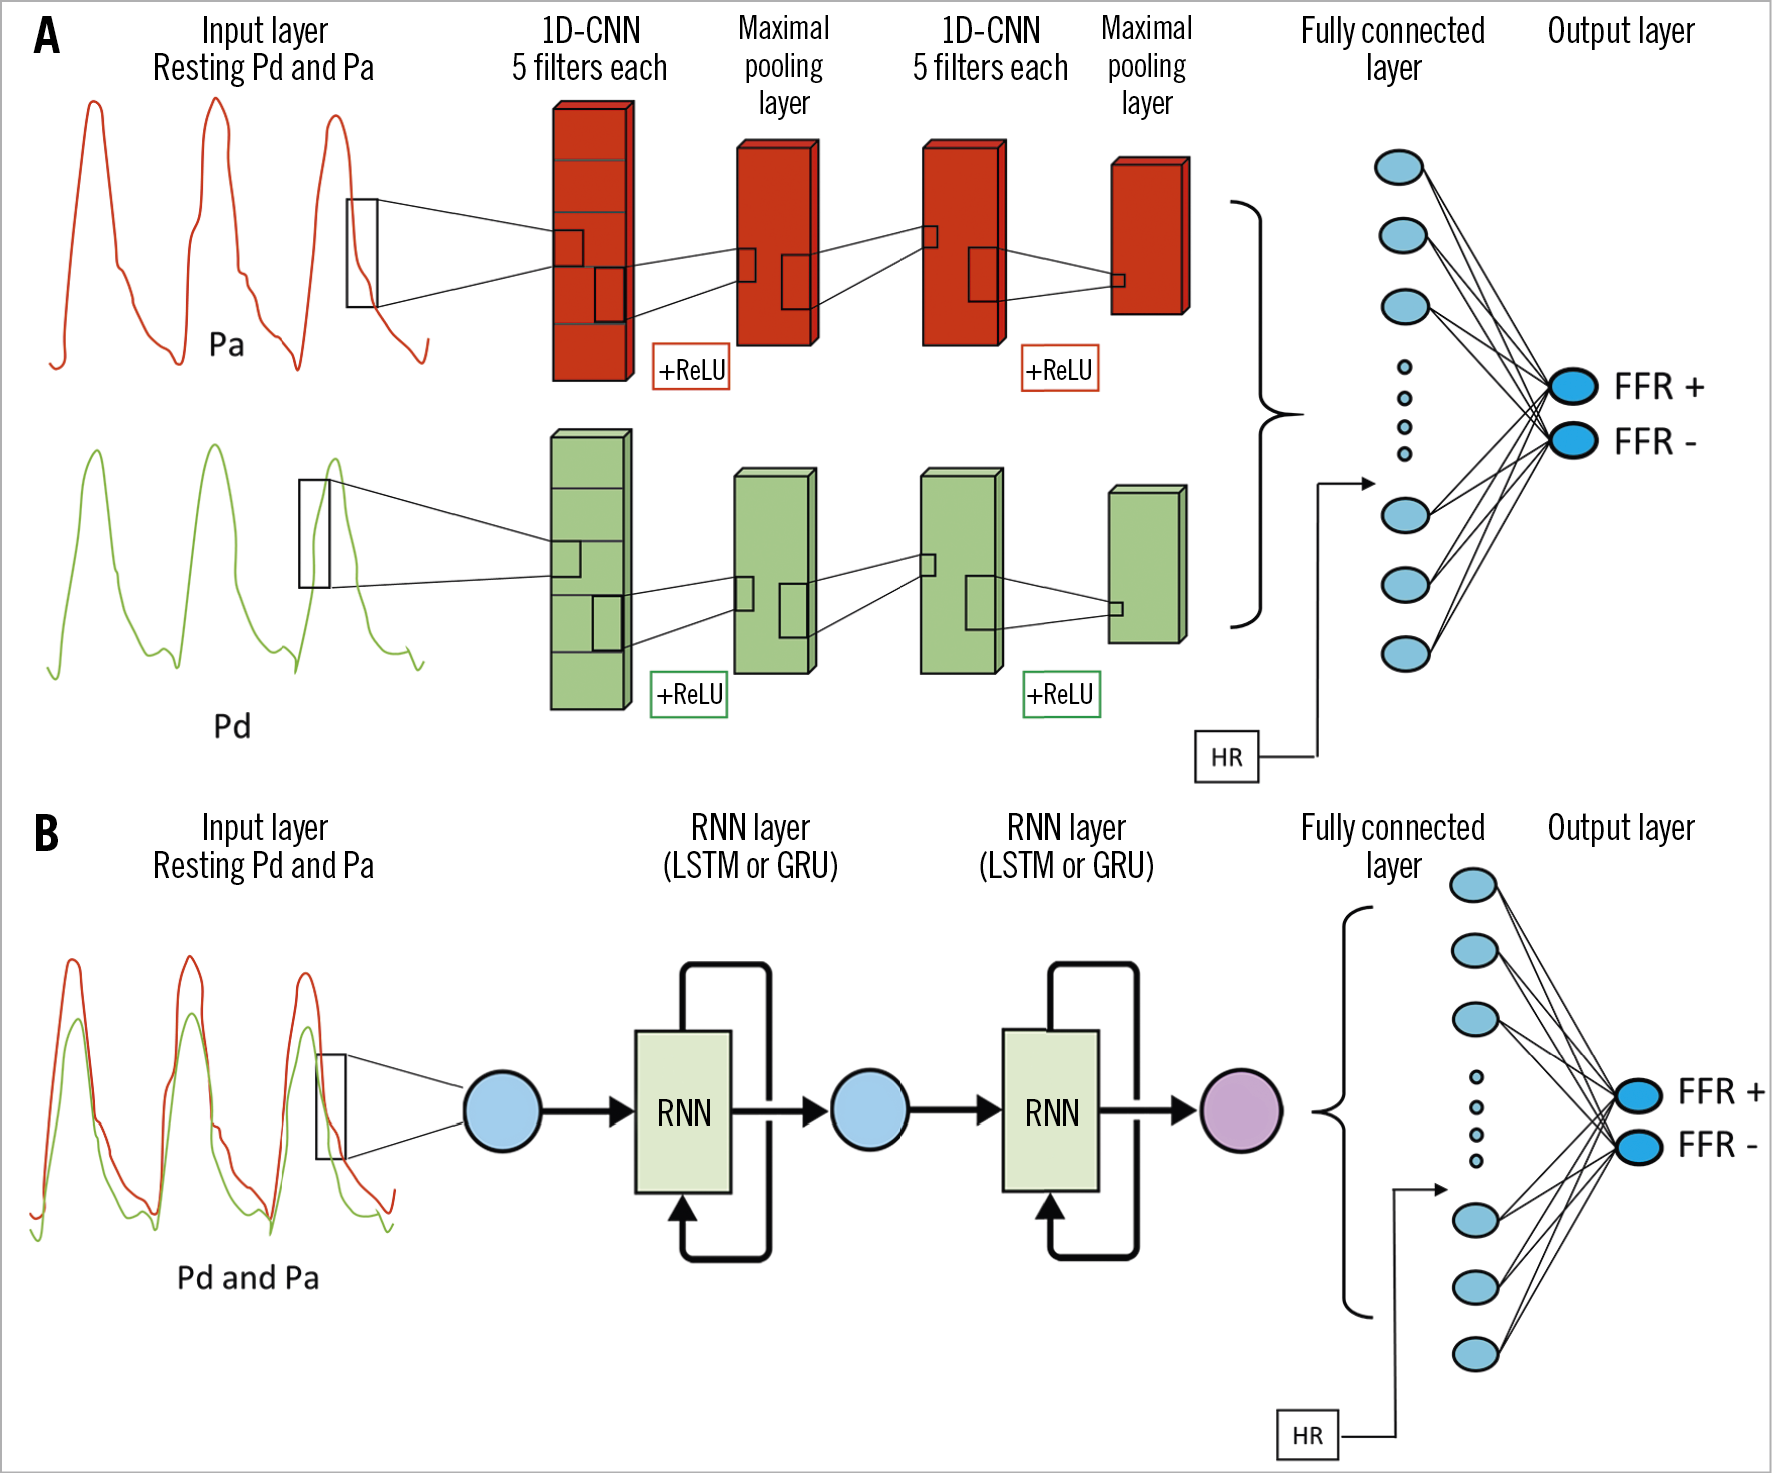
A one-dimensional convolutional neural network (CNN) was used to classify resting pressure recordings into FFR positive (FFR ≤0.80) or FFR negative (FFR >0.80) binary categories, and to predict FFR as a continuous outcome. A CNN can automatically learn and identify features that are present among the resting coronary pressure curves11,12. The architecture of the CNN consisted of five layers (Figure 1A) to provide feature extraction on different levels. Several variations of this CNN architecture were tested (Supplementary Table 1). A detailed description of neural architectures is provided in Supplementary Appendix 1.

Figure 1. Detailed architecture of deep neural networks. A) CNN. B) RNN. CNN: convolutional neural network; FFR: fractional flow reserve; GRU: gated recurrent unit; HR: heart rate; LSTM: long short-term memory; Pa: aortic pressure; Pd: distal coronary pressure; ReLU: rectified linear unit; RNN: recurrent neural network
In addition to a CNN, we tested a different deep learning architecture – a recurrent neural network (RNN) (Figure 1B). An RNN is especially designed to incorporate temporal dependency among features by adding information of a previous interval to the next interval17. This contrasts with a CNN, which is insensitive to the temporal location of the feature within the pressure curve itself. Two different RNN variations were used mutually exclusively – long short-term memory cells (LSTM) and gated recurrent units (GRU).
All deep learning models were implemented using scikit-learn in Python™ (Python Software Foundation, Wilmington, DE, USA).
VALIDATION COHORT
After a neural network was trained, its resulting algorithm was validated against unseen resting pressure curves from a random 20% sample of the total cohort. The primary endpoint of the validation cohort was diagnostic accuracy of the deep learning-derived algorithms against binary FFR ≤0.8. In addition, sensitivity, specificity, positive predictive value, and negative predictive value were calculated, with FFR ≤0.80 as reference standard. The diagnostic performance was presented as mean and standard deviation of the fivefold cross-validation procedure.
The diagnostic performance of several non-hyperaemic pressure ratios was also calculated and compared using a McNemar test. A mean and 95% confidence interval for the diagnostic performance was calculated for the non-hyperaemic pressure ratios based on these data.
Prediction of FFR as a continuous variable was analysed using the area under the receiver operating characteristic (ROC) curve (compared using the DeLong method).
Applicable tests were two-tailed, and p<0.05 was considered statistically significant. Analysis was conducted using R, version 3.4.3 (R Foundation for Statistical Computing, Vienna, Austria).
Results
A total of 1,666 patients with 1,718 coronary lesions and 2,928 coronary pressure tracings were included. Supplementary Table 2 summarises the baseline characteristics. Approximately 71% of patients were male, and the majority of patients had one or more classic risk factors for coronary artery disease. Baseline characteristics and angiographic data in the individual trials have been reported previously13,14,15. Supplementary Figure 1 shows density plots of FFR and several non-hyperaemic pressure ratios of our pooled cohort. Median resting Pd/Pa was 0.92 (interquartile range [IQR] 0.88-0.96), median iFR was 0.89 (IQR 0.83-0.94), and median FFR was 0.80 (IQR 0.72-0.86). Out of 1,718 coronary lesions, 923 (54%) had FFR ≤0.80.
ENDPOINTS
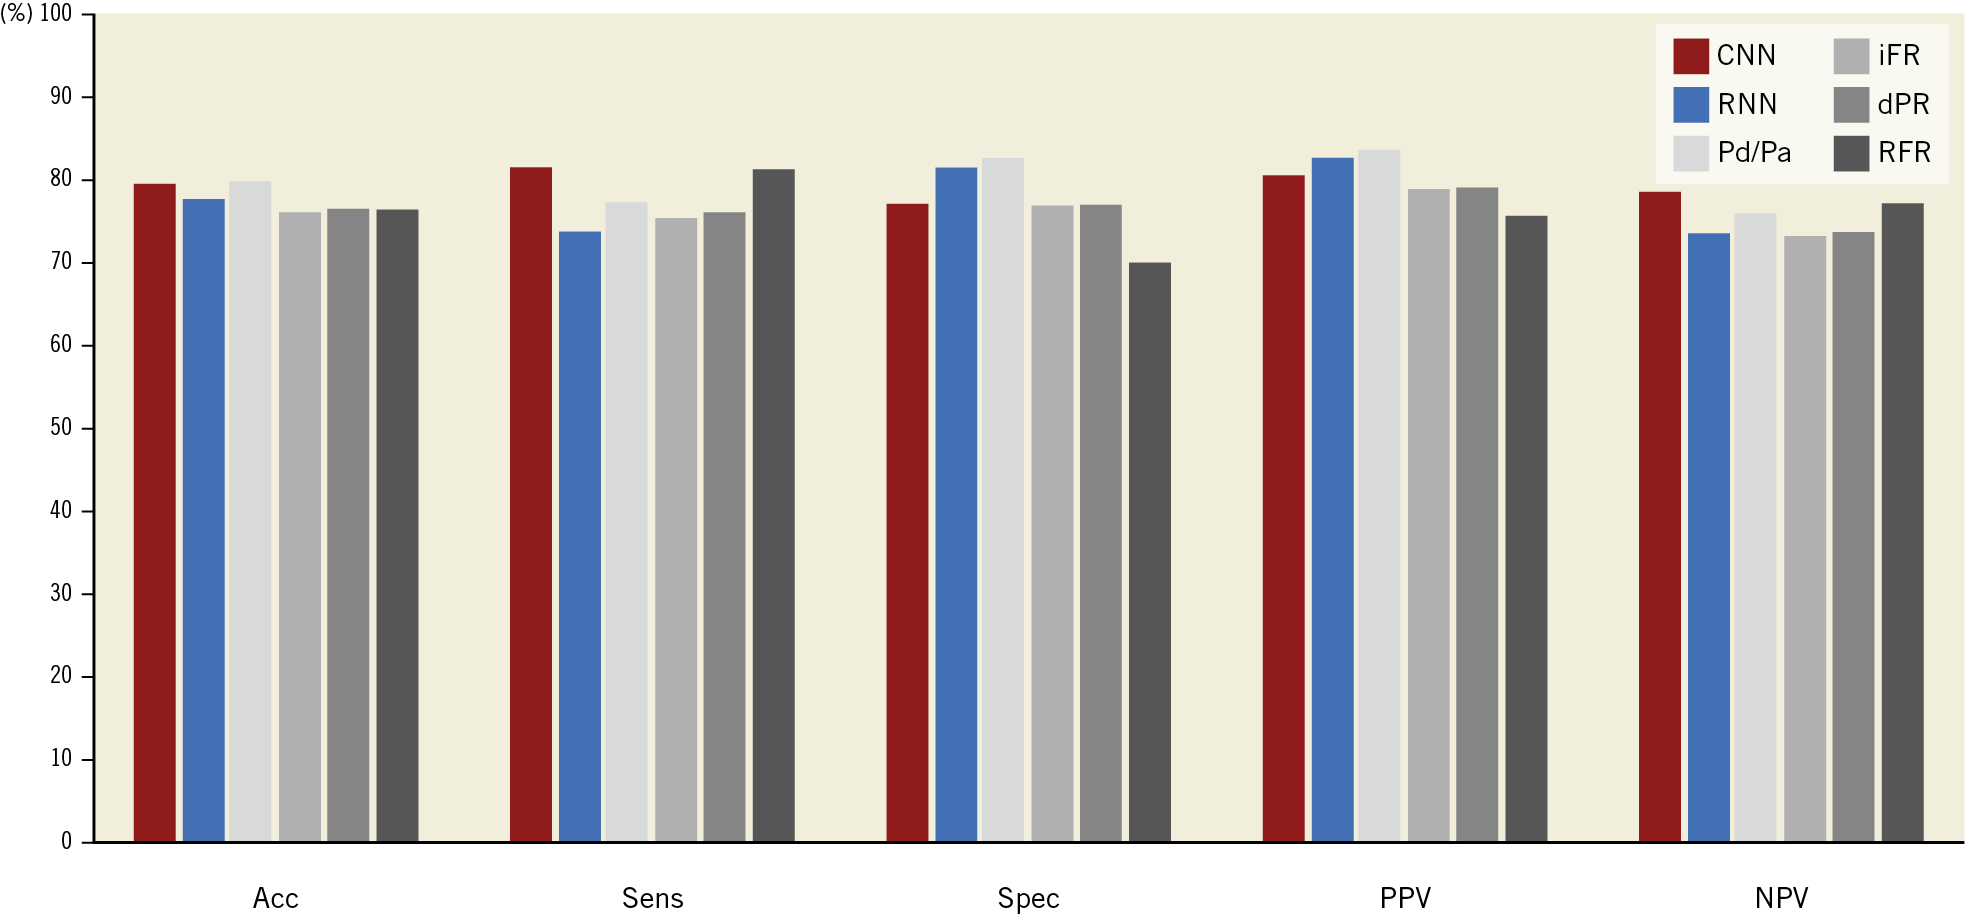
Figure 2 shows the diagnostic performance of our deep neural architectures compared to FFR. Diagnostic accuracy (acc), sensitivity (sens), specificity (spec), positive predictive value (PPV), and negative predictive value (NPV) of our CNN against binary FFR ≤0.80 using fivefold cross-validation was 79.6±1.9%, 81.5±3.2%, 77.1±6.4%, 80.6±3.6%, and 78.5±2.4%, respectively. Acc, sens, spec, PPV, and NPV for our RNN against FFR using fivefold cross-validation were 77.6±2.3%, 73.8±6.1%, 81.5±6.4%, 82.6±3.5%, and 73.4±3.8%, respectively.

Figure 2. Diagnostic performance of our deep learning-based algorithms and other NHPRs, against binary FFR ≤0.80 (diagnostic accuracy of both neural networks not statistically different against the most accurate NHPR). Acc: accuracy; CNN: convolutional neural network; dPR: diastolic pressure ratio; FFR: fractional flow reserve; iFR: instantaneous wave-free ratio; NPV: negative predictive value; Pd/Pa: ratio of distal coronary pressure to aortic pressure; PPV: positive predictive value; RFR: relative flow reserve; RNN: recurrent neural network; Sens: sensitivity; Spec: specificity
The diagnostic accuracy of NHPR was 79.7% for Pd/Pa, 76.1% for iFR, 76.4% for dPR, and 76.3% for RFR. There was no statistically significant difference between the diagnostic accuracy of both neural networks and the NHPR with the highest accuracy (Pd/Pa), p>0.40 for both comparisons. Optimal cut-off values for existing NHPR to predict binary FFR ≤0.80 in our large cohort were near identical to published cut-off values (Supplementary Table 3).
As detailed in Supplementary Figure 2, the area under the ROC curve of our CNN and RNN was 0.88 and 0.84, respectively. Compared to other NHPR, the AUC of the CNN was larger compared to 0.86 for Pd/Pa, 0.84 for iFR, 0.85 for dPR, and 0.85 for RFR (DeLong p<0.01 vs other NHPR), although neither analysis was pre-specified or adjusted for multiple comparisons (Supplementary Table 4). Sensitivity analyses using 16 variations in CNN and RNN architectures did not result in an increase in the diagnostic performance against binary FFR ≤0.80 (Supplementary Table 1). In addition, a pressure recording-level analysis (multiple pressure recordings per lesions allowed) or patient-level analysis (randomly selecting one coronary lesion per patient in case of multiple lesions per patient; ~4% of patients) instead of a lesion-level analysis did not alter the diagnostic performance.
Discussion
The ARTIST study is the first to assess deep learning for the prediction of FFR from resting coronary pressure curves. We found that deep learning-based algorithms did not improve the diagnostic accuracy of predicting FFR compared to other non-hyperaemic indices in a clinically relevant way. Our findings eliminate a larger class of possible hidden information than has been examined before. Therefore, inducing maximal hyperaemia remains a prerequisite for accurate FFR assessment.
THE NEED FOR FFR (PREDICTION) IN THE ERA OF NHPR
Recently, two large randomised clinical trials have demonstrated that iFR-guided PCI (one of several NHPR) is non-inferior to FFR-guided PCI in a low-risk population at maximal two-year follow-up, when including ~80% of concordant FFR/iFR cases9,18. Although NHPRs are a welcome addition to the interventional armamentarium to assess coronary physiology in such low-risk populations, it is still desirable to measure FFR itself (or predict it accurately) for several reasons. First, only FFR has been tested against a true gold standard of myocardial ischaemia1. Second, FFR is the only index that has been proven superior to both medical therapy and angio-guided PCI in randomised clinical trials with follow-up extending to 15 years2,3,4. Third, FFR has been clinically validated in many subgroups, including non-culprit lesions of acute coronary syndromes, left main disease, pre-coronary bypass surgery, and bifurcation lesions2,3,4,20,21,22. Finally, the clinical benefit and safety of FFR-guided PCI has been tested not only in randomised trials, but also in large real-world observational studies23,24. For example, in the randomised DEFINE-FLAIR study on iFR, only about half of PCIs were guided by physiology, related to the protocol-based requirement to confine physiology assessment to lesions with 40-70% diameter stenosis9. How NHPRs perform in a real-world setting, including frequently occurring 70-90% lesions, remains an important yet unanswered clinical question.
THE QUEST FOR HIDDEN INFORMATION IN RESTING CORONARY PRESSURE CURVES
Over the past decade, there has been increasing interest in predicting FFR from resting coronary pressure curves, aiming at simplifying the procedure and preventing the need for adenosine7,8,9. During this time, the results of multiple studies in this field can be summarised by two simple conclusions. First, all proposed NHPRs are numerically equivalent. Second, the diagnostic accuracy of NHPRs to predict binary FFR ≤0.80 is around 80% regardless of the timing within the cardiac cycle7,8,9.
In order to create a non-hyperaemic index that is able to predict FFR more accurately, the ARTIST study was designed to overcome limitations of previous studies. Supplementary Table 5 summarises the potential advantages of our design compared to pivotal studies in this field.
First, ARTIST was structured to create a new index with the highest possible agreement with FFR, in contrast to several previous studies that only validated an existing index.
Second, almost all previous studies focused only on the ratio of distal to aortic pressure during a specific period of the cardiac cycle and neglected qualitative information. For example, it is known that the distal coronary pressure curve changes, not only numerically, but also in morphology with increasing stenosis severity10. Only two previous studies incorporated pre-specified qualitative features, such as the presence of the dicrotic notch and diastolic dipping10 or wave-intensity analysis25, without significant success. Although some of these qualitative features were chosen on a physiological basis, such assumptions neglect the existence of possible additional information outside of the underlying theory.
Third, to the best of our knowledge, this study was the first to use deep learning to predict FFR from resting pressure curves. Over recent years, deep neural networks have shown impressive results in several areas of medicine11,12. A deep neural network uses multiple layers to abstract features on different levels of the data12. As such, even non-pre-specified features have the potential to be identified. Therefore, we hypothesised that deep learning would be capable of identifying complex interactions among features contained in the resting pressure curve that might be pivotal to predicting FFR more accurately.
Finally, ARTIST was among the largest cohorts to date studying the prediction of FFR from resting coronary pressure curves.
Despite these numerous advantages in study design, including the use of deep learning, the current study reached an accuracy to predict FFR of approximately 80%, in accordance with previously reported NHPRs.
Given the small changes in AUC as shown in Supplementary Figure 2 among NHPRs largely considered to be clinically equivalent (largest delta 0.02, with baseline Pd/Pa actually having the largest AUC) and lack of pre-specification between CNN and RNN architectures (delta 0.04 between the two methods), we feel that the statistically larger AUC for CNN versus other NHPRs (deltas 0.02 to 0.04) should not be overinterpreted as providing a meaningful clinical advantage.
WHY IS IT NOT POSSIBLE TO PREDICT FFR ACCURATELY FROM RESTING PRESSURE CURVES?
Several factors might explain why FFR cannot be predicted accurately from resting coronary pressure curves. The hyperaemic trans-stenotic pressure gradient is dependent on several unpredictable factors, including hyperaemic coronary flow and a complex stenosis-specific pressure-flow relationship26,27. Beyond epicardial disease, hyperaemic coronary flow is mostly dependent on the amount of myocardial mass and microvascular function, which appear to be unpredictable from resting coronary pressure curves. The pressure-flow relationship between the trans-stenotic pressure gradient (ΔP) and average whole-cycle flow is a curvilinear function: ΔP=f∙Q + s∙Q226,27. This relationship is dependent on both friction (f) and separation (s) pressure loss. Both coefficients depend on vessel size, stenosis geometry, and blood rheology26,27, which apparently do not affect resting coronary pressure morphology in a way that can be picked up by a neural network. Future studies might increase the diagnostic accuracy of deep learning-based algorithms when incorporating additional information such as stenosis geometry or myocardial mass. In addition, if one could measure the pressure gradient at different flow rates, then one could assess the corresponding pressure-flow relationship. Since the resting pressure gradient is obtained only at single flow rate, predictions about hyperaemic conditions cannot be made with acceptable precision. Finally, it would be of interest for future deep learning models to incorporate clinical outcome. These models might be able to find hidden information in (non-)hyperaemic curves useful to predict future events or symptoms.
We observed a lower accuracy in CNNs including a rectified linear unit (ReLU). One of the potential advantages of using a ReLU is that it decreases overfitting in complex data sets, although some information is lost in the process. It might be possible that useful information to predict FFR was lost due to the ReLU, although this might also be related to a play of chance.
Limitations
This study has several limitations. First, this was a post hoc analysis. Second, although our cohort is the largest reported to predict FFR from resting coronary pressure curves, deep learning usually requires huge amounts of data to function optimally. Nevertheless, given the fact that our results do not provide a hint for a possible improvement in accuracy, we believe that a much bigger cohort would not change the conclusion of this paper relevantly. Third, although we already tested multiple deep neural architectures, it cannot be excluded that other architectures would yield a different result. However, given the near identical accuracy between the architectures used in our study, we do not expect that a different architecture would increase the predictable value in a clinically meaningful manner.
Conclusions
Compared to standard derivation of resting pressure ratios, we did not find a significant improvement in FFR prediction when resting data are analysed using artificial intelligence approaches. Our findings strongly suggest that a larger class of hidden information within resting pressure traces is not the main cause for the known disagreement between resting indices and FFR. Therefore, if clinicians want to use FFR for clinical decision making, hyperaemia induction should remain the standard practice.
|
Impact on daily practice Regardless of the use of deep learning, the diagnostic accuracy to predict FFR from resting coronary pressure curves is around 80%. Therefore, inducing maximal hyperaemia remains a prerequisite for accurate FFR assessment. Adding clinical information or (non-invasive) anatomical information might increase the diagnostic performance of future deep learning models at the cost of greater complexity for the user. |
Funding
ARTIST was an investigator-initiated study supported by an unrestricted research grant from Top Medical BV, Esloo, the Netherlands. Deep learning analyses were performed by Medicx.AI, part of GoDataDriven, Amsterdam, the Netherlands.
Conflict of interest statement
B. De Bruyne reports grants from Abbott, Boston Scientific, and Biotronik, and institutional consultancy for Opsens, Boston Scientific, and Abbott, outside the submitted work. C. Berry reports non-financial support from Coroventis, during the conduct of the study; non-financial support from Abbott Vascular, and non-financial support and other from HeartFlow, outside the submitted work. I. Everts reports being a full-time employee of GoDataDriven, which created the AI algorithm used in the study. N.P. Johnson reports an institutional licensing agreement with Boston Scientific, Volcano/Philips, and St. Jude Medical, outside the submitted work. In addition, he has a patent pending on quantification of aortic valve stenosis (SAVI). N.H.J. Pijls reports grants and personal fees from Abbott and Opsens, outside the submitted work. K.G. Oldroyd reports grants and personal fees from Abbott Vascular, outside the submitted work. W.F. Fearon reports grants from Abbott Vascular, Medtronic, CathWorks, and ACIST Medical, personal fees from Boston Scientific, and minor stock options from HeartFlow, outside the submitted work. The other authors have no conflicts of interest to declare.
Supplementary data
To read the full content of this article, please download the PDF.

