
Abstract
Aims: The aim of this study was to evaluate the predictability of resting distal coronary pressure wave forms for fractional flow reserve (FFR).
Methods and results: Resting coronary wave forms were qualitatively evaluated for the presence of (i) dicrotic notch, (ii) diastolic dipping, and (iii) ventricularisation. In a development cohort (n=88), a scoring system was developed that was then applied to a validation cohort (n=428) using a multivariable linear regression model to predict FFR and receiver operating characteristics (ROC) to predict FFR ≤0.8. In the development cohort, all three qualitative parameters were independent predictors of FFR. However, in a multivariable linear regression model in the validation cohort, qualitative wave form analysis did not further improve the ability of resting distal coronary to aortic pressure ratio (Pd/Pa) (p=0.80) or instantaneous wave-free ratio (iFR) (p=0.26) to predict FFR. Using ROC, the area under the curve of resting Pd/Pa (0.86 versus 0.86, p=0.08) and iFR (0.86 versus 0.86, p=0.26) did not improve by adding qualitative analysis.
Conclusions: Qualitative coronary wave form analysis showed moderate classification agreement in predicting FFR but did not add substantially to the resting pressure gradients Pd/Pa and iFR; however, when discrepancies between quantitative and qualitative analyses are observed, artefact or pressure drift should be considered.
Abbreviations
CL: core laboratory
FFR: fractional flow reserve
IC: intracoronary
iFR: instantaneous wave-free ratio
IV: intravenous
Pd/Pa: distal coronary to aortic pressure ratio
Introduction
The use of a pressure wire to calculate fractional flow reserve (FFR) during maximal hyperaemia is a technique to assess the functional severity of an epicardial coronary artery stenosis1. Multiple randomised clinical trials have demonstrated that FFR-guided revascularisation improves clinical outcomes2,3, and both U.S. and European guidelines have endorsed its use4,5; however, the need for coronary hyperaemia as a prerequisite for FFR measurements may have contributed to a relative lack of adoption of this technique in clinical practice due to increased cost, time, and patient discomfort.
The instantaneous wave-free ratio (iFR) measures coronary pressure during a specific period of diastole when resting resistance is the lowest during the resting cardiac cycle6. Several head-to-head comparisons with non-invasive techniques demonstrated similar diagnostic yield for FFR and iFR in identifying ischaemia-generating stenosis7,8, and two large randomised trials have demonstrated similar clinical outcomes at one year with an iFR- versus an FFR-based revascularisation strategy9,10. Whether the addition of a qualitative wave form analysis further improves the classification agreement of resting pressure measurements is currently unknown.
Spectral analysis of the arterial pressure wave form has identified the dicrotic notch as a marker for high-frequency content of the pressure signal11. Previous studies demonstrated that analysis of the pressure wave form may be associated with the degree of atherosclerotic vascular disease12,13, and attenuation of the high-frequency components of the pulse wave form can be an indicator of the presence of a significant stenosis11,14. Accordingly, we hypothesised that qualitative wave form analysis of the resting distal wave form may improve the classification agreement of the resting distal coronary to aortic pressure ratio (Pd/Pa) and iFR in their ability to predict FFR.
Methods
PATIENT POPULATION
This is a substudy of a multicentre, international study comparing the accuracy of contrast FFR versus standard FFR obtained with intravenous (IV) and intracoronary (IC) adenosine (CONTRAST: Can cONTrast Injection Better Approximate FFR compAred to Pure reSTing Physiology; NCT02184117). Details of the study methodology and results have been published previously15. Briefly, patients underwent routine physiologic lesion assessment for clinical indications; subsequent clinical care was left to physician discretion but was predominantly based on the obtained FFR measurement. Each subject gave informed consent as approved by the local institutional review board of that participating centre.
PHYSIOLOGY PROTOCOL
For FFR measurements, a PressureWire™ Certus™ or PressureWire™ Aeris™ guidewire and the QUANTIEN™ acquisition unit (all St. Jude Medical, St. Paul, MN, USA) were used. Lesion selection for FFR was left to the individual operators based on clinical necessity and study inclusion criteria. Equalisation of the pressure wire and the aortic pressure was performed at the tip of the guide catheter prior to all measurements. The pressure wire was then advanced distal to the stenosis in a stable location to ensure high-quality tracings.
As detailed previously, the complete physiology protocol consisted of duplicate measurements of resting pressure (Pd/Pa) as well as the iFR, contrast FFR, and FFR obtained with IC and IV adenosine15. The IC adenosine dose was left to operator discretion, but a strong recommendation was made for 100 to 200 µg. IV adenosine infusion was administered at a standard rate of 140 µg/kg/min, and the duration of the infusion was approximately two minutes. At the end of the procedure, a drift check was recommended by pulling the pressure wire back to the tip of the guide catheter to the same location as the initial equalisation.
CORE LABORATORY ANALYSIS
All pressure tracings were sent to the Cardiovascular Research Foundation (New York, NY, USA) physiology core laboratory (CL) for standardised and centralised review. The CL was blinded to both individual patients and their pressure tracings, thus the CL carried out a post hoc analysis without knowledge of the locally determined Pd/Pa or FFR value, method of hyperaemia, enrolling site, or subject/lesion characteristics.
The RadiAnalyzer™ Xpress instrument (St. Jude Medical) was used for coronary pressure measurements. The physiology CL assessed each individual tracing for quality based on pre-specified criteria16. Each tracing received a binary decision regarding adequate quality for inclusion, and Pd/Pa or FFR was calculated independently for each tracing. In cases where a final drift check was performed, the quality of the pullback was assessed along with the amount of drift. iFR was calculated off-line in the core laboratory using the Volcano Harvest software package (Volcano Corporation, San Diego, CA, USA), which contains the iFR computational algorithm developed at Imperial College London15.
For this substudy, the first resting Pd/Pa and the first FFR value with IV adenosine was used. If the first measurement was not available or rejected by the CL, the second resting Pd/Pa or the second FFR value with IV adenosine was used. If both of these measurements were rejected, an acceptable measurement with IC adenosine was used for the FFR value. Ultimately, one technically adequate resting Pd/Pa and one FFR without any artefact per patient was used in this analysis.
CL DEFINITIONS
CL definitions have been described previously16. Briefly, pressure drift is defined as a separation of the aortic pressure recorded via the guide catheter and distal coronary pressure as recorded by the coronary wire pressure sensor over time. An arbitrary range of 0.97 to 1.03 was used as acceptable values, while drift was defined as measurements of <0.97 or >1.03. Aortic pressure ventricularisation was defined as diastolic dipping of the wave form, similar to a left ventricular pressure tracing. Aortic wave form distortion was defined as a blunting of the aortic wave form with loss of the dicrotic notch and sinusoid appearance of the wave form.
The resting distal wave form was evaluated based on the following three binary characteristics: (i) dicrotic notch, defined as the pressure wave form having a distinct incisura (Figure 1A); (ii) diastolic dipping, defined as Pa and Pd not being parallel (decrease of Pd) (Figure 1B); and (iii) ventricularisation (similar to the pressure pattern of the left ventricle) (Figure 1C). Per definition, both diastolic dipping and ventricularisation cannot exist together.
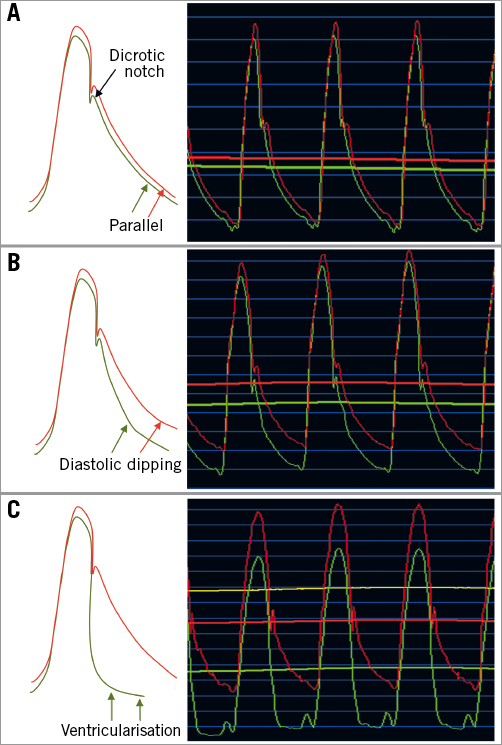
Figure 1. Representative case examples. Typical patterns of the aortic and distal pressure wave forms based on lesion severity. A) The presence of a dicrotic notch with a parallel downslope of Pd to the aortic wave form, consistent with a haemodynamically non-significant stenosis. B) A more severe stenosis with typical “diastolic dipping” of the Pd and loss of the parallel downsloping compared with the aortic wave form. C) A critical coronary stenosis with loss of dicrotic notch and ventricularisation of the Pd. Pd: distal coronary pressure
STATISTICAL ANALYSIS
A random sample was selected for the “development” cohort, with the remaining assigned to the “validation” cohort. Using the development cohort, the best linear estimate of FFR by resting Pd/Pa or three qualitative parameters (dicrotic notch, diastolic dipping, ventricularisation) was calculated in a linear regression model. Using the validation cohort, the additive predictability of three qualitative parameters on resting Pd/Pa was tested using the square roots of the coefficient of determination (R2 values) by Steiger’s Z-test. Using receiver operating characteristic (ROC) analysis, the additive predictability of three qualitative parameters on resting Pd/Pa for FFR ≤0.8 was tested by chi-squared test. The entire process was then repeated by replacing Pd/Pa with iFR. The positive predictive values were defined as the probability of the absence of a dicrotic notch, the presence of diastolic dipping, or the presence of pressure ventricularisation to predict an FFR ≤0.80. Inter- and intra-observer variability of wave form analysis using 40 randomly selected cases was assessed by two independent observers and by the re-analysis of a single observer six months after the initial evaluation, respectively, and evaluated using kappa statistics. All statistical analyses were performed using SAS 9.4 (SAS Institute, Cary, NC, USA), and a two-sided p-value <0.05 was considered statistically significant. Further details are available in Supplementary Appendix 1.
Results
STUDY POPULATION
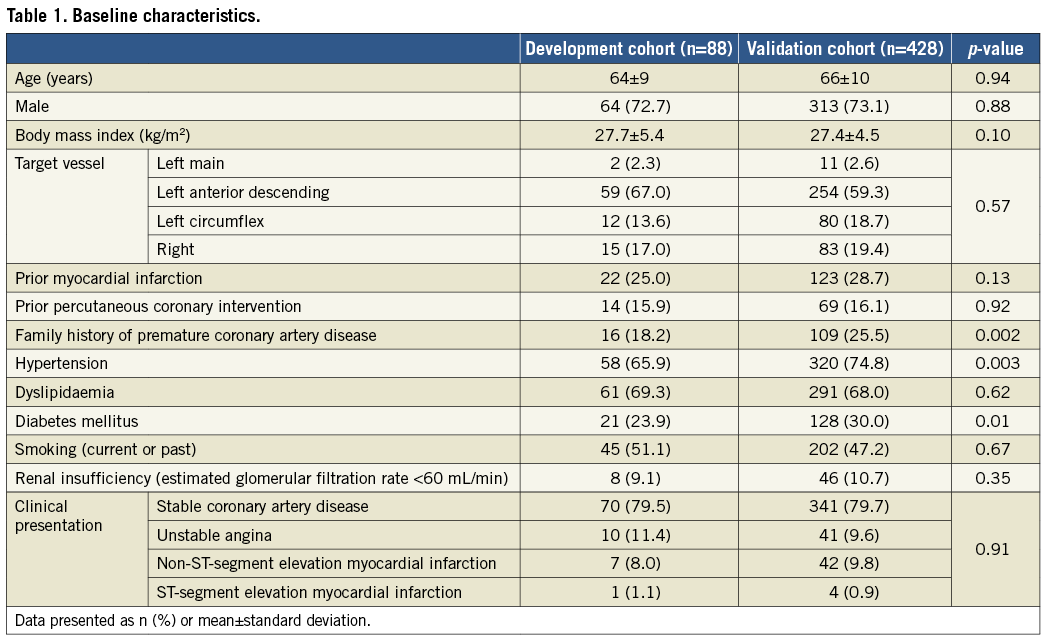
After eliminating pressure drift, aortic pressure ventricularisation, and distorted aortic wave forms, a total of 592 patients with acceptable wave forms for resting Pd/Pa and either IV or IC adenosine FFR were evaluated. Out of this group, 100 patients were randomly selected as the development cohort, and the remaining 492 patients were used as the validation cohort. There were 12 patients in the development cohort and 64 patients in the validation cohort who did not have a dicrotic notch in the aortic wave form and thus were additionally excluded. In total, 88 patients in the development cohort and 428 patients in the validation cohort were included (Figure 2). Only minor differences were observed in patient and procedural characteristics between the development and validation cohorts (Table 1).
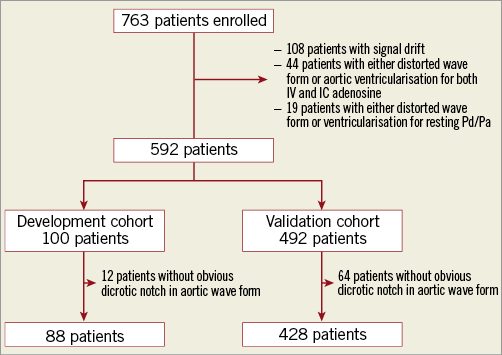
Figure 2. Study flow chart. Includes the proportion of patients and tracings that were analysed by the core laboratory and found to have signal drift, aortic wave form ventricularisation, or distortion.
DEVELOPMENT COHORT
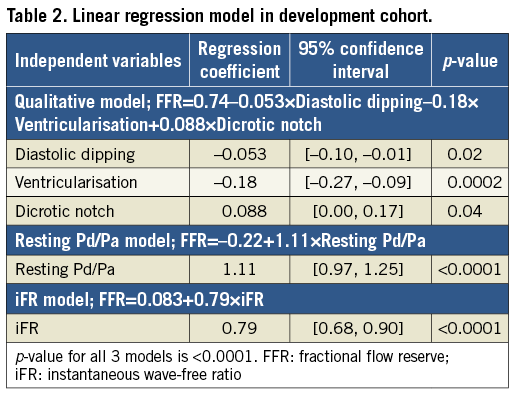
Of the 88 patients in the development cohort, 14 (15.9%) did not have a dicrotic notch in the resting Pd wave form, 32 (36.4%) had diastolic dipping, and 14 (15.9%) had pressure ventricularisation. A multivariable linear regression model (Table 2) confirmed that qualitative wave form analysis, resting Pd/Pa, and iFR were all independent predictors for FFR.
VALIDATION COHORT
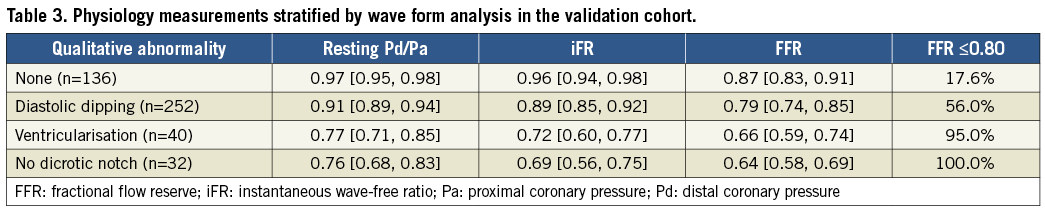
Of the 428 patients in the validation cohort, 32 (7.5%) did not have a dicrotic notch, 252 (58.9%) had diastolic dipping, and 40 (9.3%) had pressure ventricularisation. Among the 32 patients without a dicrotic notch, 30 patients also had pressure ventricularisation. The positive predictive value of an absent dicrotic notch to predict FFR ≤0.80 was 1.00 (32/32); the presence of diastolic dipping to predict FFR ≤0.80 was 0.56 (141/252), while the positive predictive value of pressure ventricularisation was 0.95 (38/40). The presence of a dicrotic notch and the absence of diastolic dipping or ventricularisation predicted FFR >0.80 in 82.4% (112/136). The lowest resting Pd/Pa, iFR, and FFR values were associated with an absent dicrotic notch (Table 3).
R2 values of estimated FFR using linear regression equations were significantly lower for qualitative analysis when compared with resting Pd/Pa and iFR (both p<0.0001) (Figure 3). When the qualitative analysis was added into a multivariable model to resting Pd/Pa, there was no significant change in R2 (0.67 versus 0.67, p=0.80). Similarly, when the qualitative analysis was added into a multivariable model to iFR, R2 remained unchanged (0.58 versus 0.58, p=0.26). This indicates that the qualitative analysis did not contribute to the ability of resting Pd/Pa or iFR to predict FFR.
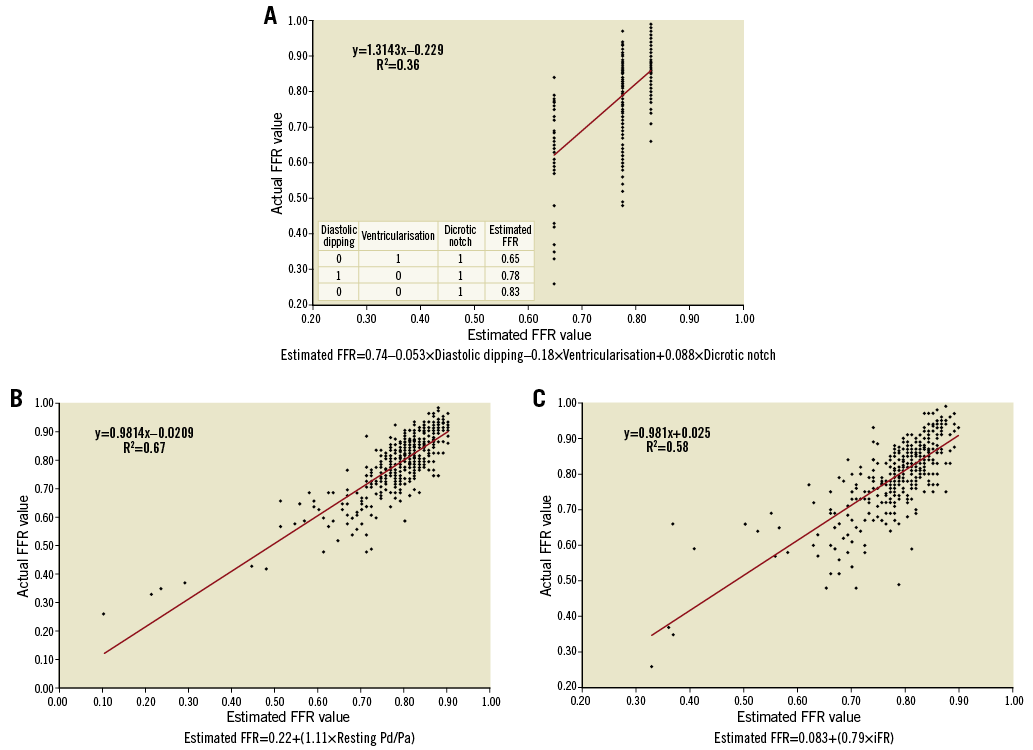
Figure 3. Fractional flow reserve (FFR) prediction using qualitative analysis, resting Pd/Pa, and iFR. A) FFR prediction using qualitative analysis, with increasing sensitivity with the addition of each variable. B) & C) FFR prediction using resting Pd/Pa and iFR. The relationship between actual FFR value and estimated FFR value was approximately linear, with resting Pd/Pa and iFR demonstrating better discriminatory ability than qualitative wave form analysis. Pa: proximal coronary pressure; Pd: distal coronary pressure
In ROC analysis using FFR ≤0.8 as abnormal, the area under the curve for (i) qualitative analysis, (ii) resting Pd/Pa, or (iii) both qualitative analysis and resting Pd/Pa was 0.75 (95% confidence interval [CI]: 0.71-0.79), 0.86 (95% CI: 0.82-0.89), and 0.86 (95% CI: 0.83-0.90), respectively (all p<0.0001). Qualitative analyses were significantly worse than Pd/Pa alone in predicting an abnormal FFR (0.75 versus 0.86, p<0.0001), and they did not add significantly when added to Pd/Pa (0.86 versus 0.86, p=0.08) (Figure 4A). Data for iFR were similar, demonstrating that qualitative analyses were inferior to iFR and did not add further discriminatory value (Figure 4B).
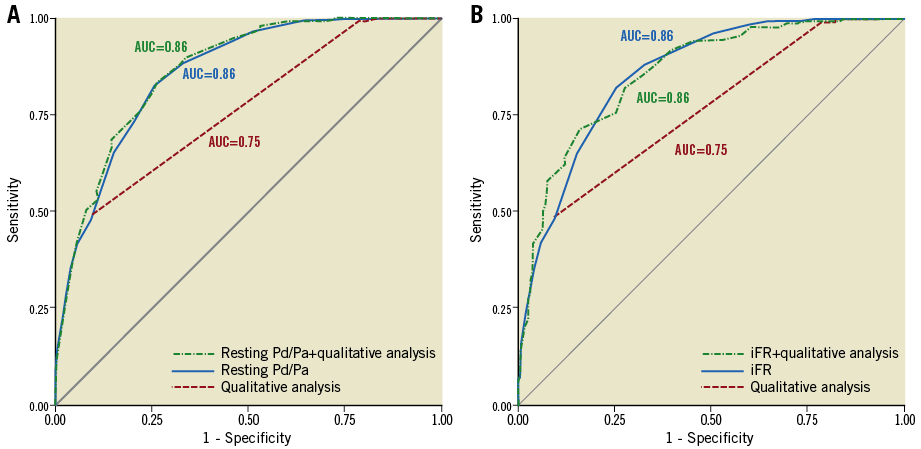
Figure 4. Receiver operating characteristic (ROC) curves. A) The area under the curve (AUC) for resting Pd/Pa alone, resting Pd/Pa+qualitative analysis, and qualitative analysis alone. Compared with the AUC for qualitative analysis, the AUC for resting Pd/Pa was significantly better. There was no significant difference between the AUC of resting Pd/Pa alone versus Pd/Pa+qualitative analysis. B) The same analysis for iFR with similar results. iFR: instantaneous wave-free ratio; Pa: proximal coronary pressure; Pd: distal coronary pressure
There was a good concordance of inter- and intra-observer agreement for assessment of the wave form analysis (κ=0.89 and 0.93, respectively).
Discussion
The present study suggests that: (i) qualitative wave form analyses including the absence of a dicrotic notch and the presence of diastolic dipping and ventricularisation were predictive of an abnormal FFR; (ii) qualitative analyses were statistically inferior to quantitative resting pressure measurements including Pd/Pa and iFR; and (iii) adding the qualitative analysis to either resting Pd/Pa or iFR did not further contribute to these indices’ ability to predict FFR.
Previous studies demonstrated that the presence of a distal coronary dicrotic notch was predictive of an FFR ≥0.7611. On the other hand, it has been shown that an abnormal pressure wave form with the absence of a discrete dicrotic notch is associated with significant atherosclerotic vascular disease12,13. Moreover, the absence of a dicrotic notch in the distal pulse pressure wave form among patients with peripheral arterial disease was associated with a significant stenosis17. Pulse transmission coefficient is a novel non-hyperaemic parameter for the physiologic assessment of coronary artery stenosis with significant correlation to FFR and an ability to predict an FFR <0.75 with high accuracy18. The present data confirm these prior findings in that the presence or absence of a dicrotic notch in the distal coronary pressure wave form is significantly correlated to FFR. Specifically, the presence of a dicrotic notch and the absence of diastolic dipping at rest had a high negative predictive value (0.82) for an abnormal FFR.
With increasing stenosis severity, the distal coronary pressure wave form changes in morphology. We have recently reported on the importance of recognising these morphologic wave form changes to improve the accuracy of FFR measurements16. It is important to examine the distal wave form in the context of the actual FFR measurement and the angiographic stenosis severity. For example, in the presence of a modest angiographic stenosis and a low FFR value, a careful analysis of the distal wave form should be performed. If there is no substantial change in the distal wave form when compared with the aortic wave form, the FFR is probably artificially low due to signal drift. A pullback of the wire should be performed to align the pressure sensor with the guide catheter, and re-normalisation of the pressures should be performed if necessary. In the most severe lesions there is substantial deformation of the distal wave form with the typical appearance of pressure ventricularisation, which proved to have a very high positive predictive value (0.98) of an abnormal FFR.
Even though qualitative wave form analysis is important for the proper interpretation of FFR, it does not contribute significantly to the overall ability of resting gradients (i.e., Pd/Pa and iFR) to predict FFR. Therefore, it appears that all the information is contained within the resting pressure gradient rather than the wave form. If a stenosis acted like a pure resistor, then Pd would be practically identical to Pa. However, because of capacitive and inductive effects as well as non-linear effects due to epicardial/myocardial interaction, the system does not behave like a pure resistor. Nevertheless, while there are substantial distal wave-form changes confirming non-resistor effects for an epicardial stenosis, the resistor effects remain the largest contributor, allowing simple pressure gradient measurements. The predominant use of a qualitative wave form analysis is therefore to consider possible artificial FFR values due to signal drift or other artefacts, especially when the measured FFR is very different from the expected FFR based on clinical symptoms and angiographic findings.
Study limitations
Pressure wire pullbacks after FFR measurements to determine signal drift were available in only ~80% of the population. Assuming a similar rate of drift among patients who did not have a recorded pullback, some tracings were included that may have had significant drift. The analysis was based on subjective classification of pressure wave forms in three categories, and not on a continuous or automatic manner. FFR data were determined from either IC or IV adenosine administration, potentially leading to minor variations.
Conclusions
Qualitative wave-form analysis showed moderate classification agreement in predicting FFR but did not add substantially to the resting pressure gradients Pd/Pa and iFR; however, when discrepancies between quantitative and qualitative analyses are observed, artefact or pressure drift should be considered.
| Impact on daily practice Qualitative distal coronary wave-form analysis such as the presence of dicrotic notch, diastolic dipping, and ventricularisation showed moderate classification agreement in predicting FFR but did not add to the more simple resting pressure measurements of Pd/Pa and iFR. However, wave-form analysis may be helpful when discrepancies between quantitative and qualitative analyses are observed to exclude possible artefacts. |
Acknowledgements
The authors thank Dominic P. Francese, MPH, for assistance in preparing the manuscript.
Funding
This study was an investigator-initiated study and supported financially by St. Jude Medical.
Conflict of interest statement
N. Johnson receives internal funding from the Weatherhead PET Center for Preventing and Reversing Atherosclerosis and significant institutional research support from St. Jude Medical (for this study, NCT02184117) and Volcano/Philips (for NCT02328820); his institution has a licensing and consulting agreement with Boston Scientific for the smart-minimum FFR algorithm, and he donates any speaker’s honorarium to his institution. W. Fearon receives institutional research support from Abbott Vascular, Medtronic, ACIST Medical, and CathWorks and serves as a consultant to HeartFlow Inc. G. Mintz received honoraria from Boston Scientific and ACIST Medical, as well as fellowship or grant support from Boston Scientific and St. Jude Medical. K. Oldroyd reports receiving speakers’ fees from Abbott Vascular and Boston Scientific. B. De Bruyne receives institutional consultancy fees and research support from St. Jude Medical. N. Pijls receives institutional grant support from St. Jude Medical, serves as a consultant for St. Jude Medical, Boston Scientific, and OpSens, and possesses equity in Philips, GE, ASML, and HeartFlow. Z. Ali receives institutional grant support from St. Jude Medical, Cardiovascular Systems Inc, National Institutes of Health, is a consultant to St. Jude Medical, ACIST Medical, and Boston Scientific, and holds equity in Shockwave Medical. A. Maehara receives institutional research grants from Boston Scientific and Abbott Vascular. A. Jeremias receives institutional research support and serves as a consultant for Volcano/Philips Corporation and Abbott Vascular. The other authors have no conflicts of interest to declare.
Supplementary data
Supplementary Appendix 1. Statistical methods.
To read the full content of this article, please download the PDF.