Abstract
Aims: Frequency-domain optical coherence tomography (FD-OCT) provides a rapid tomographic scan of a coronary vessel, with an accurate reconstruction of its lumen profile. An FD-OCT-based metric that corresponds more closely with physiological significance of lesions may enable more precise guidance of interventional procedures. The aim of this feasibility study was to evaluate a new method for quantifying coronary lesion severity that estimates hyperaemic flow resistance of branched vessel segments imaged by FD-OCT.
Methods and results: An analytical flow model was developed that relates fractional flow reserve (FFR) to the vascular resistance ratio (VRR), a measure of blood flow resistance derived from volumetric FD-OCT lumen profiles. The VRR-FFR relationship was evaluated in 21 patients on whom both pressure measurement and FD-OCT imaging were performed in a random order during maximal hyperaemia. Lesion severity assessed by VRR showed a stronger linear correlation with FFR measurements (before model optimisation [blinded]: r=0.81; p<0.001; root mean square error [RMSE]=0.095 FFR units; after model optimisation [unblinded]: r=0.91; p<0.001; RMSE=0.066 FFR units) than quantitative coronary angiography and FD-OCT-derived measurements of minimum lumen area (r=0.67; p=0.0012) and per cent area stenosis (r=–0.61; p=0.004).
Conclusions: Accurate volumetric measurement of the lumen profile with FD-OCT correlates more closely with FFR than standard metrics derived from single image cross-sections. VRR shows promise as a method for evaluating lesion severity.
Introduction
Angiographic assessment of lumen narrowing remains the predominant method by which coronary lesions are identified and treated in the catheterisation laboratory. However, the most common metrics of lesion severity measured by quantitative coronary angiography (QCA) and intravascular ultrasound (IVUS), minimum lumen area (MLA) and per cent area stenosis (%AS), have equivocal relationships with the physiological significance of a lesion1-6. The high resolution and acquisition speed of intravascular frequency-domain optical coherence tomography (FD-OCT) enable rapid and accurate measurement of the coronary lumen over the entire vessel length, including the lesion and its adjacent reference segments7-11. This volumetric lumen-profiling capability of FD-OCT provides an opportunity to extend the assessment of lesion severity beyond single cross-sections. FD-OCT, used in conjunction with models of blood flow resistance, has the potential to overcome many limitations of conventional measures of lesion severity based on QCA and IVUS.
Fractional flow reserve (FFR), measured with a pressure wire, has been shown to be an effective means of assessing the functional impact of coronary lesions and the need for intervention12. In accordance with its proven outcome benefits, the FFR-guided strategy has become the gold standard for treatment of coronary lesions of intermediate severity13,14.
The primary objective of this feasibility study was to investigate the relationship between FFR and the vascular resistance ratio (VRR), a quantitative measure of lesion severity that estimates the hyperaemic flow resistance of vessel segments from volumetric information derived from FD-OCT pullback images. Based on a mathematical blood flow model, VRR accounts for longitudinal variations in the cross-sectional diameter of the coronary lumen as well as the effects of side branches and microvascular resistance. A secondary objective of this study was to elucidate the sources of uncertainty in the relationship between FFR and single cross-sectional measurements.
Methods
STUDY POPULATION AND DESIGN
Twenty-one patients with stable angina were evaluated at a single centre. The study protocol was conducted under good clinical practice conditions and in compliance with the Medical Device Regulations for Italy. The ethics review committee of the Ospedali Riuniti di Bergamo approved the protocol. Patients provided written informed consent before enrolment. Eligible patients (age >18 years) had a single de novo lesion in a native coronary artery with lesion length ≤25 mm, diameter stenosis between 50% and 95%, and reference vessel diameter (RVD) between 2.5 and 4.0 mm by visual estimation. Patients with an additional lesion in a second coronary artery were eligible for enrolment if the other inclusion criteria were fulfilled. Key exclusion criteria were multiple lesions in the target vessel, acute myocardial infarction (ST-elevation myocardial infarction [STEMI] or non-ST-elevation myocardial infarction [NSTEMI] with elevated CK/CK-MB values), renal insufficiency (defined as serum creatinine >2 mg/dL), implantation of a stent within the last six months, stroke or transient ischaemic attack <3 months before the procedure, and allergy or contraindication to aspirin/clopidogrel.
CORONARY ANGIOGRAPHY
Coronary angiograms were acquired in multiple orthogonal views according to standard practices and analysed offline by an independent core laboratory (University Hospitals Case Medical Center, Cleveland, OH, USA) using a commercial QCA software package (CAAS II; Pie Medical, Maastricht, The Netherlands)15.
FRACTIONAL FLOW RESERVE
Fractional flow reserve was measured according to a standard protocol12 with a 0.014 inch pressure-recording guidewire (PressureWireTM Certus FFR Measurement System; St. Jude Medical, Uppsala, Sweden) introduced through a 6 Fr guiding catheter into the coronary artery. After equalisation of the aortic pressure reading (Pa) at the exit of the guide catheter, the distal pressure (Pd) was recorded with the pressure sensor positioned in the main branch of the coronary artery at a location at least 1 cm beyond the distal edge of the stenosed segment. Once a stable pressure signal had been obtained, baseline measurements were recorded. Distal pressure and aortic pressure were measured at baseline and at maximal hyperaemia during adenosine intravenous infusion16. The measured value of the pressure ratio Pd /Pa represented the FFR of the entire coronary branch, rather than within the narrowest segment visible by angiography. FD-OCT imaging and FFR measurements were performed sequentially in the target coronary vessel in a randomised sequence. All patients received intracoronary nitroglycerine (0.2 mg) before coronary angiography and before the FFR and FD-OCT measurements. An FFR value ≤0.80 was used to identify ischaemia-causing stenoses for coronary intervention.
FREQUENCY-DOMAIN OPTICAL COHERENCE TOMOGRAPHY (FD-OCT)
FD-OCT images were acquired with a C7XRTM OCT Imaging System (St. Jude Medical, Westford, MA, USA) at 100 frames/sec, with an automatic pullback speed of 20 mm/s. Blood was cleared during the pullback by injection of contrast medium at 3-4 ml/s over a period of 3-4 sec. Approximately 270 cross-sectional images were recorded over a 54 mm segment of the coronary vessel that included the target lesion. The starting position of the OCT pullback was aligned as closely as possible to the distal end of the lesion, just proximal to where the FFR pressure measurement was obtained. When OCT imaging was performed first (according to the random-order protocol), the OCT pullback was started at least 1 cm distal to the target lesion, with the marker on the OCT catheter placed at a fixed distance from an angiographic landmark. Using the angiographic landmark as a reference, the pressure transducer was then positioned as close as possible to the location of the OCT marker. A similar registration procedure was followed when the FFR measurement was performed first, except that the roles of the OCT catheter and pressure wire were reversed. The position of the pressure wire relative to the position of the marker on the OCT catheter was recorded by angiography to verify proper positioning. The image data were stored digitally and submitted for off-line analysis.
FD-OCT IMAGE ANALYSIS
All cross-sectional images (frames) were initially screened for quality assessment by two expert reviewers (AM, NL) blinded to the FFR measurements. They reviewed each frame of the pullback for the presence of image artefacts and corrected the software-generated contours when required9. The proximal and distal reference segments of the target lesion were identified manually by the contour of the lumen. Off-line quantitative analysis automatically measured the lumen area in each frame and recorded the locations and diameters of the side branches. The diameters measured by OCT at the branch ostia were assumed to represent the lumen diameters along the entire length of the branches; therefore, any branch stenoses outside the scan region of the OCT system were not included in the data analysis. Percent AS was measured as the percentage difference between the MLA and the mean of the proximal and distal reference areas. Along with the coordinates and mean diameters of the side branches, the cross-sectional lumen areas and diameters computed for all pullback frames were exported to an electronic spreadsheet for computation of the blood flow resistances of each lesion segment.
VOLUMETRIC ASSESSMENT OF LESION SEVERITY WITH OCT
To characterise the functional severity of a stenotic vessel segment imaged by OCT, a measure of its volumetric blood flow resistance, called VRR, was computed17. The method of calculation of VRR used in this study is detailed in the Online Appendix. Briefly, VRR was defined as a ratio, RS/RT, where RS is the hyperaemic blood flow resistance of the stenotic segment and RT is the total flow resistance of the entire vessel, which includes the microvascular resistance. VRR accounts for the contributions of frictional and separation pressure losses within flow-limiting lesions, as well as the redistribution of flow into side branches. It also incorporates mathematical scaling laws that approximate the relationship between the microvascular resistance and the diameters of the coronary branches. When computed under hyperaemic flow conditions, VRR has a simple inverse linear relationship with fractional flow reserve: FFR=1-VRR.
COMPARISON OF FFR AND MLA MEASUREMENTS
In previous studies, a non-linear relationship has been observed between FFR measurements and MLA measured by QCA or IVUS4-6. In this study, we used a simplified version of the VRR flow resistance model to derive a mathematical equation (Eq. 2, Online Appendix) that describes this relationship for discrete lesions. The derivation of this equation and the methods used to quantify the effect of MLA uncertainty on FFR predictions are explained in the Online Appendix.
STATISTICAL ANALYSIS
Data are reported as mean±SD unless otherwise noted. The Pearson correlation coefficient was used to describe the correlation between the FFR and OCT-derived MLA values, as well as the correlation between FFR and VRR. To assess statistical significance of the correlations, the two-tailed Student’s t-test was applied with n-2 degrees of freedom (n=number of measurement pairs). The root mean square error (RMSE) was used to quantify the absolute difference between the 1-VRR and FFR. All statistical calculations were performed using MATLAB scientific computing software (The MathWorks, Natick, MA, USA).
Results
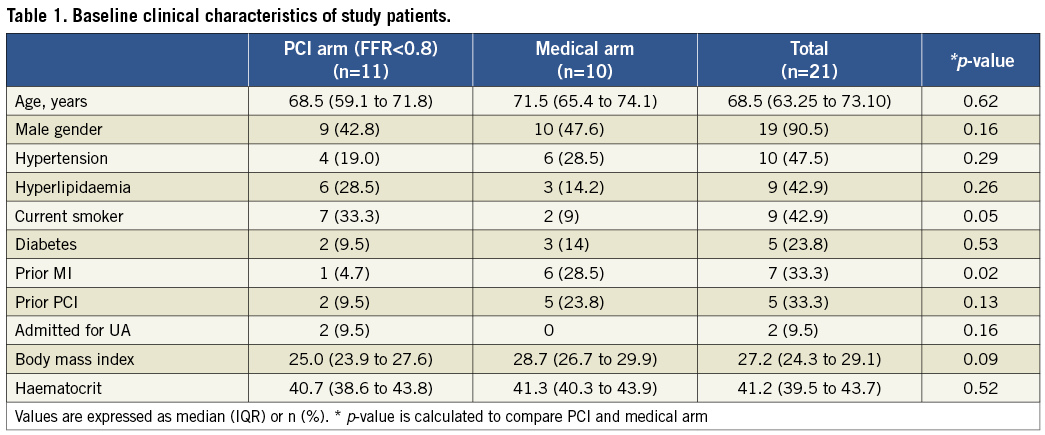
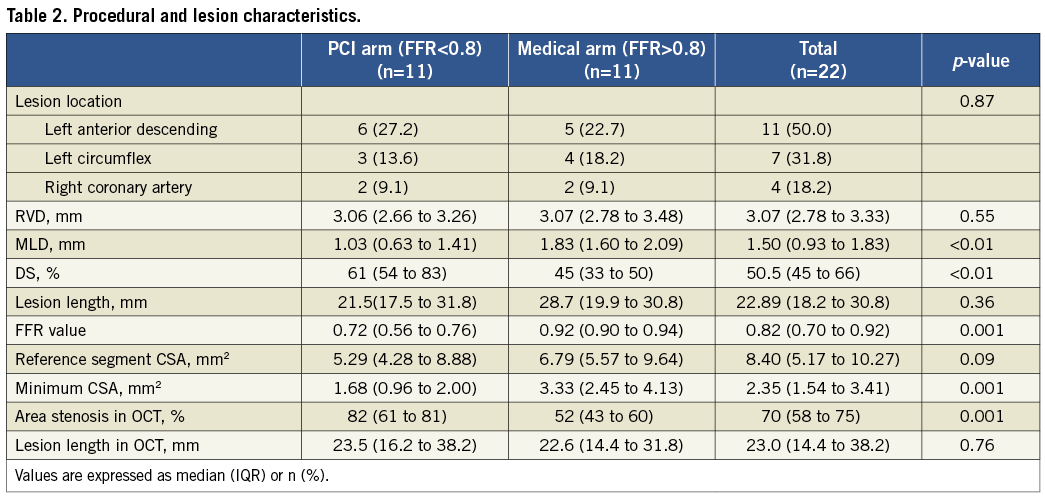
Table 1 and Table 2 summarise the baseline patient and lesion characteristics of the study population. Pressure measurements and FD-OCT imaging were performed in 22 lesions of 21 patients. In accordance with the protocol, stents were implanted only in lesions with measured FFR values ≤0.80 (11/22=50%).
RELATIONSHIP BETWEEN FFR AND MLA, %AS
Two of the 22 measured stenoses were excluded from the analysis due to the presence of more than one lesion in the target vessel. Figure 1A shows the relationship between the FFR values and the FD-OCT-derived measurements of MLA for the remaining 20 lesions. As expected from the analysis in the Online Appendix and the results of previous studies5,18, a straight line fitted the data poorly and the linear correlation coefficient was weak, albeit significant (r=0.67; p=0.0012). Figure 1B shows that non-linear transformation according to Eq. 2 (Online Appendix) increased the linear correlation coefficient from 0.67 to 0.78 (p<0.001); the resultant RMSE was 0.11 FFR units. The corresponding relationships between the FFR measurements and QCA-derived measurements of MLA are plotted in Figure1C and Figure 1D. As with the FD-OCT-derived MLA data, the correlation between FFR and QCA-derived MLA measurements was weak but statistically significant, both before and after non-linear transformation (before linearisation: r=0.69, p<0.001; after linearisation: r=0.71, p<0.001).
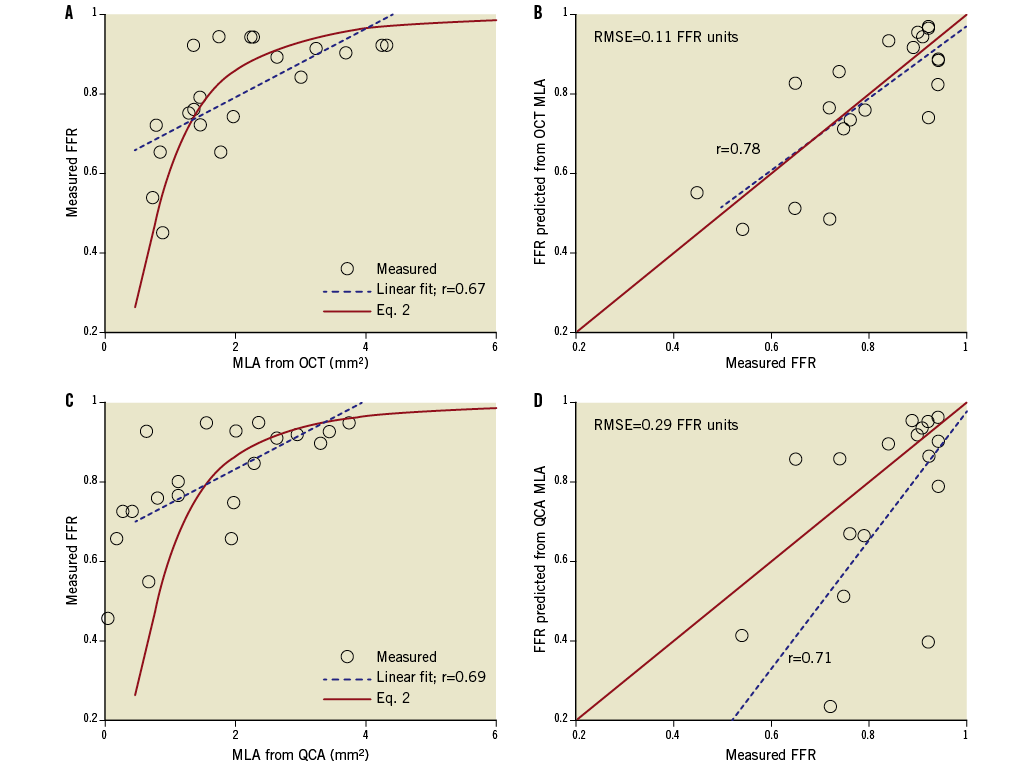
Figure 1. Correlation between OCT-derived MLA measurements and FFR measurements: A) top left, before linearisation, and B) top right, after linearisation. Correlation between QCA-derived MLA measurements and FFR measurements: C) bottom left, before linearisation, and D) bottom right, after linearisation. Figure 1B. shows that non-linear transformation according to Eq. 2 (Online Appendix) significantly improved the linear correlation between FFR and OCT-derived MLA (p<0.001). The corresponding relationships between the FFR measurements and QCA-derived measurements of MLA are plotted in C and D.
Figure 2A shows the experimental relationships between the FFR measurements and the OCT-derived measurements of %AS. Consistent with the results of previous IVUS studies5,6, the %AS measurements varied inversely with FFR (r= –0.61; p=0.004). The QCA-derived %AS measurements exhibited a similar inverse correlation with FFR (Figure 2B; r= –0.68, p<0.001).
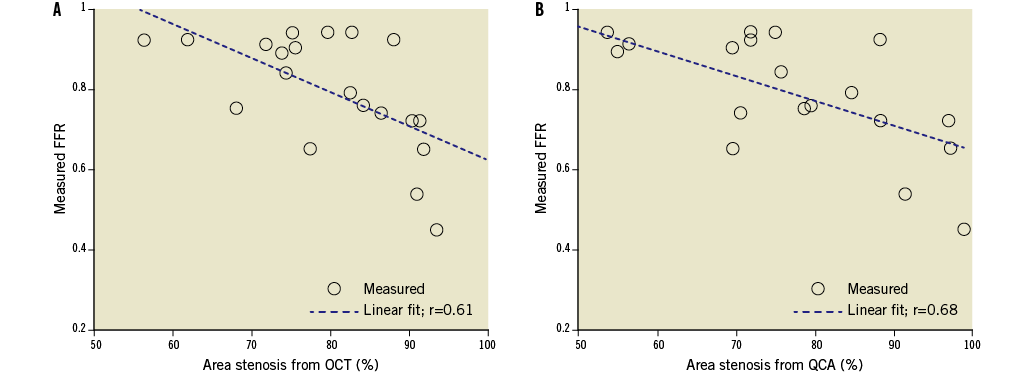
Figure 2. Relationship between FFR and % AS measurements: from A) left, OCT, and B) right, QCA. The correlation coefficients were calculated for a linear fit, although the expected relationship is not expected to be linear, especially at very high degrees of area stenosis.
SENSITIVITY OF FFR TO MLA MEASUREMENT ACCURACY
Figure 3 and Figure 4 show the expected sensitivity of the FFR predictions to MLA uncertainties, with all other potential sources of error neglected. These results indicate that, within the range 0.4 ≤ FFR ≤ 0.8, even small errors in the measurement of lumen area are expected to translate into large FFR prediction errors. As shown in Figure 4, the sensitivity of the FFR-MLA relationship predicted by the model is not constant with minimal lumen diameter (MLD), but peaks in the range of diameters between 0.5-1.5 mm.
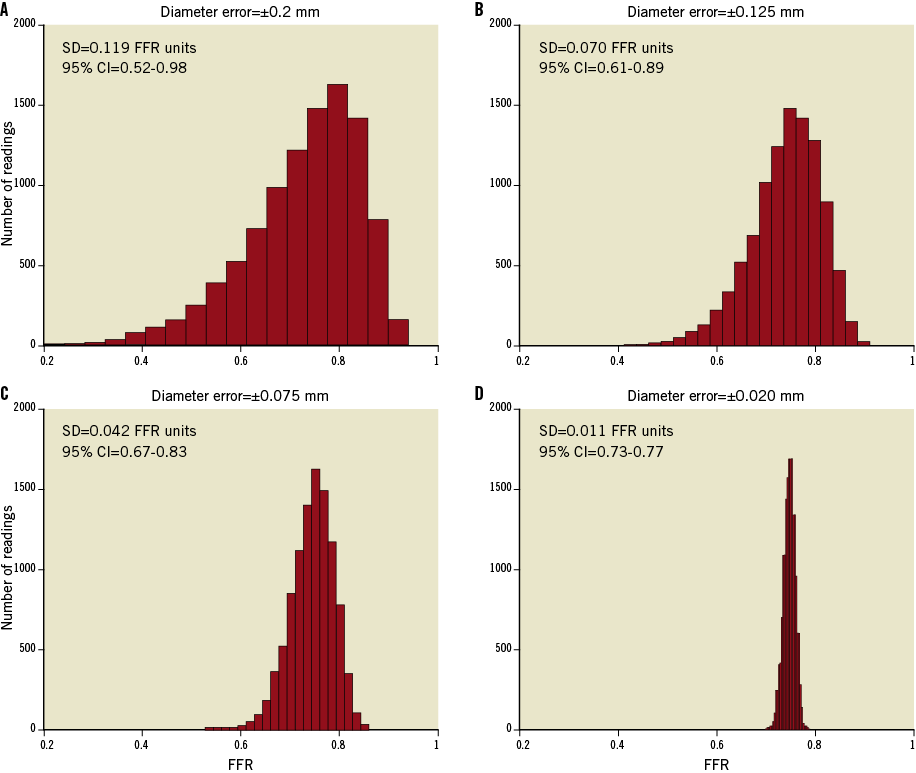
Figure 3. Effect of lumen-diameter measurement errors on MLA-based FFR predictions at a nominal FFR equal to 0.75. A) Top left, RMS diameter error (±1 SD)=±0.2 mm; B) top right, RMS diameter error=–0.125 mm; C) bottom left, RMS diameter error (±1 SD)=±0.075; and D) bottom right, RMS diameter error=±0.020 mm. The distributions were modelled using Eq. 2 (Online Appendix) with k’=0.693 mm2. The diameter errors in panels B, C, and D were chosen to correspond roughly to the MLA measurement errors of QCA, IVUS, and OCT, respectively. The standard deviations and confidence intervals (CI) pertain to the uncertainty of the FFR predictions in FFR units.
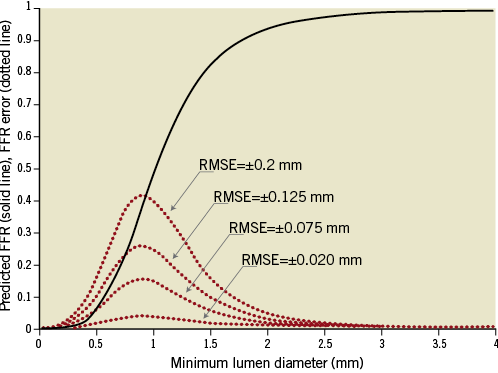
Figure 4. Dependence of FFR prediction uncertainty on MLA. The calculations are based on Eq. 2 (Online Appendix), with k’=0.693 mm2. The solid curve represents the error-free relationship between MLA and FFR, and the dotted line curves show the errors expected from diameter uncertainty in root-mean-square millimetre units. The model predicts that FFR predictions are most sensitive to measurement errors when the actual minimum lumen diameter lies in the range 0.5-1.5 mm.
RELATIONSHIP BETWEEN 1-VRR AND FFR
In this study, a mean clear OCT imaging length of 47±8 mm was achieved, with good image quality over the full 54 mm pullback length in 10 of the 20 analysed OCT cases. Figure 5 shows an example of an OCT image cross-section (minimum area frame) and the corresponding longitudinal-mode (L-mode) image from one of the patient cases. The OCT mean-diameter profiles from which the VRR values were derived and the corresponding plot of the computed longitudinal pressure drop along the lesion are also shown. The values of 1-VRR, calculated from FD-OCT image data using FFR-blinded parameters, correlated significantly with the FFR measurements (r=0.81; p<0.001) (Figure 6A). A small positive bias in the relationship between 1-VRR and FFR was corrected (after “unblinding” of the FFR data) by increasing h-MRv from 100 mmHg·s–1/cm to 115 mmHg·s–1/cm and limiting the maximum hyperaemic flow (including flow through side branches) to less than 4.5 ml/s. As shown in Figure 6B, these modifications improved the correlation between the 1-VRR values and the FFR measurements (r=0.91; p<0.001) and reduced the RMSE from 0.095 to 0.066 FFR units. To test the influence of the side branches on the VRR-FFR relationship, we calculated VRR with and without branch flow. Without branch flow included, the 1-VRR values did not correspond as well with the FFR measurements (no side branches: r=0.78, RMSE=0.092).
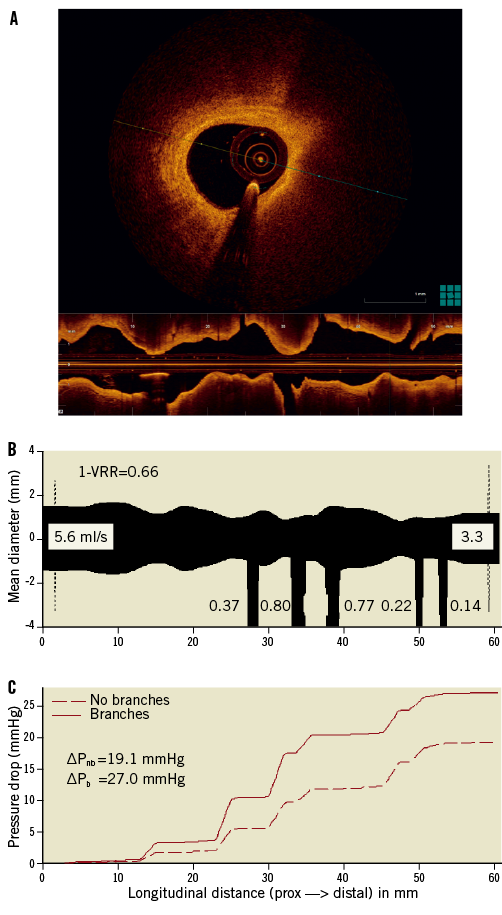
Figure 5. A) Example of an OCT image cross-section (MLA frame) and corresponding L-mode image from one of the patient cases. B) Longitudinal mean-diameter profile derived from the OCT pullback data. The widths of the branches are shown to the scale of the ordinate, with the calculated hyperaemic blood flows shown in ml/s. Because the angular position of the branch is not currently measured and stored by the OCT-VRR software, all of the branches are shown pointing down. C) Corresponding blood pressure curves, calculated by the VRR software as a function of position along the vessel segment. The total pressure drops, with branches and without branches included, ΔPb and ΔPnb , are given below the legend. The mean diameter is defined as ![]() , where Ai is the cross-sectional area of the lumen measured for frame i. The longitudinal positions and diameters of the side branches are shown schematically without regard to their angular orientations. For reference, the hyperaemic blood flow rates estimated by the software are displayed in ml/s for the main and side branches. Note that the proximal and distal ends of the 54 mm lumen profiles measured by OCT are each shown elongated by 3 mm in the Figure.
, where Ai is the cross-sectional area of the lumen measured for frame i. The longitudinal positions and diameters of the side branches are shown schematically without regard to their angular orientations. For reference, the hyperaemic blood flow rates estimated by the software are displayed in ml/s for the main and side branches. Note that the proximal and distal ends of the 54 mm lumen profiles measured by OCT are each shown elongated by 3 mm in the Figure.
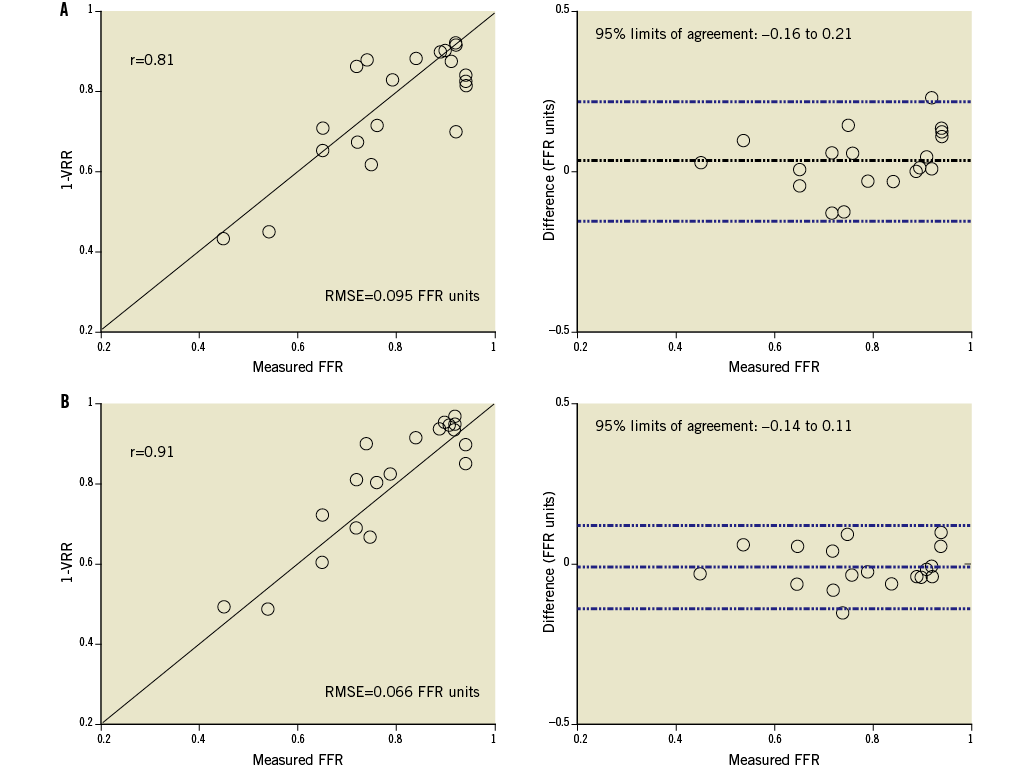
Figure 6. Relationship between (1-VRR) and measured FFR values: A) top graphs, without post-study optimisation (blinded to FFR values), and B) bottom graphs, with post-study optimisation (FFR values unblinded).
Discussion
The main finding of this study is that VRR, a ratiometric measure of flow resistance derived from FD-OCT images, correlates more closely with FFR than the conventional image-based measures, MLA and %AS. The VRR flow resistance model clarifies the roles of the variables that underlie the relationship between anatomical and physiological measures of lesion severity. The model results show that MLA-based FFR predictions are very sensitive to the accuracy of lumen area measurements, particularly for lumen diameters <1.5 mm. As illustrated in Figure 3, at a nominal value of FFR equal to 0.75, the 95% confidence intervals for the predicted values of FFR with diameter uncertainties (±1 SD) of 0.2 mm, 0.075 mm, and 0.02 mm are 0.63-0.87, 0.70-0.80, and 0.72-0.78, respectively. These measurement uncertainties correspond roughly to the respective resolutions of X-ray angiography, IVUS, and FD-OCT. These results are consistent with the findings of previous studies in which a non-linear relationship with high scatter was found between FFR measured by a pressure wire and MLA measured by IVUS5,19, as well as those of Kang et al6 who found that the correlation between IVUS-derived MLA measurements and FFR measurements improved when data from the same coronary branch were evaluated separately. Although the effects of lumen measurement inaccuracy on the MLA-derived values of FFR are difficult to discern directly from previously published experimental results, a recent study by Gonzalo et al19 found a significantly better diagnostic efficiency of OCT-derived MLA versus IVUS-derived MLA for identification of stenoses with FFR <0.8 in vessels <3 mm in diameter. Anatomical studies of porcine arteries20 suggest that the main coronary arteries have different values of microvascular resistance that, according to Eq. 2 provided in the Online Appendix, shifts the inflection point of the FFR-MLA relationship. The high sensitivity of the MLA-FFR relationship to lumen measurement errors may explain, in part, the wide scatter in the experimental data in relating MLA measured by QCA and FFR readings below 0.75 (Figure 1C and Figure 1D). Although the high reproducibility of FD-OCT lumen measurements improves the correspondence between FFR and MLA in the low FFR range, other limitations related to measurement at a single cross-section still make such MLA-based FFR predictions unreliable.
An image-based measure of lesion severity that correlates better with FFR may have potential clinical advantages. In this study, a relatively small RMSE (±0.066 FFR units) was found between the optimised 1-VRR values derived from FD-OCT pullback data and the measured values of FFR. Our analysis suggests that the improved predictive ability of VRR measurements compared to MLA and %AS measurements can be attributed to the accurate lumen-profiling capability of OCT, combined with model-based calculations that account for volume-integrated pressure losses, branch flow, and hyperaemic microvascular resistance. The principles that underlie the computation of VRR can also be applied to IVUS and QCA, but the strong dependence of 1-VRR on the accuracy of cross-sectional lumen measurements in tight lesions may limit the clinical utility of these modalities in this application. Although these results show the feasibility of VRR as a volumetric measure of flow resistance, substantial scatter is evident between model-based predictions of FFR and measured FFR readings. The parameters of the VRR model are based on population averages that account only partially for physiological variations among patients. In particular, the VRR model does not account for individual variations in hyperaemic flow related to local myocardial demand.
A recent study in which FFR was predicted noninvasively using a computational flow model applied to coronary computed tomography also showed significant improvements over single cross-sectional measurements21. In this study, performed on 103 patients, an RMSE of 0.116 FFR units was achieved. The magnitude of this error lies between the error obtained in this study with QCA (RMSE=0.29 FFR units) and that obtained with FD-OCT (RMSE=0.066 FFR units) in the optimised VRR model.
The quantitative methods introduced here should not be regarded as substitutes for FFR measurements in primary stenting decisions. Nevertheless, with further development and validation, volumetric lesion assessment based on OCT imaging has the potential to become a valuable tool for quantitative lesion assessment.
Study limitations
This study was exploratory in nature and the small number of patients limited the statistical power of the study. Caution is advised with respect to generalisation of the results to a wider population including patient cohorts with multiple or long lesions or with acute coronary syndromes. Although patients with lesions in the major coronary arteries were represented in the study, the flow resistance calculations assume relationships that may not hold in all locations of the coronary vasculature or in vessels with extensive collateral circulation. Furthermore, too few patients were studied to derive meaningful cut-off values for stenting decisions from the VRR-FFR correlation. It is possible that the optimisation of model parameters based on measurements acquired from a small patient population resulted in artificially high correlations of 1-VRR values with FFR measurements that may not extend to a broader patient population. At present, flow resistances are calculated by using an approximate analytical model rather than an exact 3-D computational flow model. Errors in the estimates of branch diameters caused by ostial stenosis or non-perpendicular orientation of the OCT catheter with the vessel wall can cause errors in the estimates of hyperaemic flow through target lesions. Although VRR may address several of the limitations of other metrics of lesion severity, it cannot account for individual variations in hyperaemic response and myocardium mass.
Conclusions
A flow resistance model that relates FFR to lesion geometry provides the basis for understanding the limitations of MLA and %AS as measures of lesion severity and the impact of spatial resolution in predicting physiology. VRR, a flow resistance metric derived from OCT images, shows significant correlation with FFR and, if further developed and validated in prospective clinical trials, may eventually help with decision making and interventional procedural planning.
Funding
Ospedali Riuniti di Bergamo, Bergamo, Italy received grant support from LightLab Imaging, Westford, MA, USA.
Conflict of interest statement
G. Guagliumi is a consultant for St. Jude Medical, Boston Scientific and received research grants from Abbott Vascular, Boston Scientific, LightLab, St. Jude Medical. H. Bezerra and V. Sirbu report receiving honoraria grants from St. Jude Medical. C. Petroff, A. Elbasiony, C. Brushett and J. Schmitt are employees of St. Jude Medical, the company that designs and manufactures the PressureWire™ Certus FFR measurement system and C7XR™ OCT system used in the study. The other authors have no conflicts of interest to declare.
Calculation methodologies
CALCULATION OF VRR
The calculation of VRR is based on a lumped parameter model of the blood flow through a stenosed artery (Online Figure 1). In this model, the blood flow, Q, driven by the difference between the mean aortic and venous pressures, Pav=Pa–Pv , is limited by the total flow resistance of the branch, which is composed of three resistance elements, RT=Rs+Re+Rmv , where Rs is the blood flow resistance of the stenotic segment, Re is the blood flow resistance of the length of the vessel outside the lesion, and Rmv is the microvascular resistance under maximal hyperaemia. In this study, Rmv was treated as a variable equal to the hyperaemic microvascular resistance index (h-MRv) divided by the cross-sectional area of the lumen of the proximal reference segment1. The calculation of Rmv is based on the approximation that a constant value of h-MRv applies to all patients, such that total flow in a given branch, limited by Rmv and Pav, scales in proportion to the the cross-sectional area of the proximal reference segment of the branch. Selection of the proximal reference frame in the OCT pullbacks was accomplished by a combination of automatic and manual operations. First, a custom computer programme (St. Jude Medical, Westford, MA, USA) was used to trace the lumen boundaries and to identify the branch locations and diameters automatically. The degree of normality of the cross-sectional images corresponding to the maximum-diameter frames in each of the inter-branch segments was then rated by an OCT expert reader. To judge normality, the expert reader relied primarily on assessment of the thickness and uniformity of the intimal layer. From the set of candidate normal cross-sections, the cross-section with the highest normality rating and largest diameter was selected and the measurements were read by a second custom computer programme (St. Jude Medical, Westford, MA, USA) that generated a tapered normal vessel contour throughout the pullback by applying a scaling relationship (modified Murray’s law)2 between main and side branch diameters. The diameter of the most proximal cross-section of this vessel contour was used as the proximal reference diameter from which the total hyperaemic microvascular resistance of the vessel was calculated.

Online Figure 1. Lumped parameter model of the blood flow resistances in an unbranched vessel segment, consisting of a series combination of the flow-dependent stenotic resistance, Rs(Q), the flow-independent resistance of the unstenosed epicardial portion of the branch, Re , and flow-independent resistance of distal microvasculature, Rmv .
For the FFR-blinded evaluation, h-MRv was set equal to 100 mmHg·s–1/cm, the minimum value measured by Doppler flowmetry in previous studies2. Re was calculated as the viscous flow resistance of the length of the vessel outside the imaged segment, assuming that the entire vessel had a fixed length of 11 cm and a diameter equal to the average of the proximal and distal reference diameters. A variety of methods have been developed for calculation of the flow resistance of stenotic lesions3. For this study, we adapted an analytical method for calculation of Rs developed by Gould, Kirkeeide, and others4,5. The total resistance of the stenosis is assumed to consist of both flow-independent (viscous) and flow-dependent components. The flow-dependent component stems from losses due to flow separation and recirculation at the exit of narrowed regions of the artery. In this study, the effects of variations of the haematocrit on viscous pressure losses were neglected. To account for the distribution of blood flow in branched segments of the artery, we incorporated a series of unbranched resistance calculations into a network of resistances terminated by a fixed venous pressure. Rmv was distributed across all branches by applying a generalisation of Murray’s scaling law for vascular bifurcations2, with the branch diameters measured by OCT. Since it does not include information about branch stenoses outside the scan range of the OCT system, the model does not account for any potential flow redistribution caused by the “branch steal” phenomenon6. The hyperaemic flow rate and flow-dependent resistances in the network branches were then computed by solving a system of equations, assuming Pa–Pv=80 mmHg. The time required to compute VRR was less than one second on a desktop computer equipped with a 2.33 GHz Intel Xeon CPU.
MATHEMATICAL RELATIONSHIP BETWEEN MLA AND FFR FOR SIMPLE LESIONS
The origin of the non-linear relationship between MLA and FFR can be understood by examining the dependence of FFR on the total flow resistance of an arterial branch. If the flow resistance of the artery is assumed to be dominated by the stenotic resistance, then the FFR is given approximately by
![]()
where k is a constant and Am2 is the square of the MLA. To obtain this expression, we assumed, according to the principles of the fluid mechanics of pipe flow, that the stenotic resistance RS varies as the inverse square of the cross-sectional lumen area, such that RS=k/Am2 . Since Rmv depends on the volume of the myocardium region supplied by a given coronary branch, this equation actually describes a family of curves. However, to fit MLA and FFR data with a single curve, Rmv is treated as a constant for all vessels with different MLAs to make k’ the sole fitting parameter. It follows that
![]()
where k’ is a constant (units: mm2) determined from a single-point calibration, k’=
![]()
(1/FFRref –1), with
![]()
equal to the mean-squared value of the MLA at a reference FFR value, FFRref. In this study, Eq. 4 was applied to linearise the MLA-FFR relationship with
![]()
measured at FFRref=0.75.
For evaluation of the sensitivity of FFRpred to the measurement uncertainty of the lumen area, Am in Eq. 2 was treated as a Gaussian-distributed variable with a mean equal to the nominal value of MLA and a standard deviation determined by the measurement error.