Abstract
Aims: A novel method for computation of fractional flow reserve (FFR) from optical coherence tomography (OCT) was developed recently. This study aimed to evaluate the diagnostic accuracy of a new OCT-based FFR (OFR) computational approach, using wire-based FFR as the reference standard.
Methods and results: Patients who underwent both OCT and FFR prior to intervention were analysed. The lumen of the interrogated vessel and the ostia of the side branches were automatically delineated and used to compute OFR. Bifurcation fractal laws were applied to correct the change in reference lumen size due to the step-down phenomenon. OFR was compared with FFR, both using a cut-off value of 0.80 to define ischaemia. Computational analysis was performed in 125 vessels from 118 patients. Average FFR was 0.80±0.09. Accuracy, sensitivity, specificity, positive predictive value, and negative predictive value for OFR to identify FFR ≤0.80 was 90% (95% CI: 84-95), 87% (95% CI: 77-94), 92% (95% CI: 82-97), 92% (95% CI: 82-97), and 88% (95% CI: 77-95), respectively. The AUC was higher for OFR than minimal lumen area (0.93 [95% CI: 0.87-0.97] versus 0.80 [95% CI: 0.72-0.86], p=0.002). Average OFR analysis time was 55±23 seconds for each OCT pullback. Intra- and inter-observer variability in OFR analysis was 0.00±0.02 and 0.00±0.03, respectively.
Conclusions: OFR is a novel and fast method allowing assessment of flow-limiting coronary stenosis without pressure wire and induced hyperaemia. The good diagnostic accuracy and low observer variability bear the potential of improved integration of intracoronary imaging and physiological assessment.
Introduction
Accurate diagnosis of physiologically significant coronary stenosis is of foremost importance to guide percutaneous coronary intervention (PCI) in patients with coronary artery disease. Numerous studies have documented favourable outcome of fractional flow reserve (FFR)-guided PCI compared with angiography-guided PCI1,2. Nevertheless, the clinical adoption of FFR is heterogeneous and quite low on most continents3, partly due to the use of costly pressure wires and hyperaemia-inducing medications. To overcome these limitations, computational approaches to derive FFR from imaging data have been proposed, with promising results when using FFR as the gold standard4,5,6. The foremost important step in these image-based FFR approaches is to create an accurate geometrical model from imaging data. Intracoronary optical coherence tomography (OCT) provides super image resolution in vivo, allowing precise reconstruction of vessel dimensions that is crucial for accurate computation of FFR. In the present study, we developed a new approach for rapid computation of virtual FFR pullbacks from OCT images. The diagnostic performance of this new OCT-based FFR (OFR) was evaluated using wire-based FFR as the reference standard.
Methods
STUDY POPULATION
For the post hoc analysis, three centres with patients who underwent both OCT and FFR evaluation prior to any intervention to the interrogated vessels were asked to provide all eligible patients for analysis. Imaging data were provided by: 1) the Imaging Core Laboratory at University Hospitals Cleveland Medical Center, Cleveland, OH, USA (n=54); 2) Nanjing First Hospital, Nanjing, China (n=29); and 3) The Prince Charles Hospital, Brisbane, Queensland, Australia (n=60). All imaging data were reviewed and analysed by an imaging and haemodynamics core laboratory (CardHemo, Med-X Research Institute, Shanghai Jiao Tong University, Shanghai, China). Patients were excluded for computational analysis if there was: 1) presence of vessel spasm or injury during OCT imaging; 2) OCT not covering the entire lesion; 3) myocardial bridge in the interrogated vessels; 4) substantial thrombosis identified by OCT; 5) suboptimal OCT image quality due to insufficient blood clearance. The analyst reviewed all the fluoroscopic images for the optical sensor where the OCT image pullback started and the pressure sensor position where FFR was measured. If there was stenosis proximal to the pressure sensor position that was not included in the OCT image pullback, the patient would be excluded. The protocol for the registry was approved by each site’s institutional review board, and all patients provided informed consent for enrolment in the institutional database for potential future investigations. All patient and procedural data were obtained from the patients’ medical records.
OCT IMAGING
OCT imaging was performed using frequency-domain OCT systems (C7-XR™ and OPTIS™; St. Jude Medical/Abbott, St. Paul, MN, USA) and Dragonfly imaging catheters. The fibre probe was pulled back at 18 mm/s, 20 mm/s or 36 mm/s within the stationary imaging sheath. Cross-sectional images were generated at a rotational speed of 100 frames/s or 180 frames/s.
COMPUTATION OF OFR
Lumen delineation and computation of OFR was performed using a prototype software package (OctPlus; Pulse Medical Imaging Technology, Shanghai, China) by a trained analyst who was blinded to the FFR values. For each OCT image pullback, the lumen of the coronary artery was automatically delineated and the side branches were automatically detected. Subsequently, the cut-plane perpendicular to the side branch centreline7 was reconstructed and the area of the side branch ostium in the cut-plane was computed. Bifurcation fractal laws were then applied to calculate the reference vessel size, i.e., the healthy lumen as if there were no stenosis, in order to correct the natural change in lumen size due to the step-down phenomenon when crossing the bifurcations8. The area-preservation model was used in order to follow the mass conservation law, assuming that the flow is incompressible9. Finally, the OFR value at each position along the interrogated vessel was computed based on a novel method that was adapted from a validated computational FFR method, applying a virtual volumetric flow rate at the inlet boundary5. Specifically, hyperaemic volumetric flow rate was computed by multiplying the proximal reference lumen area from OCT and a virtual hyperaemic flow of 0.35 m/s4. After computation, the reconstructed artery was colour-coded by the computed OFR values and the OFR value at the most distal location was used to compare with FFR. In case of poor OCT image quality or imaging artefacts, manual adjustment in the lumen contour or the cut-plane position was allowed. Otherwise, the entire procedure was completely automated.
REPRODUCIBILITY OF OFR ANALYSIS
To derive intra-observer and inter-observer variability in OFR analysis, all patients from the centre that enrolled the greatest number of patients were reanalysed by the same analyst one month later and by a second analyst, following the same standard operation procedures and being blinded to each other or to the previous computational results.
FFR MEASUREMENT AND ANALYSIS
FFR was measured in all cases as per standard clinical practice using a 0.014-inch pressure guidewire (St. Jude Medical, Uppsala, Sweden). Pressure equalising was carried out with the guidewire sensor positioned at the guiding catheter tip. The wire was then advanced distal to the target stenosis. Hyperaemia was induced by intravenous administration of adenosine or adenosine 5′-triphosphate at least 140 μg/kg/min. The pressure sensor was returned to the guiding catheter tip to exclude pressure drift if the drift exceeded 0.05. Pressure data were recorded and the tracings were analysed. The minimal and stable position of the Pd/Pa tracing during hyperaemia was used to report the FFR value and disclosed to the OFR analysts after OFR analysis was finished.
STATISTICAL ANALYSIS
Descriptive statistics are reported as mean±SD or as median (quartiles) as appropriate. Categorical variables are presented as percentages. Baseline characteristics were analysed on a per-patient basis and remaining calculations were performed on a per-vessel basis. The correlation was evaluated using Pearson correlation or Spearman correlation as appropriate. The diagnostic accuracy was defined as the classification concordance between OFR evaluated outcomes (≤0.8 or >0.8) and FFR evaluated outcomes (≤0.8 or >0.8). Agreement between FFR and OFR was assessed by Bland-Altman plot. The area under the curve (AUC) by receiver-operating characteristic (ROC) analysis was used to assess the diagnostic performance of OFR and minimal lumen area (MLA). The Youden index was used as criterion to identify the best cut-off value for MLA in predicting functionally significant stenosis. Comparisons were performed by Student’s t-test or by Mann-Whitney U test as appropriate. Heterogeneity between the study centres was assessed using the I2 statistic10 under the assumption that heterogeneity occurred when the degree of inconsistency (using the I2 statistics) was >50% with an associated p-value of <0.05. Comparisons of ROC curves were performed by the DeLong method using MedCalc version 14.12 (MedCalc Software, Ostend, Belgium). Other statistical assessments were performed with IBM SPSS, Version 24.0 (IBM Corp., Armonk, NY, USA). A two-sided value of p<0.05 was considered to be statistically significant.
Results
BASELINE CLINICAL AND LESION CHARACTERISTICS
A total of 143 vessels from 135 patients were analysed in the core laboratory. Eighteen vessels (17 with pullback length of 54 mm, one with pullback length of 75 mm) were excluded according to the exclusion criteria, resulting in 125 vessels with paired OFR and FFR from 118 patients for the computational analysis (Figure 1). Baseline clinical and vessel characteristics are presented in Table 1 and Table 2. The average length of analysable OCT pullback was 52.02±10.52 mm. Figure 2 shows the histogram distribution of FFR and OFR. Average MLA and FFR was 1.83 (IQR: 1.39 to 2.52) mm2 and 0.80±0.09, respectively. FFR ≤0.80 was documented in 63 vessels (50.4%). Seventy-seven (61.6%) interrogated vessels were left anterior descending (LAD). Sixty-nine interrogated vessels (55.2%) had bifurcation lesions and 68 (54.4%) had tandem lesions. In 57 (45.6%) interrogated vessels, the FFR value fell in the range between 0.75 and 0.85.
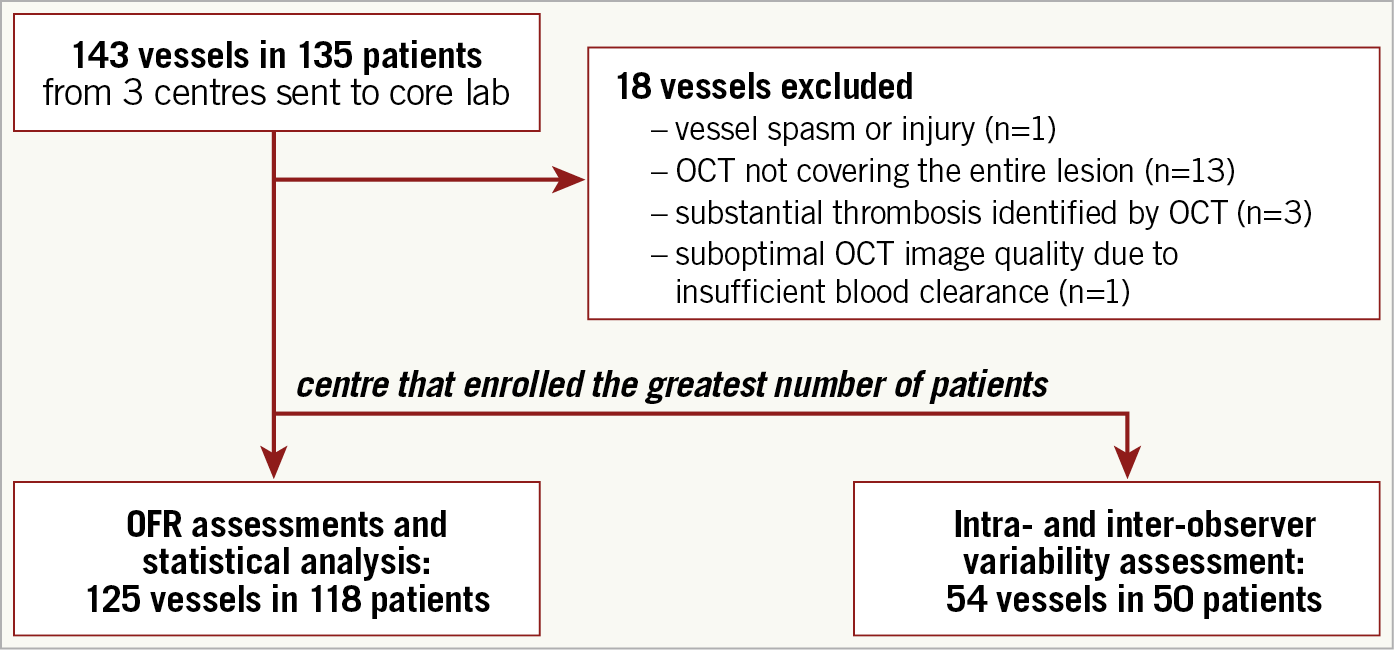
Figure 1. Study flow chart.
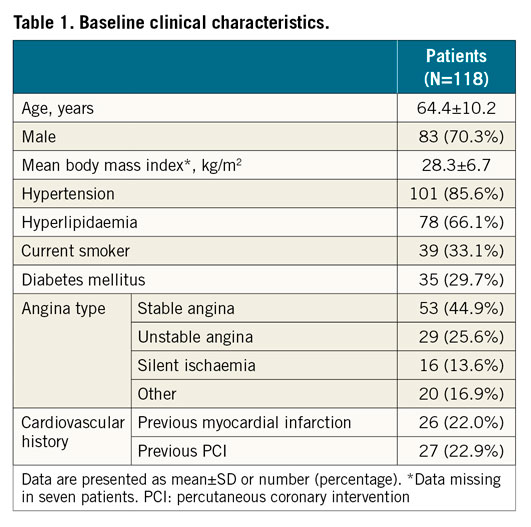
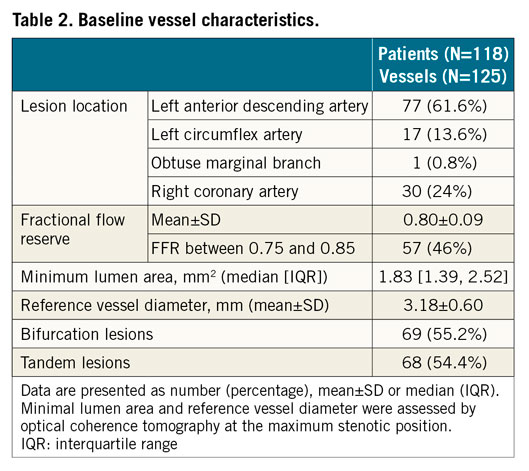
Figure 2. Histogram distribution of FFR and OFR. A) Histogram distribution of FFR. B) Histogram distribution of OFR.
CORRELATION AND AGREEMENT BETWEEN FFR AND OFR
Representative examples of computation of OFR are shown in Figure 3 and Figure 4. OFR had an average value of 0.81±0.09. Figure 5 shows the agreement between OFR and wire-based FFR. Good correlation (r=0.70; p<0.001) and agreement (mean difference: 0.01±0.07; p=0.38; range from –0.16 to 0.31) between OFR and FFR was observed. The I2 statistic for assessment of the mean agreement between OFR and FFR was 0.00, indicating that the between-centre variance component was small enough to be ignored.
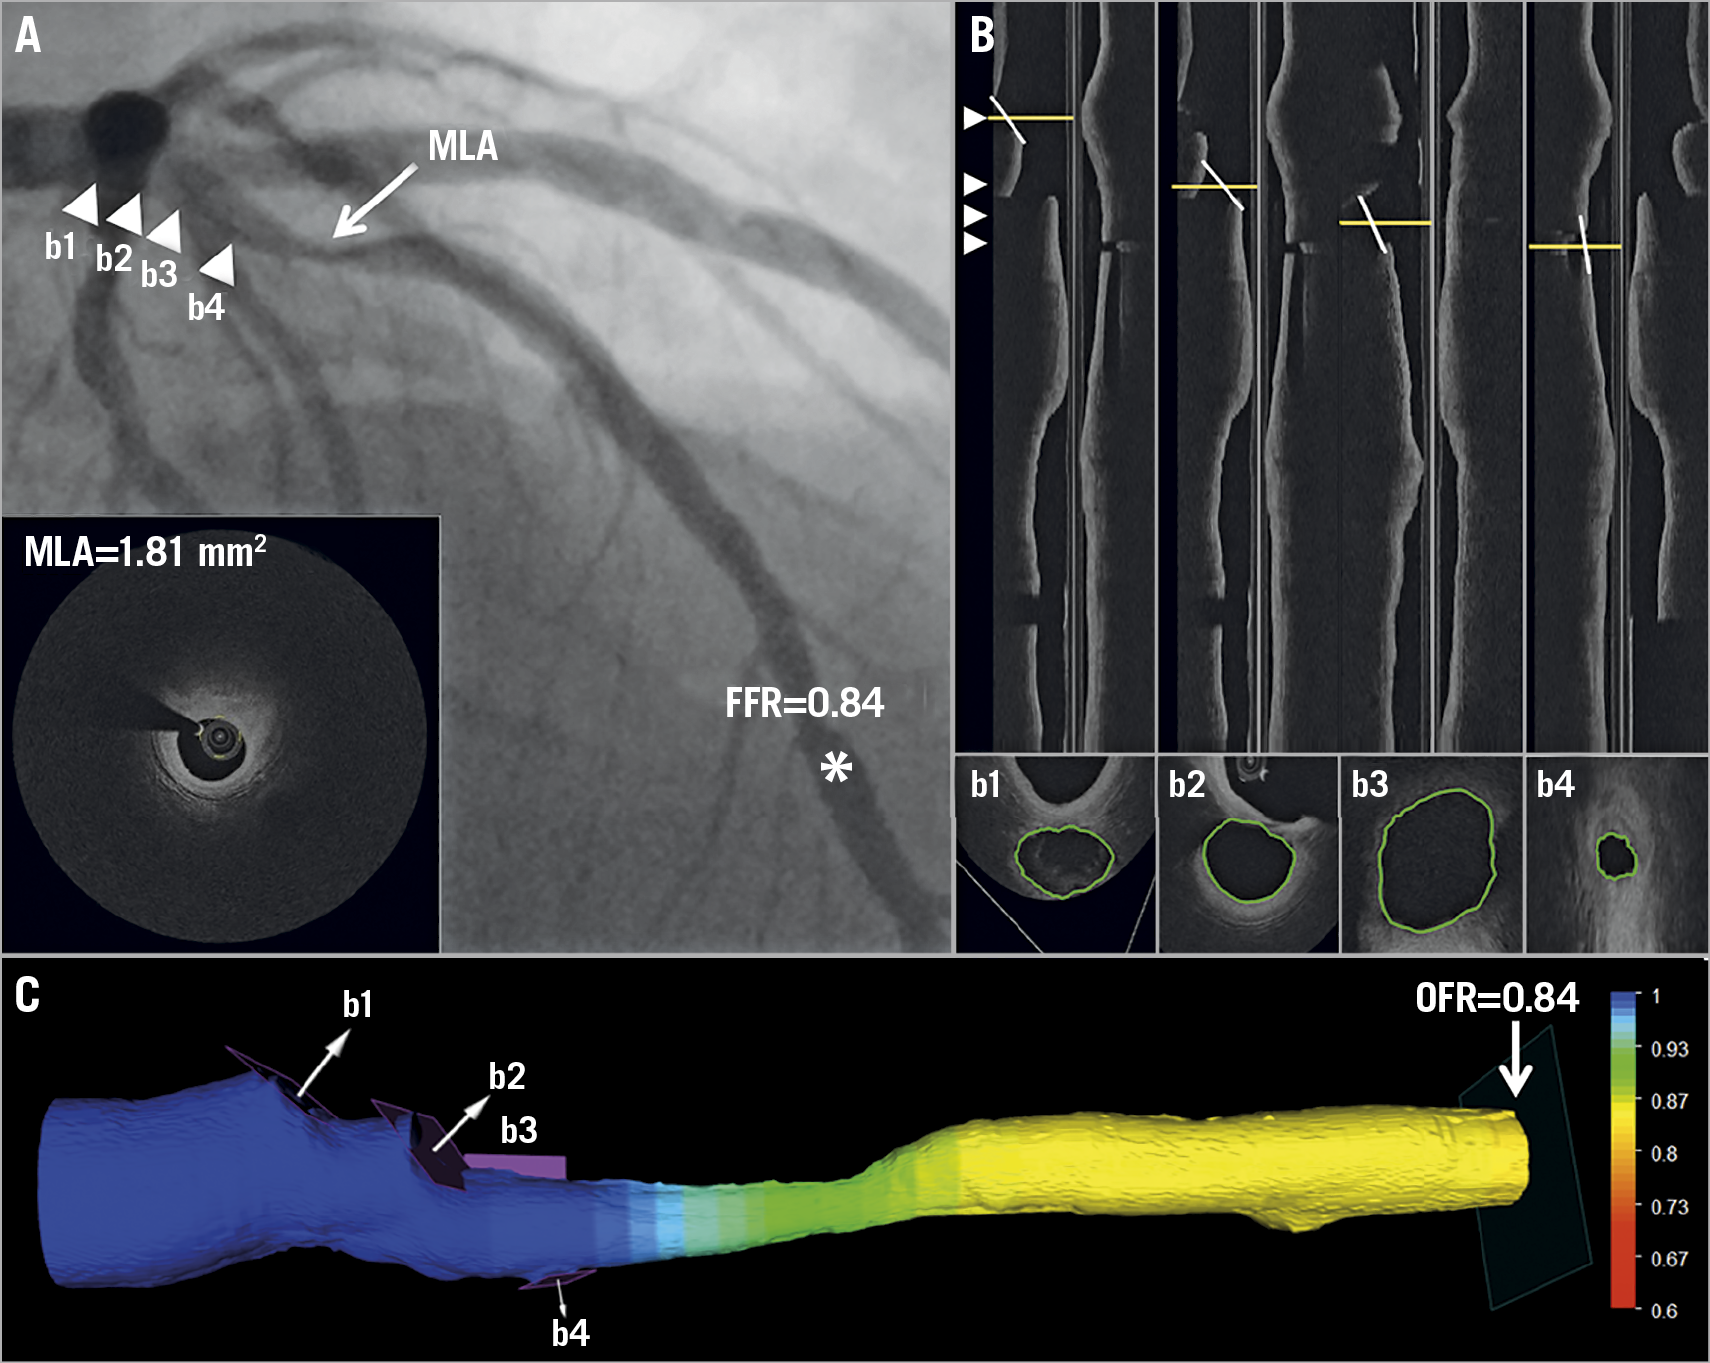
Figure 3. Computation of OFR by OCT on a LAD with physiologically non-significant stenosis. A) Coronary angiography shows a LAD lesion; MLA by OCT is 1.81 mm². FFR measured by pressure wire at asterisk was 0.84. Four white triangles point to the positions of four side branches, which correspond with b1-b4 in panel B and in panel C. B) The four white lines in the OCT longitudinal views show the angulations of the cut-planes (b1-b4) perpendicular to the side branch centreline. The cut-planes were automatically reconstructed and the lumen of the side branch ostia in the cut-planes was automatically delineated. C) The computed OFR value was colour-coded and superimposed on the 3D reconstructed artery. In this case, the computed OFR was 0.84, exactly the same as FFR. FFR: fractional flow reserve; LAD: left anterior descending artery; MLA: minimal lumen area; OCT: optical coherence tomography; OFR: OCT-based FFR
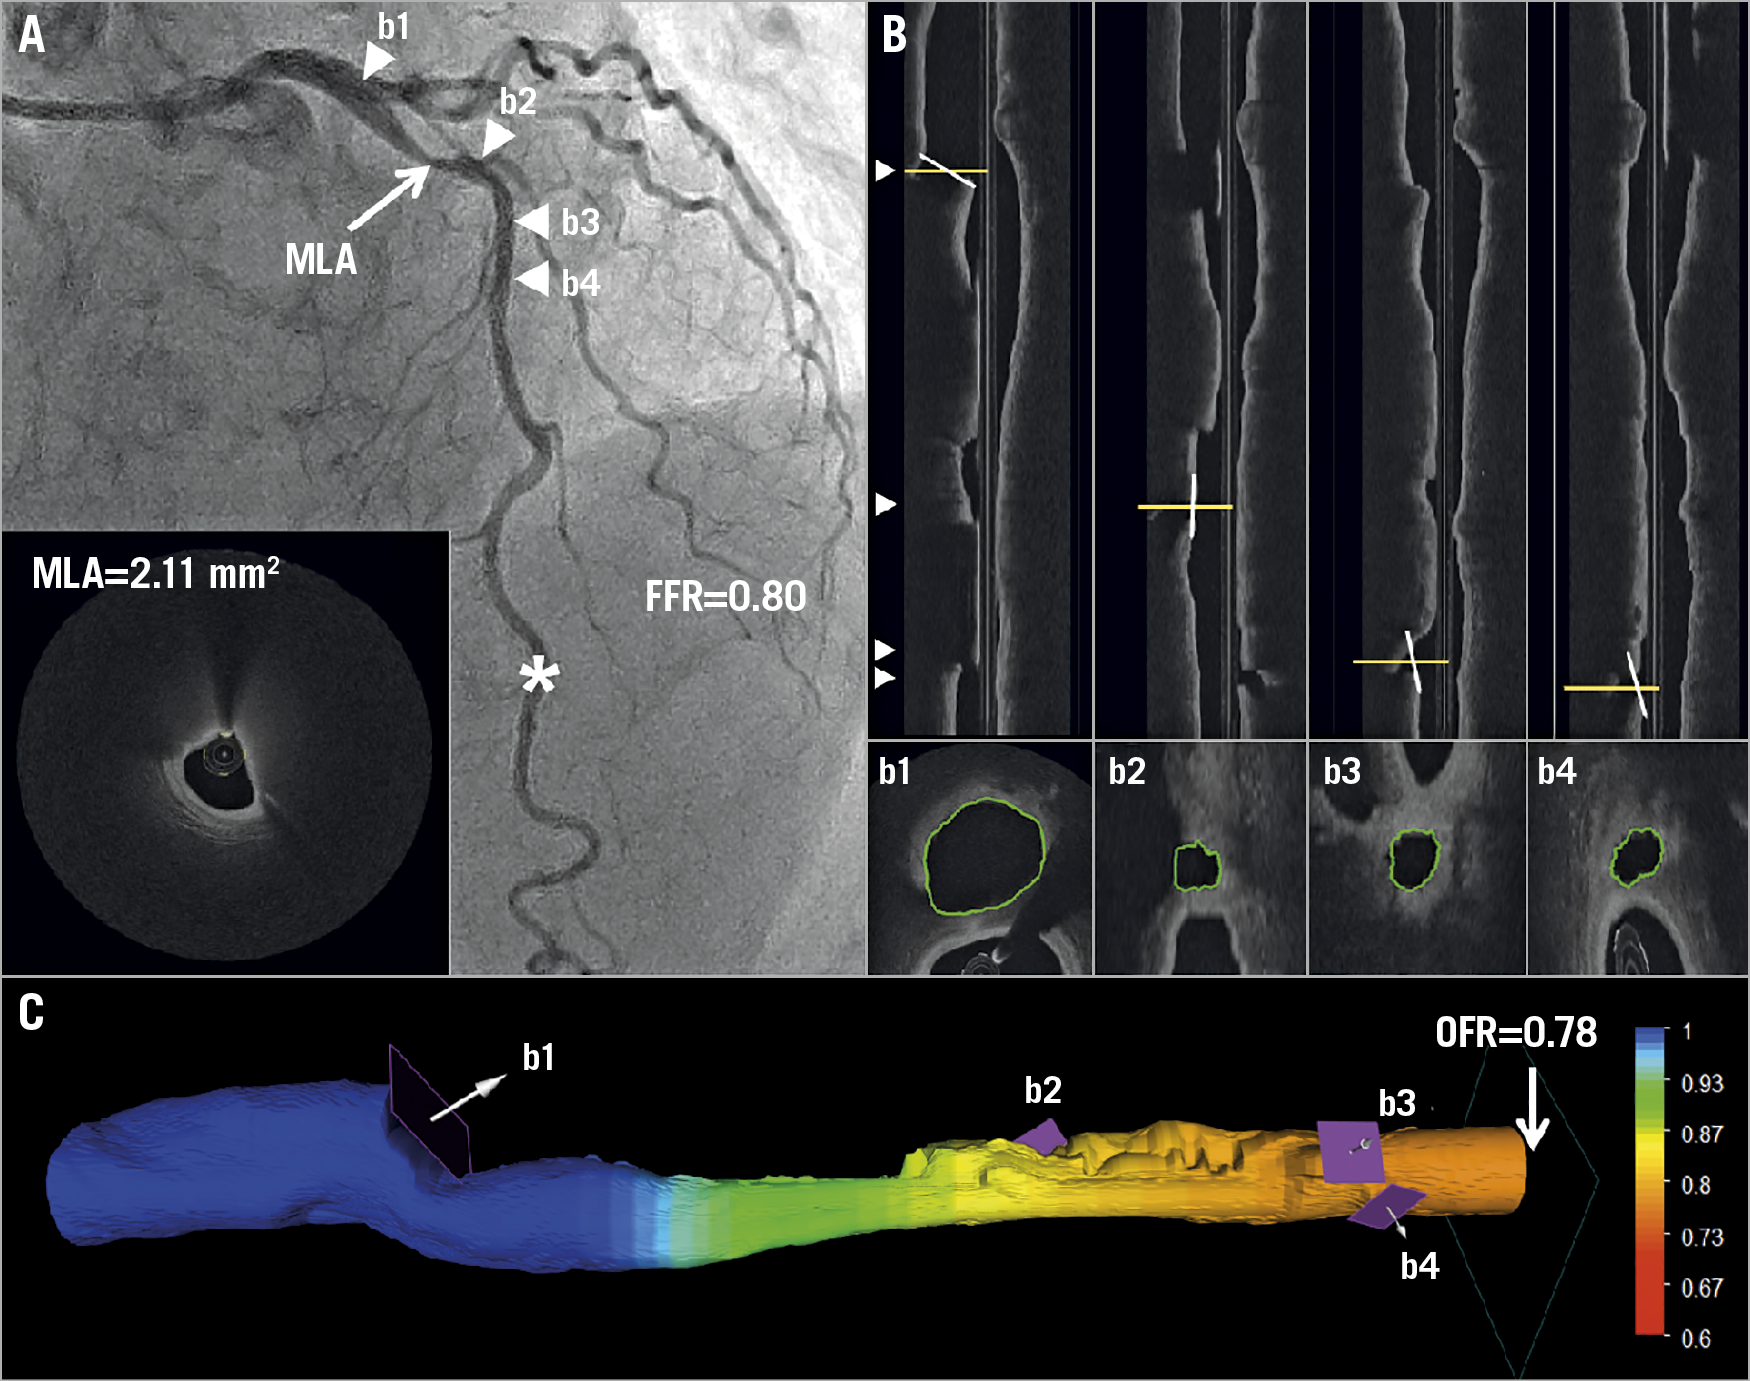
Figure 4. Computation of OFR by OCT on a LAD with physiologically significant stenosis. A) Coronary angiography shows a LAD lesion; MLA by OCT is 2.11 mm². FFR measured by pressure wire at asterisk was 0.80. Four white triangles point to the positions of four side branches, which correspond with b1-b4 in panel B and in panel C. B) The four white lines in the OCT longitudinal views show the angulations of the cut-planes (b1-b4) perpendicular to the side branch centreline. The cut-planes were automatically reconstructed and the lumen of the side branch ostia in the cut-planes was automatically delineated. C) The computed OFR value was colour-coded and superimposed on the 3D reconstructed artery. In this case, the computed OFR was 0.78. FFR: fractional flow reserve; LAD: left anterior descending artery; MLA: minimal lumen area; OCT: optical coherence tomography; OFR: OCT-based FFR
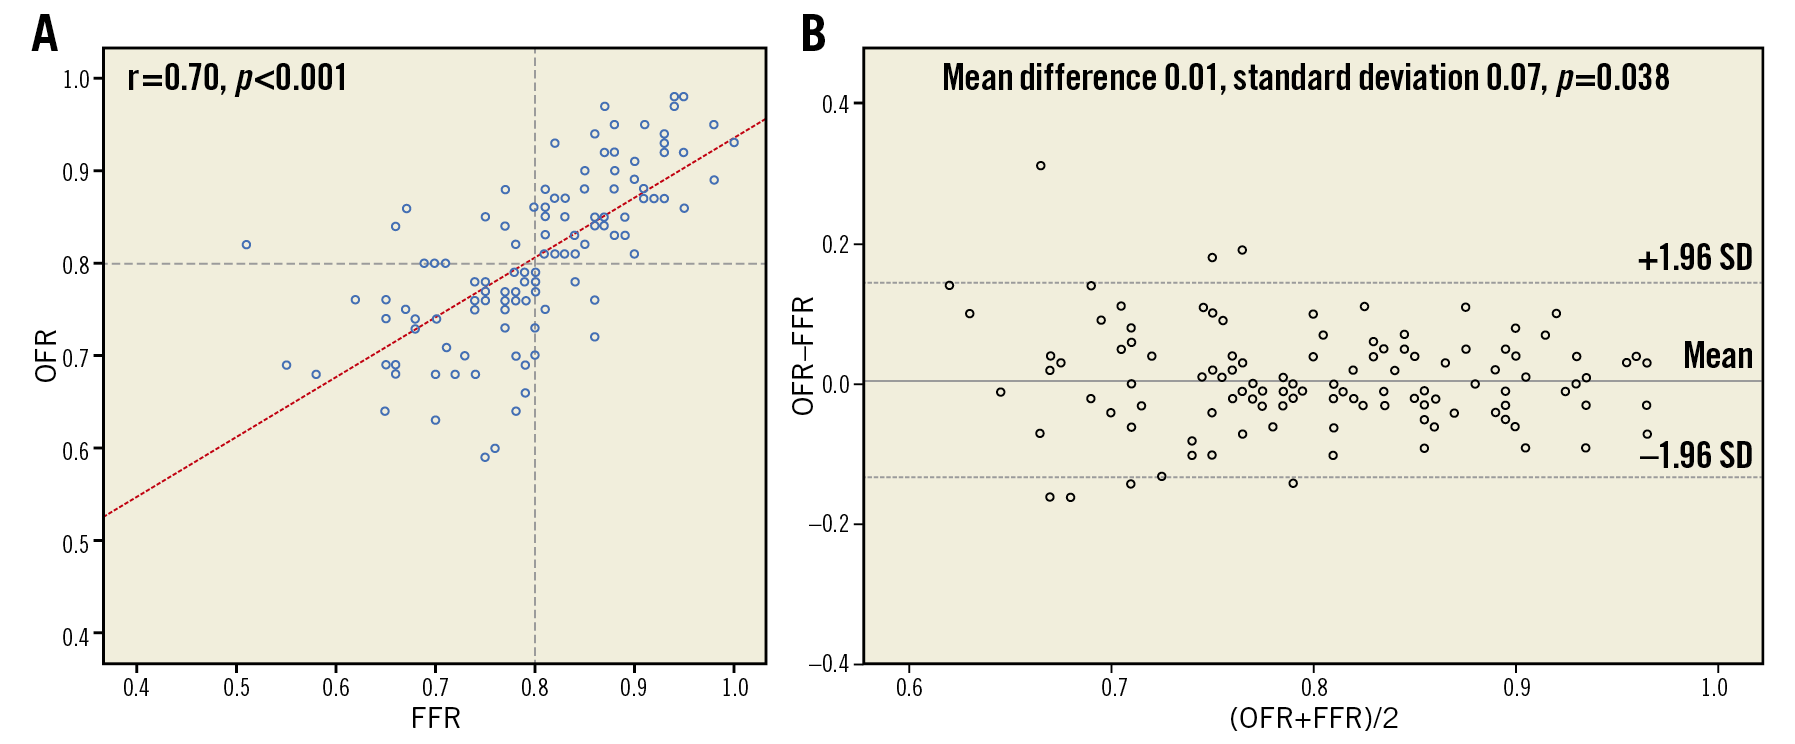
Figure 5. Correlation and agreement between FFR and OFR. A) Good correlation (r=0.70) between FFR and OFR was observed. B) Bland-Altman plot shows good agreement between FFR and OFR. FFR: fractional flow reserve; LAD: left anterior descending artery; MLA: minimal lumen area; OCT: optical coherence tomography; OFR: OCT-based FFR; SD: standard deviation
DIAGNOSTIC PERFORMANCE OF OFR
Using the commonly used FFR cut-off value of ≤0.80, the per-vessel diagnostic accuracy of OFR was 90% (95% CI: 84% to 95%), with 55 true positives, 57 true negatives, 5 false positives, and 8 false negatives. Classification discordance occurred in 13 (10%) vessels (Supplementary Table 1). Patient-level analysis showed similar diagnostic accuracy of OFR, being 90% (95% CI: 84% to 95%).
Overall, OFR substantially improved the accuracy in identifying haemodynamically significant lesions compared with OCT-derived MLA (Table 3). Vessel-based sensitivity, specificity, positive predictive value, negative predictive value, positive likelihood ratio, and negative likelihood ratio for OFR to identify FFR ≤0.80 was 87% (95% CI: 77-94), 92% (95% CI: 82-97), 92% (95% CI: 82-97), 88% (95% CI: 77-95), 10.8 (95% CI: 4.6-25.2), and 0.1 (95% CI: 0.1-0.3), respectively. AUC for diagnosis of physiologically significant coronary stenosis was higher for OFR than MLA (0.93 versus 0.80; difference: 0.13 [95% CI: 0.05 to 0.22]; p<0.01) (Figure 6). The best cut-off value for MLA in determining FFR ≤0.80 was found at 1.89 mm2.
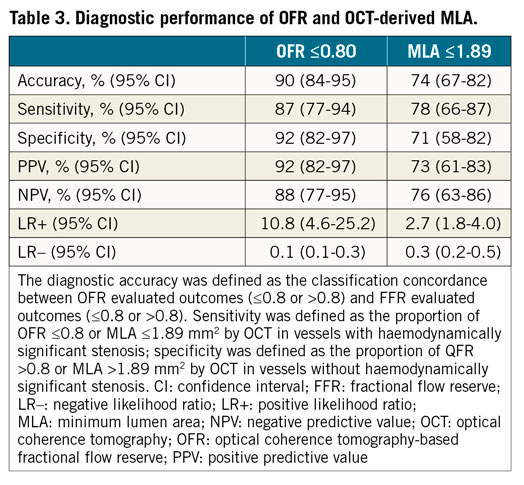
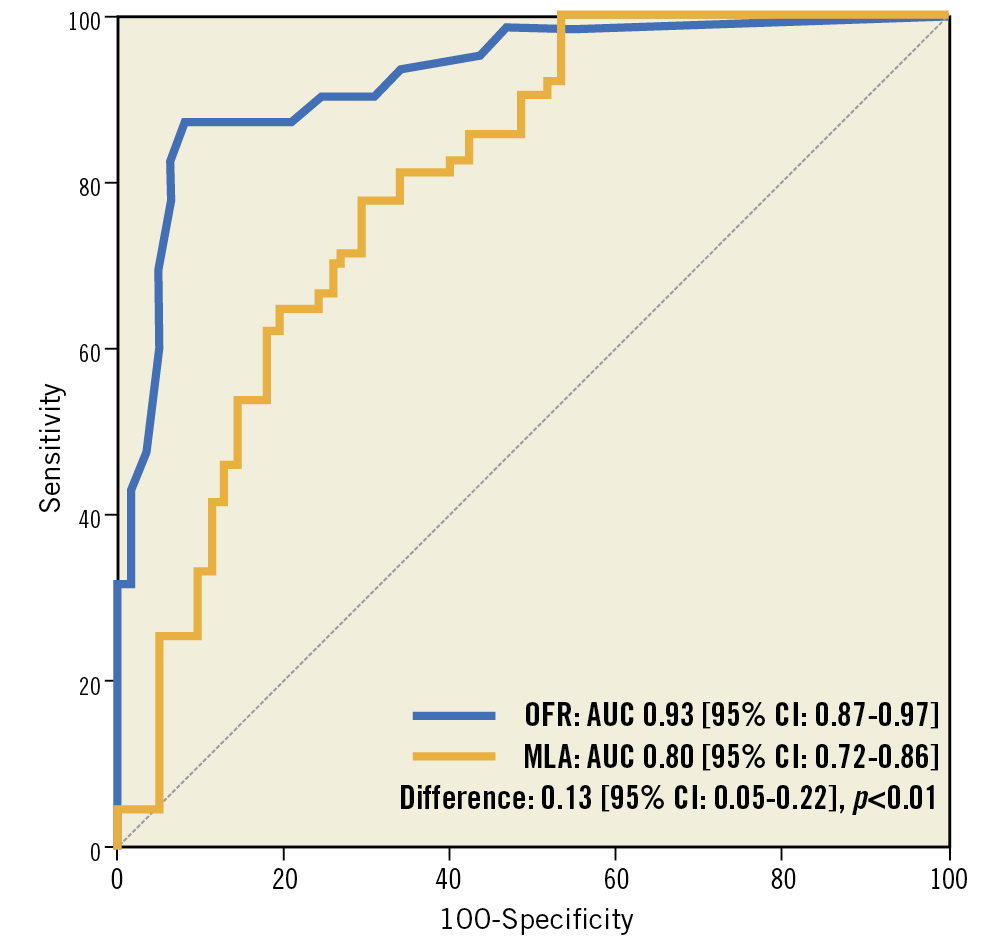
Figure 6. ROC curves for diagnosis of physiologically significant stenoses. OFR shows significantly higher diagnostic accuracy than OCT-derived MLA in identifying flow-limiting coronary stenosis defined by FFR ≤0.80. AUC: area under the curve; FFR: fractional flow reserve; LAD: left anterior descending artery; MLA: minimal lumen area; OCT: optical coherence tomography; OFR: OCT-based FFR; ROC: receiver-operating characteristic
OFR limits to yield specificity and sensitivity >95% were 0.77 (OFR-treat) and 0.85 (OFR-defer). Applying the 95% limits to this sample, use of pressure wires and adenosine could theoretically have been avoided in 68% of all measurements, yielding 95% accuracy with FFR as the reference standard. This analysis assumes that FFR is 100% accurate.
SUBGROUP ANALYSIS
The diagnostic accuracy of OFR was not statistically significantly different between LAD and non-LAD lesions (91% [95% CI: 84% to 97%] versus 88% [95% CI: 78% to 97%], p=0.76) (Supplementary Table 2). The same applied to the diagnostic accuracy in bifurcation versus non-bifurcation lesions (93% [95% CI: 86% to 99%] versus 86% [95% CI: 76% to 95%], p=0.32) (Supplementary Table 3), and in OCT images acquired with a frame rate of 100 frames/s (n=89) versus 180 frames/s (n=36) (91% [95% CI: 85% to 97%] versus 86% [95% CI: 74% to 98%], p=0.43), and in OCT images acquired with low pullback speed (18 mm/s and 20 mm/s, n=94) versus high pullback speed (36 mm/s, n=31) (89% [95% CI: 83% to 96%] versus 90% [95% CI: 79% to 100%], p=0.88).
COMPUTATIONAL PERFORMANCE OF ONLINE OFR
Average analysis time from the moment when the OCT image pullback was loaded in the software package until OFR computation was finished was 55±23 seconds on an off-the-shelf workstation with quadcore Intel i7-4790 processor (Intel Corporation, Santa Clara, CA, USA; 3.6 GHZ) and 8 GB of RAM.
REPRODUCIBILITY IN REPEATED ANALYSIS
Repeated OFR analysis was performed in 54 vessels from 50 patients. Intra-observer variability in MLA and in OFR was 0.01±0.06 mm2 and 0.00±0.02, respectively. Inter-observer variability was 0.03±0.13 mm2 and 0.00±0.03, respectively.
Discussion
We have developed a new approach for fast computation of FFR from intracoronary OCT imaging. When compared with standard pressure wire-based FFR, OFR showed good correlation and agreement in a study population with intermediate coronary stenoses. Using FFR ≤0.80 to define physiological significance of coronary stenosis, the overall vessel-level diagnostic accuracy for OFR was 90%, with sensitivity and specificity of 87% and 92%, respectively. Mean numerical difference between OFR and FFR was 0.01±0.07 (p=0.38).
This level of accuracy and precision was achieved in a challenging population with 55.2% bifurcation lesions. In addition, in 45.6% of the interrogated vessels, FFR was in the range between 0.75 and 0.85 where a smaller numerical difference might lead to diagnostic discordance. In such a study population, the accuracy of OCT-derived MLA for diagnosis of ischaemia defined by FFR ≤0.80 was only 74%. AUC for diagnosis of ischaemia increased from 0.80 to 0.93 by adding OFR computation to OCT luminal quantification. The improved diagnostic accuracy can be attributed to the novel FFR computation algorithm4,5 in combination with the super-resolution imaging by OCT. While OCT imaging provides accurate lumen dimensions for the computation, the FFR computational algorithm integrates all the pressure drops at each stenotic segment of the interrogated vessel4. In addition, we used the side branch cut-plane7 to quantify the area of side branch ostium accurately and used it to calculate the reference lumen size for coronary bifurcations. This is particularly relevant for analysis of bifurcation lesions. Assumption of a linear tapering in reference lumen size would overestimate the lesion severity at the distal main vessel segment or underestimate the lesion severity at the proximal main vessel segment11. As a result, the accuracy of computational FFR can be impaired4. In the present study, we used the area of the side branch ostium in the cut-plane to create a true step-down reference vessel function when crossing bifurcations. This allows more accurate computation of FFR when bifurcation lesions are present. It also explains our observation that the diagnostic accuracy of OFR did not decrease in the subgroup with bifurcation lesions compared with the subgroup without involving bifurcation lesions. Nevertheless, it should be noted that the side branch area might be underestimated when plaque was present in the side branch ostia, possibly impairing the accuracy of OFR computation if the plaque cannot be completely imaged.
COMPARISON TO ANGIOGRAPHY-BASED FFR
We presented earlier a novel approach allowing fast computation of FFR from two angiographic image projections ≥25º apart, denoted as quantitative flow ratio (QFR)4. QFR was validated in prospective studies using FFR as the reference standard, with good diagnostic accuracy of 83% to 92.7%4,5,12 when patient-specific contrast flow was used in the QFR computation. Indeed, OCT has better image resolution than angiographic images, allowing more accurate reconstruction of the coronary lumen that is expected to improve the computational FFR. Nevertheless, the present study found a similar order of diagnostic accuracy in OFR computation with a different study population. This might be explained by the boundary conditions used for the FFR computation. Since OCT provides no information on coronary flow, we used an empirical hyperaemic flow velocity to derive the volumetric flow rate at the inlet boundary in OFR computation. This “one-velocity-fits-all” approach might be inaccurate when patients had myocardial infarction or developed collateral circulation. It was demonstrated in the FAVOR pilot study that QFR computation using a fixed-flow velocity decreased its diagnostic accuracy4 compared with the contrast-flow QFR (from 86% to 80%). Therefore, the gain in diagnostic accuracy by including more accurate lumen dimensions from OCT was partly cancelled by not being able to include true hyperaemic flow velocity in OFR computation. At first, this finding might appear less encouraging, since angiography-based QFR can be performed without an OCT imaging catheter. However, QFR and OFR are complementary in the portfolio of the catheterisation laboratory. While QFR fits nicely in the diagnostic catheterisation laboratory and in routine PCI procedures, OFR is useful for optimising complex PCI procedures. Furthermore, unlike QFR, OFR is not dependent on angiographic projections which might be difficult to obtain in patients with complex coronary anatomy. Besides, OFR is more automated and has lower intra- and inter-observer variability. In addition, the shorter analysis time for OFR also allows efficient utility of the catheterisation laboratory. Finally, a virtual hyperaemic flow velocity by OFR has an advantage in assessing tandem lesions, since interdependence between lesions can theoretically be avoided in OFR computation.
COMPARISON TO OCT-DERIVED MLA
MLA derived from intravascular imaging has been used as a surrogate to determine the functional significance of coronary stenosis when FFR is not available. However, the diagnostic accuracy in the cohort with intermediate lesions is limited13. This is not surprising since several characteristics including lumen area, lesion length, plaque eccentricity, and surface roughness would determine together the pressure drop across the lesion. Thus, a single cross-sectional geometry such as MLA cannot completely present the extent of flow reserve of an entire vessel. In addition, the best cut-off value of OCT-derived MLA varied among studies, ranging from 1.59 mm2 to 2.88 mm2, probably related to the characteristics of the studied patients and vessels13. On the other hand, OFR integrates all these lesion characteristics along the interrogated vessel into the computation of pressure drop. This explains the finding of the present study that OFR substantially improved the diagnostic accuracy of OCT in identifying physiologically significant coronary stenosis.
CLINICAL PERSPECTIVES
OCT provides detailed information that is essential for morphological assessment of coronary lesions and for assessment of the interventional devices. However, its accuracy in identifying ischaemia-causing coronary stenosis is limited13. FFR is considered as the current gold standard for functional assessment of coronary lesions. Combining OCT and FFR assessments is currently demanded for optimal diagnosis and for tailoring the treatment strategies. However, two sets of instrumentation with two disposable catheters/wires are required to obtain both OCT and FFR, which increases procedure time and cost. Rather than using two sets of instrumentation, OFR allows functional and morphological assessments simultaneously using only an OCT imaging catheter with a single pullback. A similar concept was previously proposed, however with different computational models. Most existing OCT-based FFR computational models rely predominantly on computational fluid dynamics14, with the inherent limitations of longer computational time. Seike et al recently presented another method using a simple fluid dynamics equation to reduce FFR computational time to 10 minutes15. However, bifurcations were not taken into account in the FFR computation, which might reduce the diagnostic accuracy in patients with bifurcation lesions. However, the present study found that the diagnostic accuracy of OFR was numerically higher in the cohort with bifurcation lesions compared with the cohort with non-bifurcation lesions, despite being statistically non-significant. This is mainly the result of including the novel cut-plane methodology and the bifurcation fractal laws in the OFR computation. The fast analysis time, good diagnostic accuracy and excellent reproducibility of OFR support its potential in expanding the clinical applications of OCT imaging in the catheterisation laboratory.
Study limitations
The study has several limitations. We were not able to compare the diagnostic performance of OFR with angiography-based QFR, since in many cases angiographic reconstruction could not be performed due to missing angiographic parameters or lack of a second good angiographic projection. For the same reason, we were not able to investigate the impact of a 3D angiography-fused OCT model on the computational results, compared with the straightened OCT model. We did not assess the microcirculation resistance; therefore, we were not able to analyse the correlation of microcirculation dysfunction with the discordance between OFR and FFR. The location of the pressure sensor during FFR measurement was not recorded in all patients. Thus, we were not able to rule out completely those cases with FFR and OFR compared at different locations, which might explain the observation in a few lesions which had low FFR but where OFR was >0.80 (Figure 5). Finally, the sample size was relatively small and only 26 patients had previous myocardial infarction documented by electrocardiography and patient history. This did not allow appropriate evaluation of its impact on the correlation between OFR and FFR. Nevertheless, the current results are encouraging and warrant larger prospective studies to assess the diagnostic accuracy of OFR online during the procedure of OCT imaging.
Conclusions
OFR is a novel and fast method allowing assessment of flow-limiting coronary stenosis without pressure wire and induced hyperaemia. The good diagnostic accuracy and low observer variability bear the potential of improved integration of intracoronary imaging and physiological assessment.
|
Impact on daily practice OFR accurately identifies haemodynamically significant coronary stenosis compared with FFR. The short computational time and excellent reproducibility of OFR support its potential in improved integration of intracoronary imaging and physiological assessment in the catheterisation laboratory. |
Funding
This study was supported by the National Key Research and Development Program of China (Grant No. 2016YFC0100500), the Natural Science Foundation of China (Grant No. 81871460) and The Prince Charles Hospital Foundation (Grant No. MS2012-04).
Conflict of interest statement
S. Tu has received research support from Medis medical imaging systems and Pulse Medical Imaging Technology. The other authors have no conflicts of interest to declare.