
Abstract
Aims: The aim of this study was to evaluate the accuracy of minimum lumen area (MLA) by coronary computed tomography angiography (cCTA) and its impact on fractional flow reserve (FFRCT).
Methods and results: Fifty-seven patients (118 lesions, 72 vessels) who underwent cCTA and optical coherence tomography (OCT) were enrolled. OCT and cCTA were co-registered and MLAs were measured with both modalities. FFROCT was calculated using OCT-updated models with cCTA-based lumen geometry replaced by OCT-derived geometry. Lesions were grouped by Agatston score (AS) and minimum lumen diameter (MLD) using the OCT catheter and guidewire size (1.0 mm) as a threshold. For all lesions, the average absolute difference between cCTA and OCT MLA was 0.621±0.571 mm2. Pearson correlation coefficients between cCTA and OCT MLAs in lesions with low-intermediate and high AS were 0.873 and 0.787, respectively (both p<0.0001). Irrespective of AS score, excellent correlations were observed for MLA (r=0.839, p<0.0001) and FFR comparisons (r=0.918, p<0.0001) in lesions with MLD ≥1.0 mm but not for lesions with MLD <1.0 mm.
Conclusions: The spatial resolution of cCTA or calcification does not practically limit the accuracy of lumen boundary identification by cCTA or FFRCT calculations for MLD ≥1.0 mm. The accuracy of cCTA MLA could not be adequately assessed for lesions with MLD <1.0 mm.
Abbreviations
AS: Agatston score
cCTA: coronary computed tomography angiography
FFR: fractional flow reserve
FFRCT: fractional flow reserve derived from coronary computed tomography angiography
FFROCT: re-computed FFRCT value in a model updated using optical coherence tomography data
MLA: minimum lumen area
MLD: minimum lumen diameter
OCT: optical coherence tomography
Introduction
Recently, application of computational fluid dynamics technology to coronary computed tomographic angiography (cCTA) images has enabled computation of coronary artery blood flow and pressure, and calculation of fractional flow reserve (FFR), without an invasive procedure1. This method, fractional flow reserve derived from coronary computed tomography angiography (FFRCT), has demonstrated a high diagnostic accuracy for detection of ischaemia using invasive FFR as the reference standard2,3, substantiating its potential as a reliable gatekeeper to invasive coronary angiography.
Despite clinical data, it has been hypothesised that the limited spatial resolution of cCTA may impose significant limitations on the accuracy of FFRCT4. Additionally, coronary calcification might hamper accurate estimation of FFR by cCTA, given potential difficulties in lumen border detection due to calcium blooming. Therefore, in this study, we prospectively evaluated the accuracy of the semi-automated lumen boundary extracted from cCTA (HeartFlow FFRCT software version 1.8; HeartFlow, Redwood City, CA, USA) and its impact on FFRCT along the vessel using optical coherence tomography (OCT) data as the reference standard.
Methods
STUDY POPULATION
At two centres in Japan (Kobe University Hospital and Akashi Medical Center), 100 patients with available preprocedural cCTA and OCT data within six months between examinations were enrolled (Supplementary Appendix 1). Patients who underwent clinically indicated coronary angiography and OCT with preprocedural cCTA were eligible for inclusion. Among such patients, lesions with a percentage diameter stenosis between 25% and 75% by angiography were considered for quantitative cCTA and OCT analysis. Each vessel was divided into several lesions based on the side branches (>1.5 mm) to compare lumen areas. We measured the cross-sectional area from CT and OCT lesions, and identified the minimum lumen area (MLA) over the lesion for comparison. To ensure that the vessel diameter was larger than the catheter size, we also measured the linear minimum lumen diameter (MLD) in OCT using a proprietary OCT workstation (St. Jude Medical, St. Paul, MN, USA). MLD was directly computed from the points on the cross-sectional contour instead of being derived from the cross-sectional area that requires a circular cross-sectional assumption. The linear MLD was used to divide the MLA measurement data for a subgroup analysis in OCT and CT MLA comparison. The study endpoints are described in Supplementary Appendix 2.
The study protocol was approved by the institutional review boards of each participating centre, and all patients gave written informed consent.
CORONARY CT ANGIOGRAPHY IMAGE ACQUISITION AND ANALYSIS
cCTA images were obtained in accordance with the Society of Cardiovascular Computed Tomography (SCCT) guidelines on cCTA5. Detailed CT acquisition protocol, parameters and image quality analysis are described in Supplementary Appendix 3-Supplementary Appendix 5. To assess the impact of image quality on the MLA comparison, the signal-to-noise ratio (SNR), contrast-to-noise ratio (CNR), and five-point Likert scale score were calculated, as previously described6.
Quantitative cCTA analysis was performed by HeartFlow, Inc., in a blinded fashion as previously described1,7. The coronary calcium scores for each coronary artery were independently assessed by a CT core laboratory in Kobe University according to the Agatston method8. Agatston score (AS) was evaluated in each vessel.
OCT EXAMINATION AND ANALYSIS
OCT (C7 Dragonfly™; St. Jude Medical, St. Paul, MN, USA) was performed as previously reported9. Off-line OCT analysis was performed to measure cross-sectional area and MLD using a dedicated workstation in the Kobe University OCT core laboratory blinded to the cCTA results. Lumen contours were automatically delineated every 0.2 mm, followed by a manual modification if necessary. Since the size of guidewire and catheter (0.014-inch and 0.9 mm in diameter, respectively9) limits MLD quantification in OCT (Supplementary Figure 1), we divided the vessels (lesions) according to MLD ≥1.0 mm (above the catheter size) and MLD <1.0 mm (below the catheter size) by OCT to isolate potential errors in OCT measurements.
CO-REGISTRATION OF CT WITH OCT DATA AND COMPARISON OF MLA
After unblinding the cCTA and OCT case numbers, the OCT image was co-registered to cCTA data. Briefly, a 3D-OCT model was first constructed by stacking OCT lumen contours along the vessel length. Next, cCTA-derived lumen geometry was straightened along the centreline using a cylindrical coordinate transformation10, and the 3D-OCT model was aligned to the straightened cCTA lumen geometry (Figure 1A). Then, the 3D-OCT model was stretched and twisted to match the straightened cCTA-derived model based on branch ostia (Figure 1B). The co-registered OCT model was bent to the original curved-cCTA space (Figure 1C). Finally, MLAs from OCT and cCTA were detected and compared (Figure 1D).
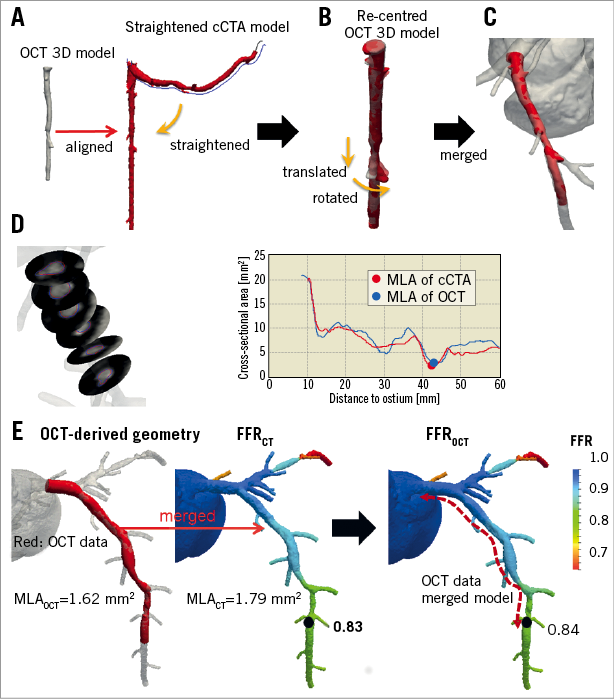
Figure 1. Co-registration of cCTA and OCT images. A) OCT 3D model constructed by stacking 2D slices and straightened cCTA model. B) OCT 3D model re-centred to centroid of each cross-section and illustration of translation and rotation of model. C) OCT 3D model co-registered to cCTA model. D) Cross-sectional contour images and area of co-registered OCT data with cCTA data. E) FFRCT evaluation in OCT-merged model.
COMPARISON OF FFRCT WITH COMPUTED FFR DERIVED FROM OCT-MERGED CORONARY MODEL
To assess the impact of lumen boundary accuracy extracted from cCTA on FFRCT, we compared the original FFRCT with re-computed FFRCT values in a model updated using OCT data, i.e., FFROCT. Specifically, the OCT-derived lumen model was used to replace the cCTA-derived coronary model on corresponding vessel segments using the co-registration method described above (Figure 1E). To evaluate the true effect of segments updated by OCT on FFRCT, all the other arteries and side branches were unchanged. Consequently, all boundary conditions remained the same in the evaluation of FFROCT as in the original FFRCT computation1,7. The comparison of FFRCT with FFROCT was performed on a per-vessel basis at the location immediately distal to the OCT segment; a computed FFR ≤0.8 was considered diagnostic of lesion-specific ischaemia.
STATISTICAL ANALYSIS
The sample size calculation is described in Supplementary Appendix 6. Normally distributed continuous variables were expressed as mean±SD and were compared with two-tailed unpaired t-tests, whereas non-normally distributed continuous variables were expressed as median (interquartile ranges) and compared using the Mann-Whitney U test. Correlation was assessed by linear correlation; mean differences and limits of agreement were assessed by Bland-Altman analysis. The agreement between the two methods was also assessed by the Passing-Bablok method. The Fisher z-transformation statistic was applied for comparing two correlations and the F-test was used to compare variation. A p-value of 0.05 or less was considered statistically significant. All statistical analyses were performed using a commercial software package (SPSS, Version 24.0; IBM Corp., Armonk, NY, USA, and XLSTAT version 2017; Addinsoft, New York, NY, USA).
Results
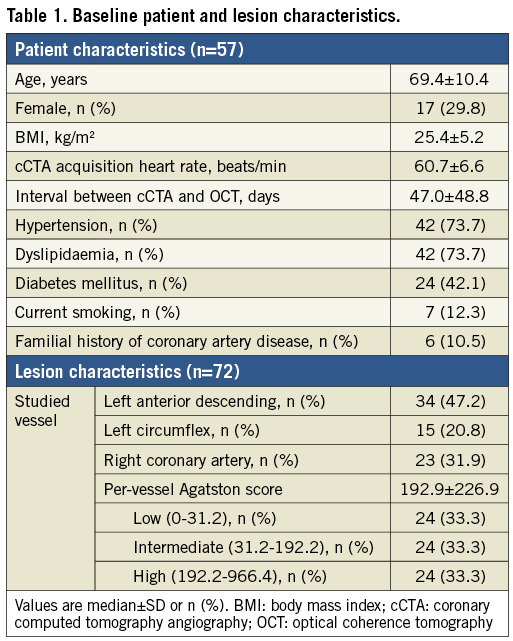
BASELINE PATIENT AND LESION CHARACTERISTICS
From 100 patients, 137 vessels were considered for inclusion in the present study. After excluding 65 vessels, 72 vessels (118 lesions) in 57 patients were included for MLA comparisons. Also, eight vessels were excluded from FFR computation due to the lack of side branches; therefore, we assessed the difference between cCTA and OCT-based FFR in 64 vessels representing 52 patients (Figure 2, Supplementary Appendix 7). Baseline patient and lesion characteristics are summarised in Table 1.
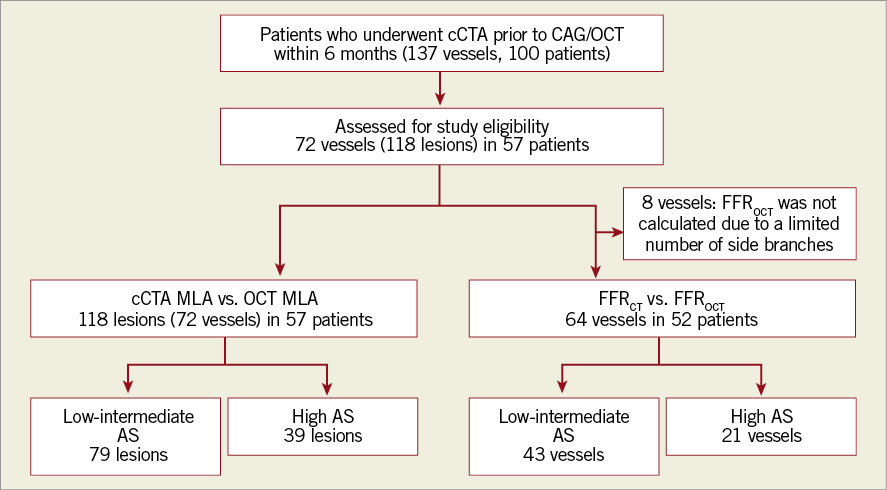
Figure 2. Study population flow chart. AS: Agatston score; CAG: coronary angiography; cCTA: coronary computed tomography angiography; FFR: fractional flow reserve; MLA: minimum lumen area; OCT: optical coherence tomography
COMPARISONS OF MLA AND COMPUTED FFR BETWEEN cCTA AND OCT
Overall, there was no significant difference in the average cCTA and OCT MLAs (Table 2). The average absolute difference in MLA measurements between cCTA and OCT was 0.621±0.571 mm2, with an excellent correlation between the two imaging modalities (r=0.851, p<0.0001) (Figure 3A). Bland-Altman plots of cCTA MLA in relation to OCT MLA showed a mean bias of –0.018±1.652 mm2 with 95% limits of agreement of –1.671 to 1.633 mm2 (Figure 3B).
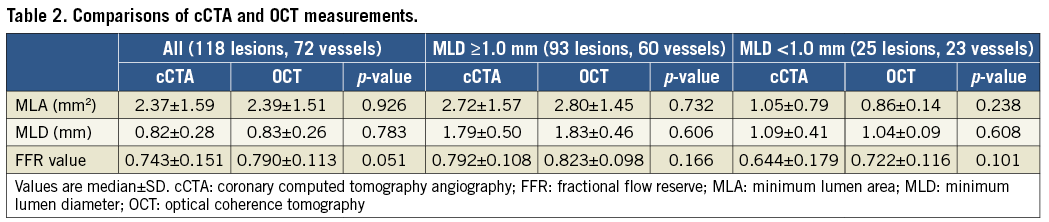
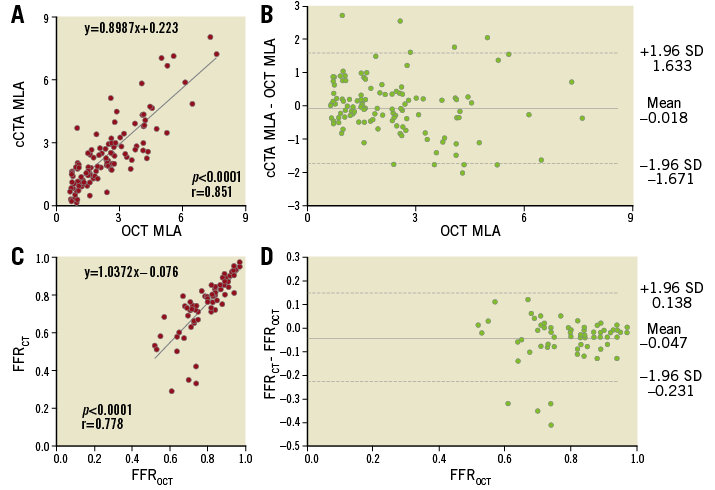
Figure 3. cCTA vs. OCT measurement in the overall population. A) Correlation between MLA from cCTA and OCT. B) Bland-Altman plots of cCTA MLA versus OCT MLA. C) Correlation between FFR from cCTA and OCT. D) Bland-Altman plots of FFRCT vs. FFROCT.
For computed FFR, FFRCT tended to be lower than FFROCT (Table 2). There was a significant positive correlation between FFRCT and FFROCT (r=0.778, p<0.0001) (Figure 3C). Bland-Altman plots of FFRCT in relation to FFROCT showed a mean bias of –0.047±0.185 with 95% limits of agreement of –0.231 to 0.138 (Figure 3D).
No difference was observed in the MLA, MLD, and FFR values between cCTA and OCT in 64-slice, 128-slice, and 320-slice cCTA (Supplementary Table 1). Additionally, image quality measured on the basis of the SNR, CNR, and five-point Likert scale score did not impact on the accuracy of cCTA measurements compared with OCT (Supplementary Table 2-Supplementary Table 4). Significant positive correlations were observed between cCTA and OCT MLAs in lesions with low and intermediate-high image qualities (Supplementary Figure 2).
COMPARISONS OF MLA AND COMPUTED FFR BETWEEN cCTA AND OCT IN LESIONS WITH MLD ≥1.0 mm AND <1.0 mm
When all lesions were divided according to OCT MLD measurements, there was no significant difference in the cCTA and OCT MLAs in lesions with both MLD ≥1.0 mm and MLD <1.0 mm (Table 2). There was a significant positive correlation between the cCTA and OCT MLAs in lesions with MLD ≥1.0 mm (r=0.839, p<0.0001) (Figure 4A.a), whilst the positive correlation was weaker and biased downward in lesions with MLD <1.0 mm (r=0.282, p=0.172) (Figure 4B.a), which was statistically different (p<0.0001). Bland-Altman plots of the cCTA MLA in relation to the OCT MLA showed a mean bias of –0.076±1.683 for lesions with MLD ≥1.0 mm and of 0.193±1.458 for those with MLD <1.0 mm (Figure 4A.b, Figure 4B.b). There was no significant difference in variation between the two groups (F=2.006, p=0.159). For computed FFR, there was no significant difference in the average value of FFRCT and FFROCT between vessels in both groups with MLD ≥1.0 mm and MLD <1.0 mm (Table 2). There were significant positive correlations between FFRCT and FFROCT in vessels with MLD ≥1.0 mm (r=0.918, p<0.0001) (Figure 4A.c) and MLD <1.0 mm (r=0.543, p=0.011) (Figure 4B.c). In the Bland-Altman plots, 95% limits of agreement for vessels with MLD <1.0 mm tended to be wider than for vessels with MLD ≥1.0 mm (–0.368 to 0.211 vs. –0.114 to 0.052; F=3.702, p=0.059) (Figure 4B.d, Figure 4A.d). The Passing-Bablok method showed the same trend (Supplementary Table 5).
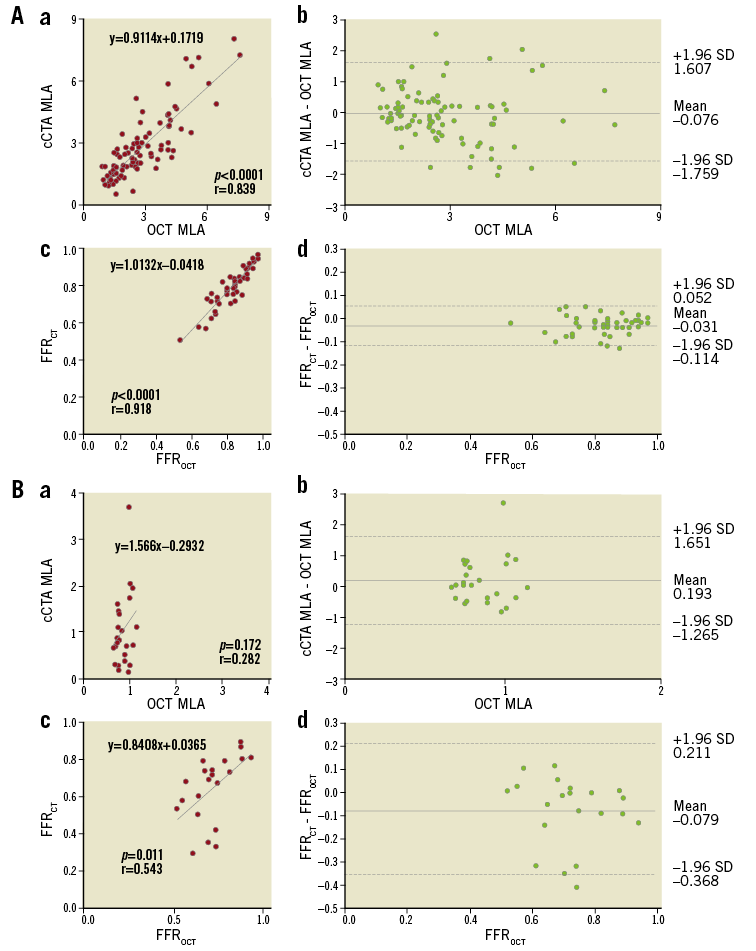
Figure 4. cCTA vs. OCT measurement. A) Lesions with MLD above the catheter size (MLD ≥1.0 mm) and B) MLD below the catheter size (MLD <1.0 mm). a) Correlation between MLA from cCTA and OCT; b) Bland-Altman plots of cCTA MLA vs. OCT MLA; c) correlation between FFR from cCTA and OCT; d) Bland-Altman plots of FFRCT vs. FFROCT.
COMPARISONS OF MLA AND FFR BETWEEN cCTA AND OCT ACCORDING TO THE SEVERITY OF CALCIFICATION
AS distribution is shown in Supplementary Figure 3. There was no significant difference between the average cCTA and OCT MLAs in lesions with both low-intermediate and high AS (Table 3). The average absolute difference of MLA between cCTA and OCT measurements was comparable in lesions with both low-intermediate and high AS (0.609±0.587 mm2 vs. 0.681±0.570 mm2; p=0.422, respectively). There was a significant positive correlation between cCTA and OCT MLAs in lesions with low-intermediate AS (r=0.873, p<0.0001) (Figure 5A.a) and high AS (r=0.787, p<0.0001) (Figure 5B.a). There was no significant difference in the strength of correlation between the two groups (p=0.163). Bland-Altman plots of the cCTA MLA in relation to the OCT MLA showed a mean bias of –0.047±1.604 for lesions with low-intermediate AS and of 0.039±1.740 for lesions with high AS (Figure 5A.b, Figure 5B.b). No significant difference was observed in variation between the two groups (F=0.268, p=0.606).
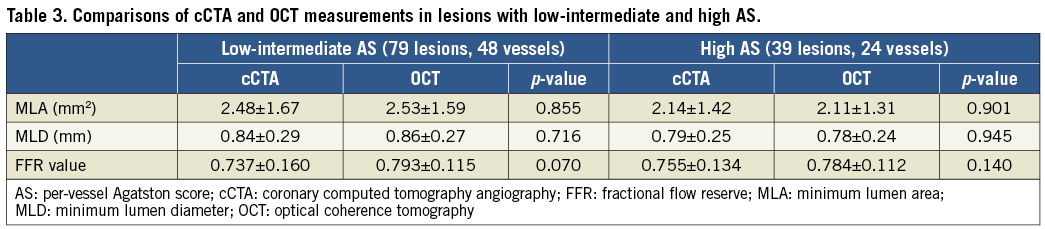
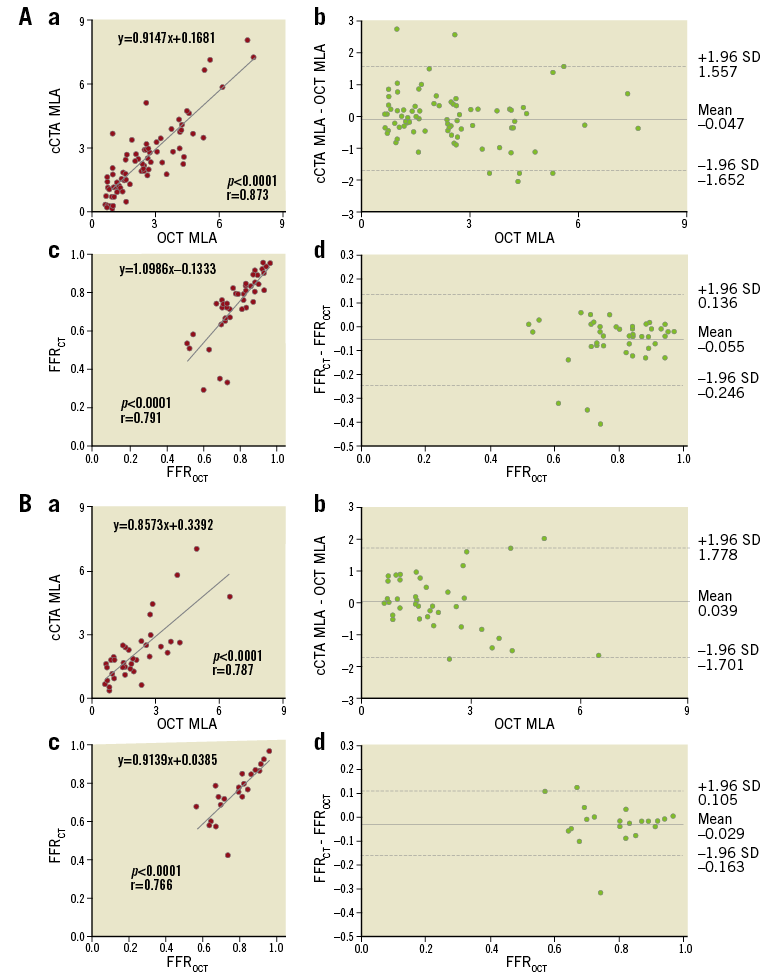
Figure 5. cCTA vs. OCT measurement. A) Lesions with low-intermediate AS and B) lesions with severe AS. a) Correlation between MLA from cCTA and OCT; b) Bland-Altman plots of cCTA MLA vs. OCT MLA; c) correlation between FFR from cCTA and OCT; d) Bland-Altman plots of FFRCT versus FFROCT.
There was no significant difference between the mean FFRCT and FFROCT values in vessels with low-intermediate and high AS (Table 3). There were strong correlations between FFRCT and FFROCT in vessels with low-intermediate (r=0.791, p<0.0001) (Figure 5A.c) and high AS (r=0.766, p<0.0001) (Figure 5B.c), and no significant difference in the strength of correlation between the two groups (p=0.823). Bland-Altman plots of FFRCT in relation to FFROCT showed mean biases of –0.055±0.191 and 0.058±0.134 for vessels with low-intermediate and high AS, respectively (Figure 5A.d, Figure 5B.d). There was no significant difference in variation between the two groups (F=1.061, p=0.307).
CONCORDANCE RATE OF DETECTING ISCHAEMIA BETWEEN FFRCT AND FFROCT
The overall concordance rate between FFRCT and FFROCT was 82.8% (Supplementary Figure 4). Representative concordant and discordant cases are shown in Supplementary Figure 5-Supplementary Figure 7.
Discussion
IMPACT OF IMAGE QUALITY ON GEOMETRIC ACCURACY
The pressure loss along the coronary artery is affected by the coronary artery anatomy and blood flow. Among various geometric features of coronary lesions, MLA and lesion length are two of the most critical parameters affecting coronary flow and pressure. Thus, accurate computation of FFR by cCTA necessitates an accurate representation of coronary lumen geometry. A recent substudy of the DeFACTO trial demonstrated the importance of administering beta-blocker and adequate nitrate dosage recommended by SCCT guidelines to ensure high image quality5. Specifically, cases with appropriate imaging protocol exhibited improved specificity of FFRCT (66.0% vs. 51.0%; p=0.03) and significantly lower bias (–0.048 vs. –0.084; p=0.008)11. Additionally, cases without misaligned artefacts demonstrated improved sensitivity (86.0% vs. 43.0%; p=0.001) and overall diagnostic accuracy (71.0% vs. 56.0%; p=0.03). These data suggest the importance of image quality, which can potentially impact on the creation of accurate patient-specific geometric models, leading to accurate FFR computation by cCTA.
In the present study, a high agreement between cCTA- and OCT-based MLA measurements was observed over a broad spectrum of cCTA image qualities measured by SNR (6.7-41.3), CNR (12.8-73.7), and five-point Likert scale (2-5). Johnson et al stated that limits in the spatial resolution of cCTA could introduce large errors in stenosis diameter and even greater errors in stenosis resistance, pressure drop, and calculated FFRCT based on a simple idealised coronary resistance model approximated from the MLD of the vessel4. In the present study, however, the average absolute difference of effective MLD between cCTA and OCT measurements was 0.239±0.200 mm, which is much smaller than the typical image resolution of cCTA (e.g., 0.6 mm). Furthermore, instead of amplified errors, a strong correlation (r=0.778) was observed between FFRCT and FFROCT with only a small difference between the average FFRCT and FFROCT in the overall population. In lesions with MLD above the catheter size (MLD ≥1.0 mm), an excellent correlation (r=0.918) was observed with no difference in the average values.
Possible explanations for the smaller MLA errors observed in the present study other than the typical cCTA image resolution are as follows. First, the impact of image resolution on MLA estimation can be reduced because cCTA produces greyscale – not binary (black and white) – images. Second, in greyscale images, it would be extremely unlikely to underestimate or overestimate the lumen size with one pixel consistently over the entire circumference of the cross-sectional lumen boundary. Third, image processing algorithms can utilise prior information on the shape of the vessel in all three-dimensional directions, which can be augmented with image intensity information in the lumen extraction process. Therefore, despite the limited resolution of inherent cCTA data, sub-pixel (or sub-voxel) resolution can be attained with computer-automated image segmentation methods.
POTENTIAL ISSUES WITH COMPARING cCTA-DERIVED MLA AND FFRCT WITH OCT MEASUREMENTS IN TIGHT LESIONS
In lesions larger than the catheter size (MLD ≥1.0 mm), a strong positive correlation was observed between cCTA and OCT MLAs. However, in lesions smaller than the catheter size (MLD <1.0 mm), a weak correlation was observed. One possible explanation could be the inaccurate lumen quantification by OCT in lesions with MLD <1.0 mm. The diameter of the OCT imaging catheter was approximately 0.9 mm 9; therefore, when evaluated by OCT, lumen dimensions can become enlarged or reduced, especially in tight lesions. Another possibility is that lumen measurement by cCTA is inaccurate in lesions with severe stenosis. In vitro validation of cCTA showed that cCTA underestimated the lumen size in lesions with MLD <1.0 mm12. Although both studies used the same cut-off value of 1.0 mm for subgroup analyses, the motivation of using 1.0 mm MLD as the cut-off value to divide data was different. We chose 1.0 mm based on the invasive catheter size to collect reliable OCT MLA measurements (Supplementary Figure 1). Moreover, there exist fundamental differences in methods between the two studies, including imaging objects (phantom vs. patient), physiologic conditions (steady vs. pulsatile), plaques (none vs. present), imaging artefacts (none vs. present), and segmentation algorithm. Although it is possible that the spatial resolution of cCTA affected the underestimation of the lumen size in lesions with MLD <1.0 mm, we think that the lumen accuracy for lesions with MLD <1.0 mm is not evaluable using OCT because of the size of the invasive catheter. However, the concordance of FFRCT with FFROCT was not degraded in lesions with MLD <1.0 mm (overall: 82.8%, lesions with MLD <1.0 mm: 90.5%). Among lesions with MLD <1.0 mm, only one case showed a negative FFRCT but positive FFROCT result. Even in this case, the discordant diagnosis appeared to be due to the error in OCT measurements caused by the accordion phenomenon (Supplementary Figure 5). Although the accuracy of cCTA MLA for lesions with MLD <1.0 mm could not be evaluated in the present study, these results suggest that FFRCT may provide high diagnostic performance even in vessels with MLD <1.0 mm since the lesion is extremely tight.
POTENTIAL IMPACT OF CORONARY ARTERY CALCIFICATION ON FFRCT
Several studies have shown that coronary calcification is associated with lower cCTA specificity13,14. However, Nørgaard et al showed that FFRCT provides superior diagnostic performance over cCTA alone, even in patients with a high AS (per vessel AS range: 121 to 1,703)15. In addition, even at the site of metallic markers of a bioresorbable scaffold, Collet et al reported the adequate accuracy of cCTA to assess the luminal dimension by including the centre of the marker in the luminal area16. In the present study, even in the highest AS tertile, there was an excellent correlation between FFR simulation by cCTA and OCT, especially in vessels with MLD ≥1.0 mm (Supplementary Table 6, Supplementary Table 7, Supplementary Figure 8). Vessels in the highest AS tertile accounted for only 27.3% of those with a discordant diagnosis. This result suggests that the severity of calcification was not the critical factor affecting the diagnostic accuracy of FFRCT. In vessels with MLD ≥1.0 mm, the correlation coefficient of FFR value between cCTA and OCT was higher than that of MLA in vessels with a high AS (Supplementary Figure 8). This result suggests that FFRCT might be less influenced by coronary calcification in lumen quantification by cCTA. Moreover, the correlation between FFRCT and FFROCT was higher than that of the MLAs. This phenomenon can be explained by the fact that pressure drop across lesions is determined by total resistance of the lesion integrated over the entire segment of the vessel, rather than a single cross-section.
Study limitations
Several limitations should be noted. First, this study was a non-randomised and retrospective study with a relatively limited sample size. Second, nitroglycerine protocols were not consistent for image acquisitions during cCTA, ICA, and OCT. The difference in nitroglycerine protocol could affect the dimensions of the coronary lumen and potentially influence the comparison results. Third, invasive FFR was not performed. Instead, FFROCT was used to evaluate the direct impact of geometric accuracy on the computation of FFR resulting from the difference in cCTA and OCT models including resolution and artefacts. Finally, MLAs by OCT and cCTA can originate from different sites. The approach we chose, however, was not based on the exact slice-by-slice comparison. Instead, we defined the lesion of interest using side branches as landmarks to co-register lesions and compared detected minimum areas for the segment. The rationale behind this approach is based on the fact that pressure drop over the lesion is unlikely to be affected by the misaligned MLA locations with a couple of millimetres, but rather the critical parameter is the discrepancy of MLA over the same segment.
Conclusions
The spatial resolution of cCTA does not practically limit the accuracy of lumen boundary identification or affect FFRCT. Small lumen diameters, such as those less than 1.0 mm, result in greater discordance between cCTA and OCT MLA values. However, this discordance may be due to the limitation of using the invasive OCT catheter and, nonetheless, has a limited impact on FFRCT diagnostic accuracy. In addition, lumen quantification by cCTA showed high accuracy as compared to OCT data over a wide range of coronary calcification scores. Finally, if the image quality is adequate to calculate FFRCT, the image quality does not significantly influence the accuracy of the lumen measurements.
| Impact on daily practice cCTA lumen detection is reliable for FFRCT computations even in severely calcified lesions provided the image quality is acceptable. |
Conflict of interest statement
H. Otake and T. Shinke serve as consultants to Abbott Vascular. H. Otake has received honoraria from HeartFlow, Inc. G. Choi, H.J. Kim, M. Schaap, L. Grady, C. Taylor, and A. Roy are employees and/or shareholders of HeartFlow, Inc. The other authors have no conflicts of interest to declare.
Supplementary data
Supplementary Appendix 1. Study population.
Supplementary Appendix 2. CT acquisition protocol.
Supplementary Appendix 3. CT acquisition parameters.
Supplementary Appendix 4. Objective image quality analysis.
Supplementary Appendix 5. Sample size.
Supplementary Appendix 6. Study endpoints.
Supplementary Appendix 7. Patient flow.
Supplementary Table 1. Comparison of MLA, MLD, and computed FFR values between cCTA and OCT in various kinds of CT scanner.
Supplementary Table 2. Comparison of MLA, MLD, and FFR values between cCTA and OCT in the lesions with low signal-to-noise ratio and intermediate-high signal-to-noise ratio.
Supplementary Table 3. Comparison of MLA, MLD, and FFR values between cCTA and OCT in the lesions with low contrast-to-noise ratio and intermediate-high contrast-to-noise ratio.
Supplementary Table 4. Comparison of MLA, MLD, and FFR values between cCTA and OCT in the lesions with image quality scale 2, 3 and image quality scale 4, 5.
Supplementary Table 5. Passing and Bablok regression analysis.
Supplementary Table 6. Comparison of MLA, MLD, and FFR values between cCTA and OCT in the lesions with a combination of MLD ≥1.0 mm/low-intermediate and high AS.
Supplementary Table 7. Comparison of MLA, MLD, and FFR values between cCTA and OCT in the lesions with a combination of MLD <1.0 mm/low-intermediate and high AS.
Supplementary Figure 1. The size of OCT catheter and guidewire.
Supplementary Figure 2. Impact of image quality on the relation between cCTA MLA and OCT MLA.
Supplementary Figure 3. Distribution of AS.
Supplementary Figure 4. Concordance rate for diagnosis of ischaemia between FFRCT and FFROCT.
Supplementary Figure 5. A case with discordant diagnosis between FFRCT and FFROCT.
Supplementary Figure 6. Cases with concordance between FFRCT and FFROCT.
Supplementary Figure 7. Cases with discordance between FFRCT and FFROCT.
Supplementary Figure 8. cCTA vs. OCT measurement.
To read the full content of this article, please download the PDF.