
Abstract
Aims: The aim of this study was to evaluate the diagnostic performance of OCT-based optical flow ratio (OFR) in unselected patients and compare it with angiography-based quantitative flow ratio (QFR), using wire-based FFR as reference standard.
Methods and results: All patients with OCT and FFR assessment prior to revascularisation were analysed. OFR and QFR were computed in a blinded fashion and compared with FFR, applying the same cut-off value of ≤0.80 to all to define ischaemia. Paired comparison between OFR and QFR was performed in 212 vessels from 181 patients. Average FFR was 0.82±0.10 and 40.1% of vessels had an FFR ≤0.80. OFR showed a significantly better correlation and agreement with FFR than QFR (r=0.87 versus 0.77, p<0.001; SD of the difference=0.05 versus 0.07, p<0.001). The AUC was 0.97 for OFR, higher than for QFR (difference=0.05, p=0.017), and much higher than the minimal lumen area (difference=0.15, p<0.001) and diameter stenosis (difference=0.17, p<0.001). Diagnostic accuracy, sensitivity, specificity, positive predictive value, negative predictive value, positive likelihood ratio, and negative likelihood ratio for OFR to identify FFR ≤0.80 were 92%, 86%, 95%, 92%, 91%, 18.2 and 0.2, respectively. The diagnostic accuracy of OFR was not significantly different in MI-related vessels (95% versus 90%, p=0.456), or in vessels with and without previously implanted stents (90% versus 93%, p=0.669).
Conclusions: OFR had an excellent agreement with FFR in consecutive patients with coronary artery disease. OFR was superior to QFR, and much better than conventional morphological parameters in determining physiological significance of coronary stenosis. The diagnostic performance of OFR was not influenced by the presence of prior myocardial infarction or implanted stents.
Introduction
Intracoronary optical coherence tomography (OCT) imaging provides superior image resolution in vivo, allowing detailed assessment of coronary lumen, plaque morphology and stent expansion and apposition1, while fractional flow reserve (FFR) is the standard of reference to evaluate the functional significance of coronary stenosis2. An OCT-based morpho-functional evaluation method based on a single catheter could save procedure time and costs, whilst being instrumental in overcoming the reimbursement constraints that are preventing the widespread use of both imaging and physiology for PCI guidance. Recently, a novel and fast OCT-based FFR computational method, hereafter called optical flow ratio (OFR), was developed, allowing assessment of both plaque morphology and coronary physiology using a single OCT image catheter and without the need to induce hyperaemia3. However, the diagnostic accuracy of OFR analysis in unselected consecutive patients remains to be proven. In addition, the diagnostic performance of OFR compared with angiography-based quantitative flow ratio (QFR)4,5 has not been evaluated.
Methods
STUDY DESIGN AND PATIENT POPULATION
This was a retrospective single-centre, observational study. The primary outcome measure was the diagnostic accuracy of OFR compared with QFR in determining functionally significant stenosis. All patients who underwent both OCT imaging and FFR assessment between August 2011 and October 2018 at Wakayama Medical University Hospital (Wakayama, Japan) were enrolled. Vessels were excluded from OFR analysis if balloon predilatation was performed prior to OCT imaging. OFR was computed in all OCT image pullbacks unless the OCT image quality precluded visualisation of the coronary lumen or there was severe image artefact. OFR analysis results were excluded from comparison with FFR if: 1) vessel spasm or injury during OCT imaging was present; 2) OCT pullback did not cover the entire lesion; 3) there was a myocardial bridge in the interrogated vessels; 4) substantial thrombosis was identified by OCT; or 5) the quality of the FFR pressure tracings was unacceptable, including calibration, quality of the signals and hyperaemic response. A myocardial bridge was noted if the difference of %DS was higher than 20% between the systolic and diastolic phases by visual estimation from coronary angiography.
The angiographic images of those patients with paired OFR and FFR were subsequently used for QFR analysis. Exclusion criteria for QFR analysis included: 1) severe overlap at the interrogated vessels; 2) insufficient image quality for Thrombolysis In Myocardial Infarction (TIMI) frame count; 3) angiographic views ≤25 degrees; 4) severely tortuous vessels; and 5) automatic calibration was not possible due to missing DICOM parameters.
The study complied with the Declaration of Helsinki. The study protocol was approved by the institutional review board. All patients provided written informed consent.
CORONARY ANGIOGRAPHY, FFR, OCT
Details of FFR measurement and acquisition of angiographic images and OCT images are described in Supplementary Appendix 1-Supplementary Appendix 4.
OFR AND QFR ANALYSIS
All angiographic images and OCT images were sent to an academic core laboratory (CardHemo, Med-X Research Institute, Shanghai Jiao Tong University, China) for OFR and QFR analysis, using OctPlus software (version 1.0) and the AngioPlus system (both Pulse Medical Imaging Technology, Shanghai, China). OFR was analysed by two experienced analysts (J. Huang and D. Ding) who were blinded to the QFR and FFR data. QFR was analysed by another analyst (P. Huang) who was also blinded to the OFR and FFR data. The methodologies for OFR and QFR analysis have been described elsewhere3,5. The difference between these two computational approaches is in the boundary conditions used for the fluid dynamics computation. While QFR reconstructs the lumen geometry from two angiographic projections and uses a modified TIMI frame count to estimate the downstream perfused flow, OFR reconstructs the lumen geometry from OCT and uses a patient-average hyperaemic flow velocity in combination with a patient-specific reference lumen, i.e., the healthy lumen of the interrogated patient as if there was no stenosis, to estimate the downstream perfused flow. After computation, the OFR and QFR values at the distal position of the analysed vessel were used for comparison with FFR. For interrogated vessels with two OCT pullbacks to cover the entire lesion, the OFR value was computed for each pullback and combined to generate the final OFR value at the most distal position (Supplementary Figure 1).
Diffuse disease was noted if the percentage of OCT image frames without any plaque in the entire pullback was less than 10%. A tandem lesion was defined as two or more stenoses which were separated by angiographically normal segments.
STATISTICAL ANALYSIS
Continuous variables are reported as mean±SD if normally distributed or as median (quartiles) if non-normally distributed. Categorical variables are expressed as number (percentage). Correlation was evaluated using Pearson correlation or Spearman correlation, as appropriate. Bland-Altman plots and intraclass correlation coefficients (ICC) for the absolute values were used for assessing agreement between different continuous parameters. Comparison of the limits of agreement between OFR and QFR was performed by the F-test. A Wilcoxon signed-rank test or paired t-test was used for pairwise comparison, as appropriate. Diagnostic performance was assessed using the area under the curve (AUC) by receiver operating characteristic (ROC) analysis. The Youden index was used as the criterion to determine the best cut-off value for OCT-derived MLA and 3D QCA-derived %DS in predicting FFR ≤0.80. Statistical assessments were performed with MedCalc version 14.12 (MedCalc Software, Ostend, Belgium). A two-sided p-value of <0.05 was considered to be statistically significant.
Results
BASELINE CLINICAL AND LESION CHARACTERISTICS
Figure 1 shows the study flow chart. A total of 277 consecutive patients undergoing both OCT imaging and pressure-derived FFR measurement were screened. Before the core laboratory analysis, 41 patients were excluded due to the use of balloon predilatation prior to OCT imaging. In the core laboratory, 68 vessels were excluded from OFR analysis, mainly due to OCT image pullbacks not covering the entire lesion (59 vessels). Thus, OFR analysis was performed in 230 vessels from 193 patients. The angiographic images of these patients were used for QFR analysis. Eighteen vessels were excluded from QFR analysis, resulting in 212 vessels with paired QFR and OFR results for head-to-head comparison with FFR and for statistical analysis. Baseline demographic and vessel characteristics (Table 1, Table 2) show that the interrogated vessels had an average FFR of 0.82±0.10 and median FFR of 0.83 (IQR: 0.76 to 0.91). FFR ≤0.80 was identified in 85 (40.1%) vessels. Bifurcation lesions and tandem lesions were present in 97 (45.8%) and 47 (22.2%) vessels, respectively. In the study population, 81 (44.8%) patients had prior myocardial infarction (MI) with 98 vessels being interrogated, and 118 (65.2%) patients had prior PCI, with 90 interrogated vessels having previously implanted stents. A total of 77 (36.3%) vessels had an FFR value falling in the range between 0.75 and 0.85, and 80 (37.7%) vessels had diffuse disease. Figure 2 shows the histogram distribution of FFR and OFR.
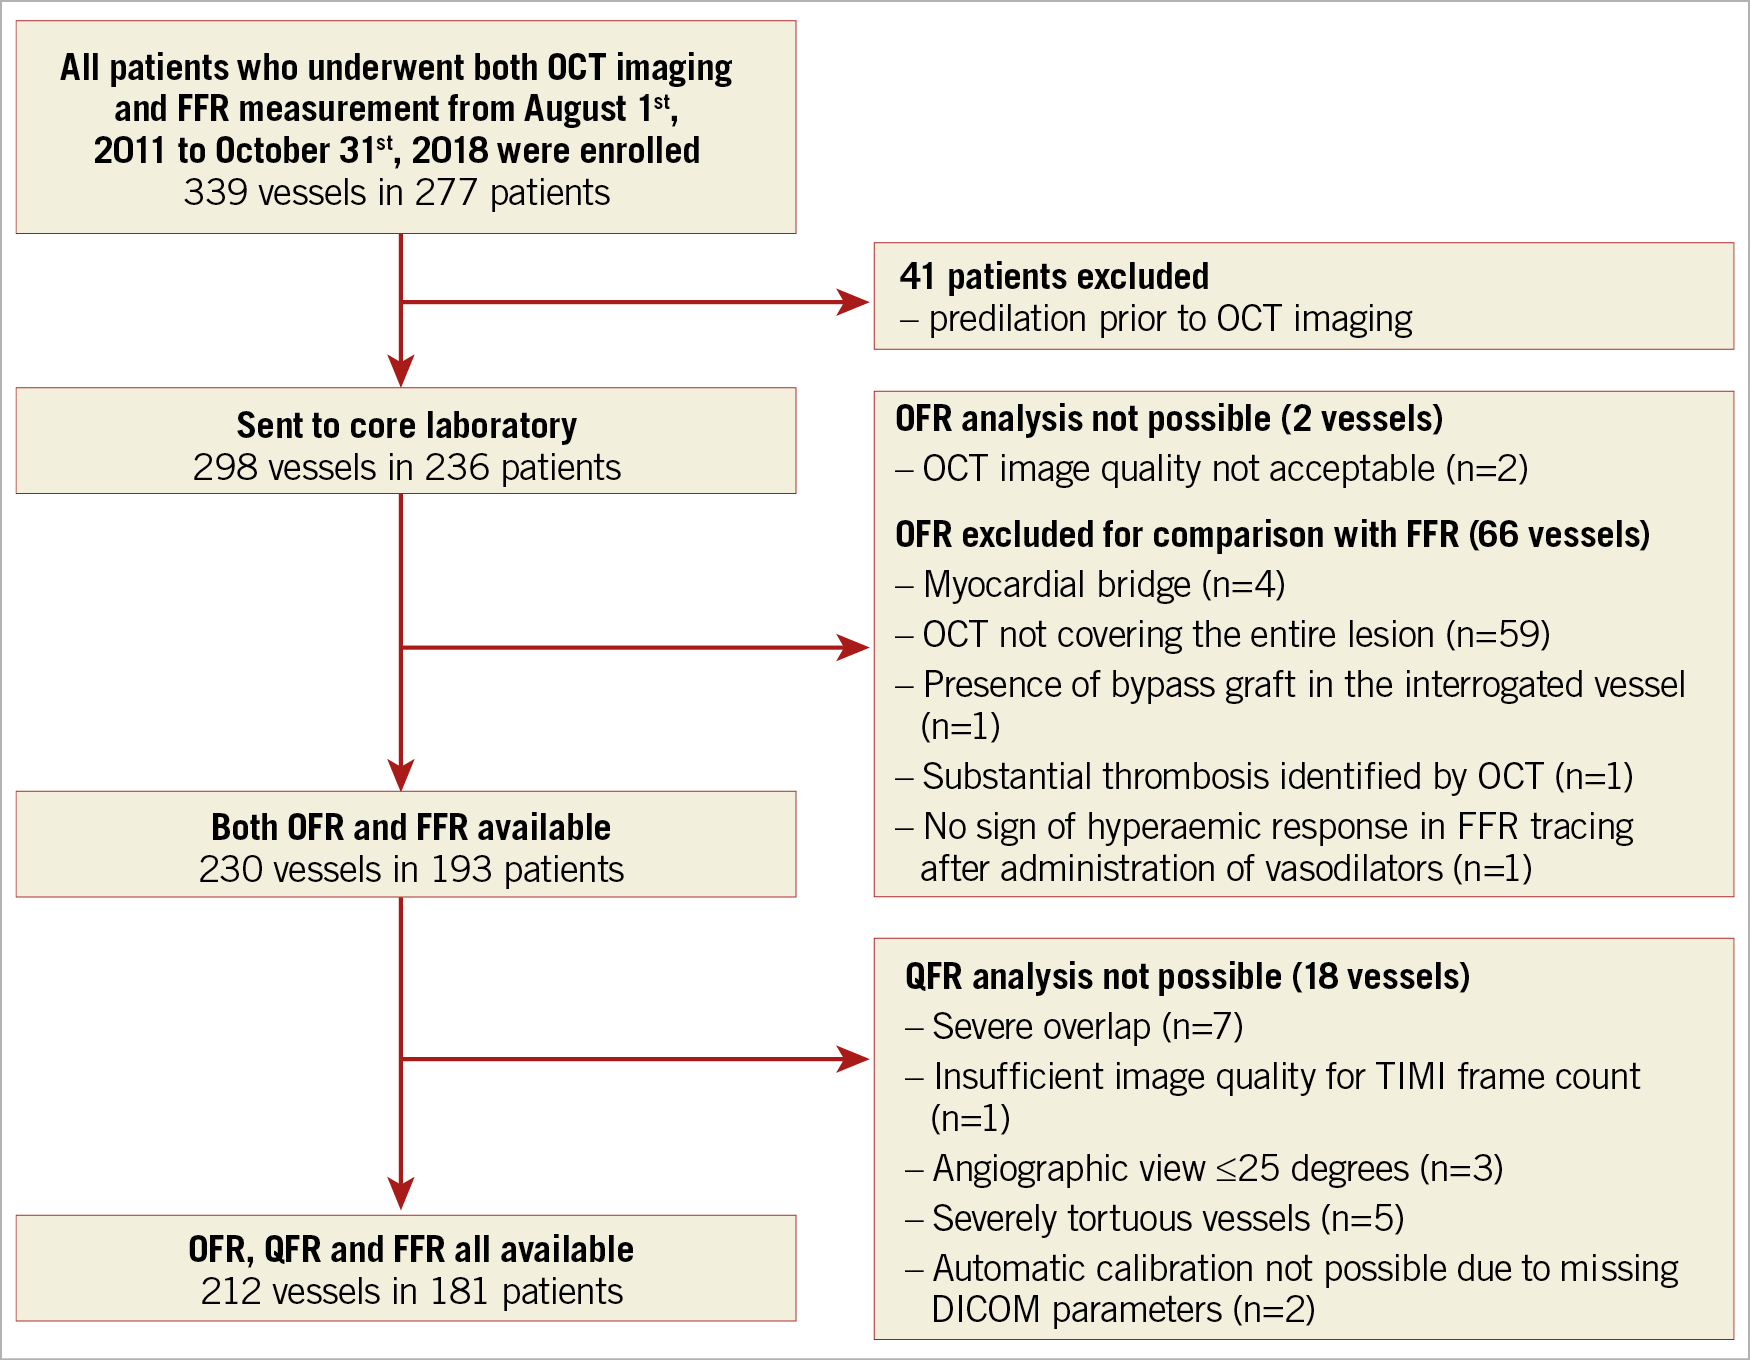
Figure 1. Study flow chart. FFR: fractional flow reserve; OCT: optical coherence tomography; OFR: optical flow ratio; QFR: quantitative flow ratio
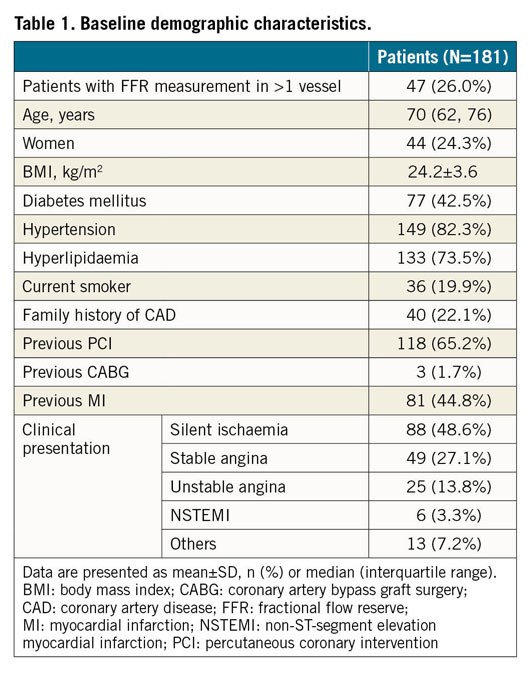
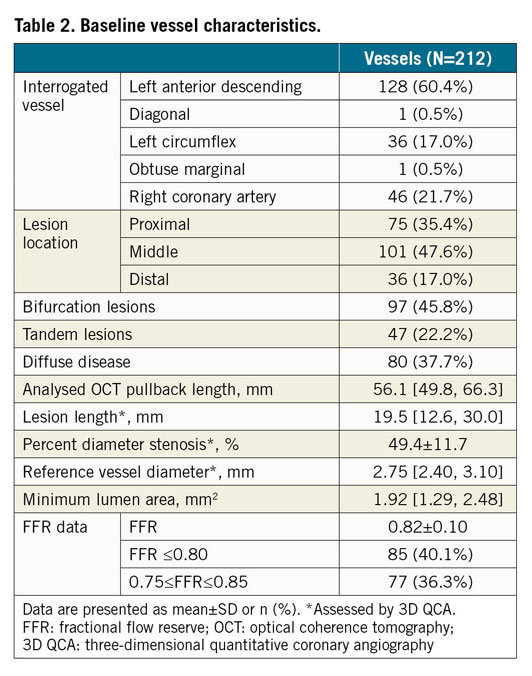
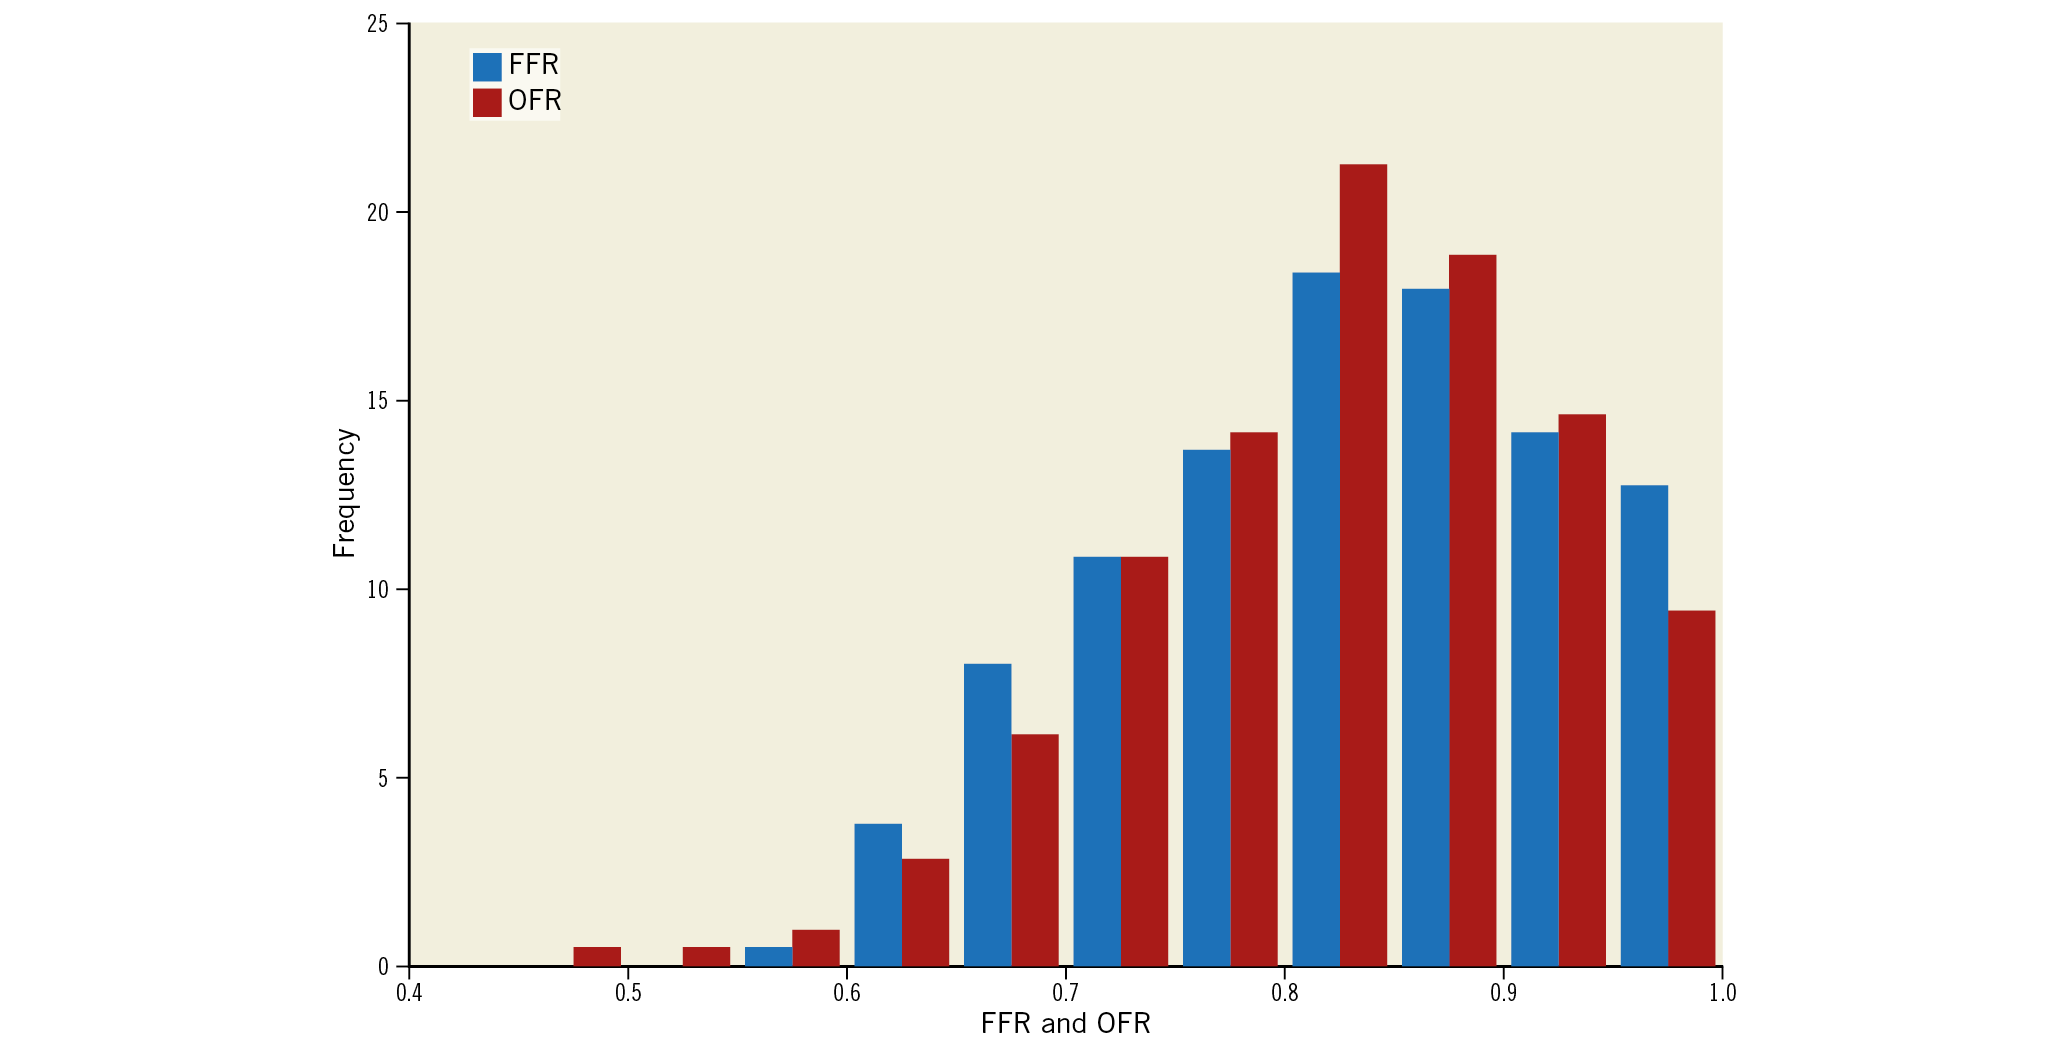
Figure 2. Histogram distribution of FFR and OFR. FFR: fractional flow reserve; OFR: optical flow ratio
CORRELATION AND AGREEMENT
Figure 3 shows a representative case with OFR and QFR computations. Scatter plots and Bland-Altman plots for OFR and QFR in all 212 interrogated vessels (Figure 4) show significantly better correlation and agreement of OFR with FFR than QFR with FFR (r=0.87 versus 0.77, p<0.001; ICC=0.87 [95% CI: 0.83-0.90] versus 0.76 [95% CI: 0.69-0.81], p<0.001). The Bland-Altman plot shows a better limit of agreement with FFR for OFR than for QFR (SD of the difference=0.05 versus 0.07, p<0.001). The improvement was observed mainly in the LAD (Supplementary Table 1).
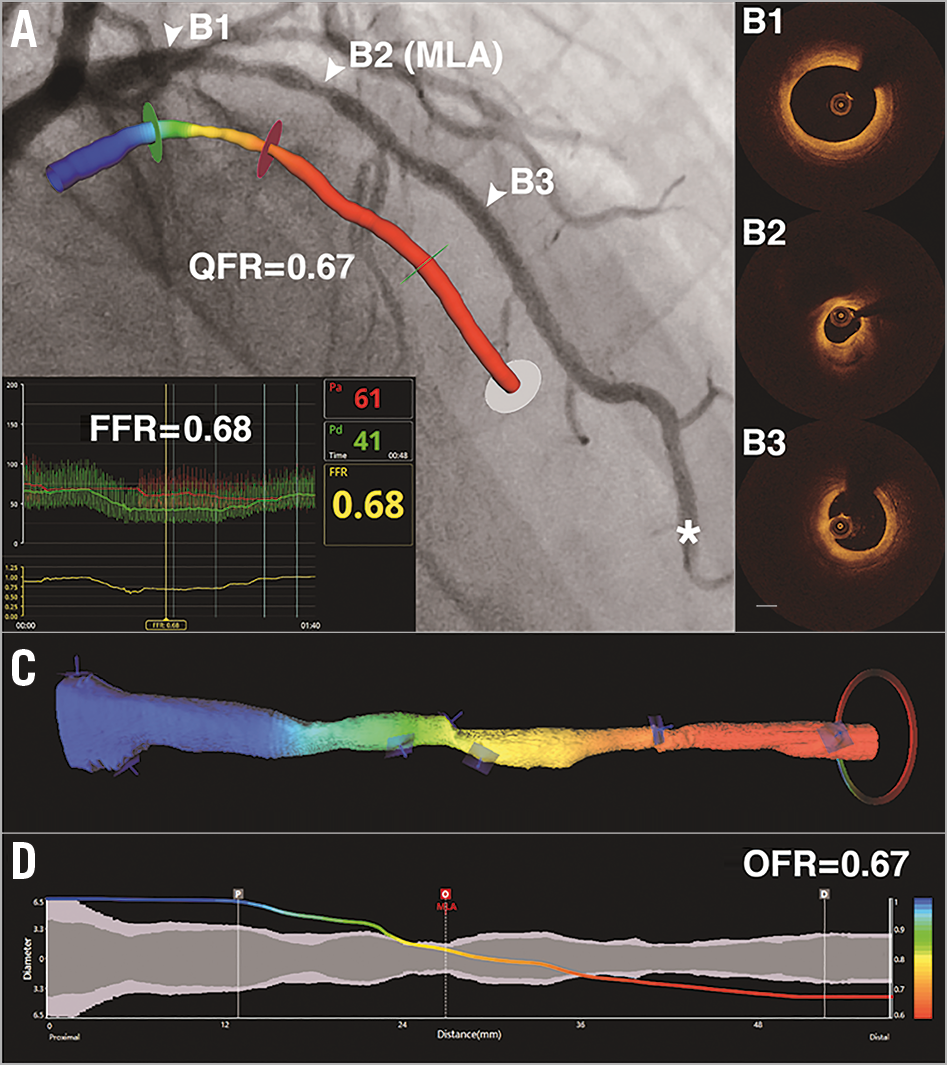
Figure 3. Representative example of morpho-functional and morphological methods in identifying the physiological significance of coronary stenosis. A) Coronary angiography shows an intermediate LAD lesion. FFR measured by pressure wire at asterisk was 0.68. The computed QFR value is colour-coded and superimposed on the 3D angiographic reconstruction. QFR is 0.67 at the most distal position. Panels B1 to B3 correspond to the three positions (white triangles) in panel A. C) The computed OFR values are colour-coded and superimposed on the 3D OCT reconstruction. OFR is 0.67 at the most distal position. D) Co-registration between OFR pullback and lumen diameters (short diameter in dark grey and long diameter in light grey) for the reconstructed vessel. FFR: fractional flow reserve; LAD: left anterior descending artery; MLA: minimal lumen area; OCT: optical coherence tomography; OFR: optical flow ratio; QFR: quantitative flow ratio; 3D: three-dimensional
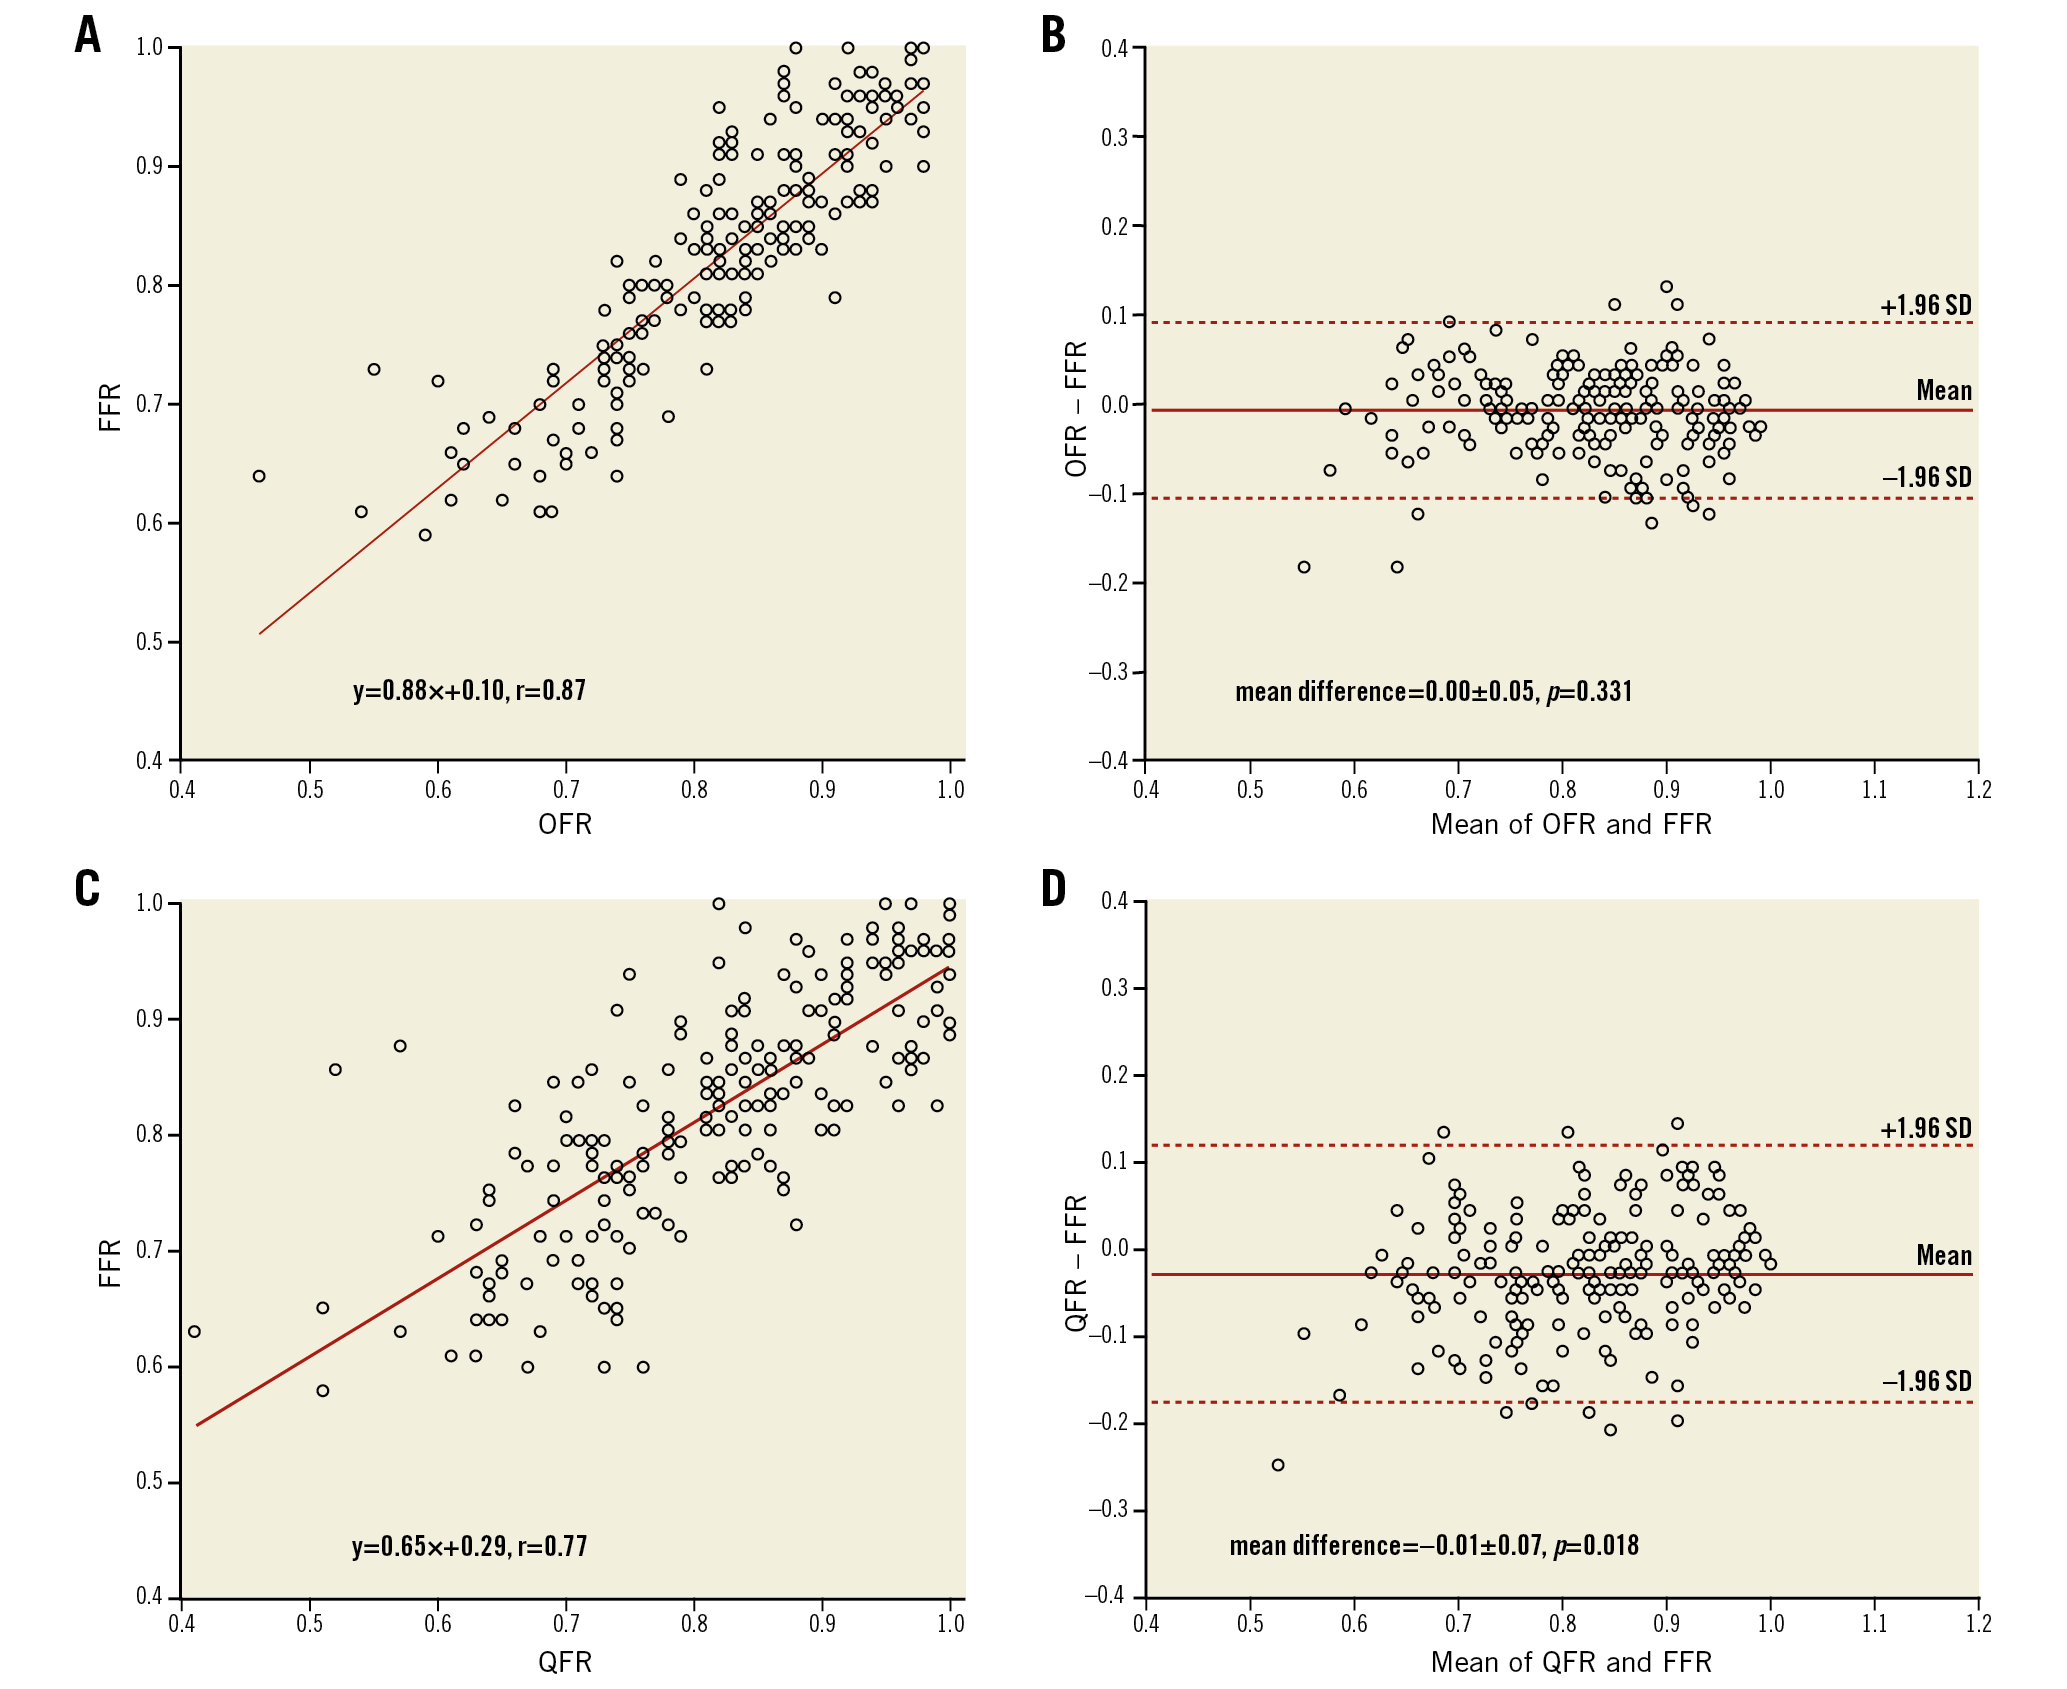
Figure 4. Correlation and agreement for computational FFR and wire-based FFR. A) Correlation between OFR and FFR. B) Agreement between OFR and FFR. C) Correlation between QFR and FFR. D) Agreement between QFR and FFR. FFR: fractional flow reserve; OFR: optical flow ratio; QFR: quantitative flow ratio; SD: standard deviation
DIAGNOSTIC PERFORMANCE OF OFR, QFR, OCT AND 3D QCA
The AUC in identifying physiologically significant stenosis was 0.97 (95% CI: 0.93-0.99) for OFR, which was higher than for QFR (difference=0.05, p=0.017), and much higher than OCT-derived MLA (difference=0.15, p<0.001) and 3D QCA-based %DS (difference=0.17, p<0.001) (Figure 5). Using the same cut-off value of ≤0.80 to define a physiologically significant lesion for OFR, QFR, and FFR, the diagnostic concordance between OFR and FFR was also numerically higher than the concordance between QFR and FFR (92% [95% CI: 88%-95%] versus 87% [95% CI: 83%-92%]), though statistically non-significant (p=0.207). The improvement was observed in vessels with an FFR of between 0.80 and 0.90 (Supplementary Figure 2). Sensitivity, specificity, positive predictive value, negative predictive value, positive likelihood ratio and negative likelihood ratio for OFR were 86%, 95%, 92%, 91%, 18.2 and 0.2, and for QFR were 88%, 87%, 82%, 92%, 7.0 and 0.1, respectively (Table 3, Figure 6). The diagnostic accuracy of OFR was not influenced by the presence of diffuse disease (92% versus 91%, p=0.997). The optimal cut-off value of OCT-derived MLA in predicting FFR ≤0.80 was found to be 1.88 mm2.
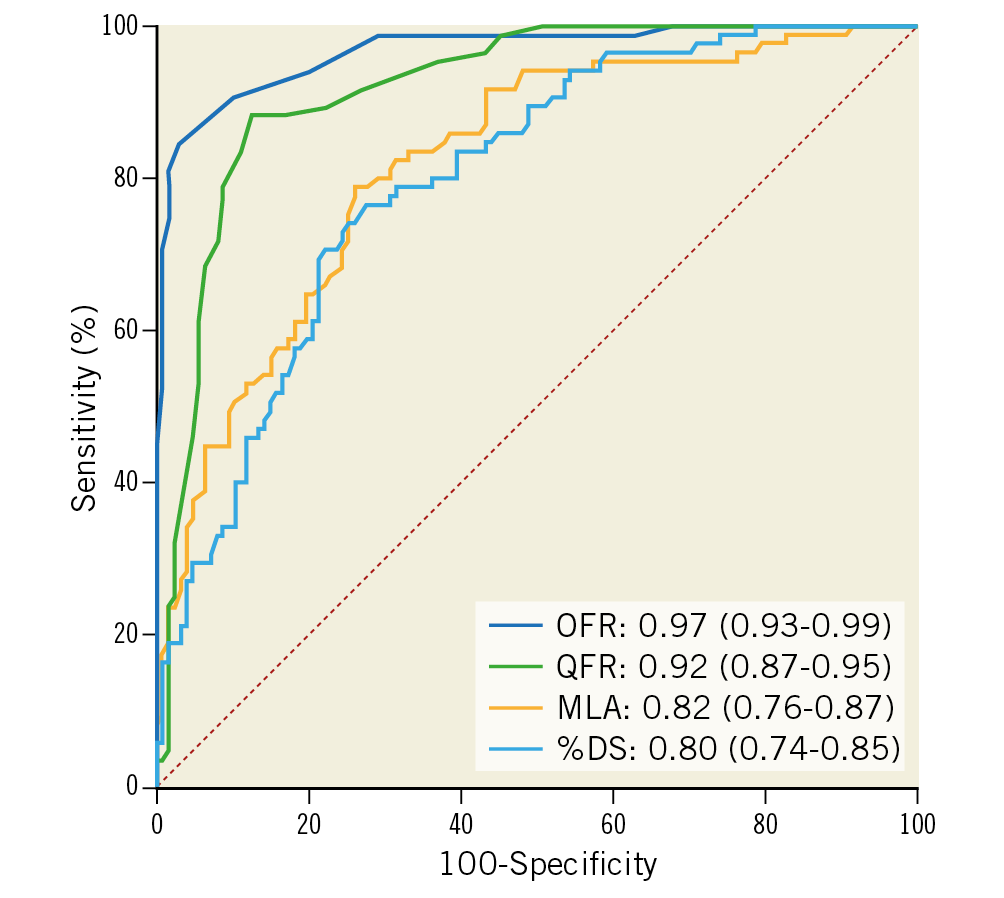
Figure 5. Comparison of diagnostic performance for OFR, QFR, OCT, and 3D QCA. OFR showed significantly higher diagnostic accuracy than QFR, OCT-derived MLA, and 3D QCA-based %DS in identifying flow-limiting coronary stenosis defined by FFR ≤0.80. 3D: three-dimensional; %DS: percent diameter stenosis; MLA: minimal lumen area; OCT: optical coherence tomography; OFR: optical flow ratio; QCA: quantitative coronary angiography; QFR: quantitative flow ratio
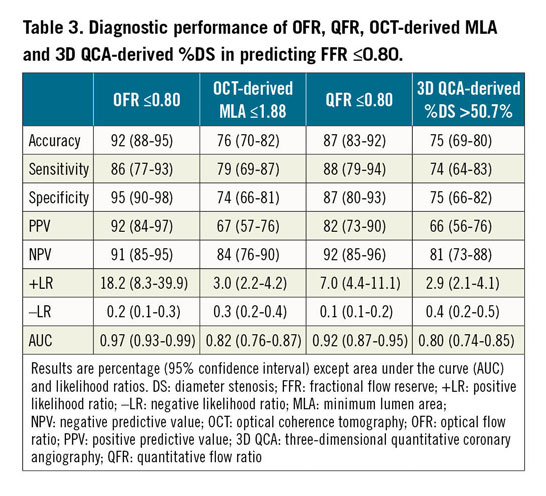
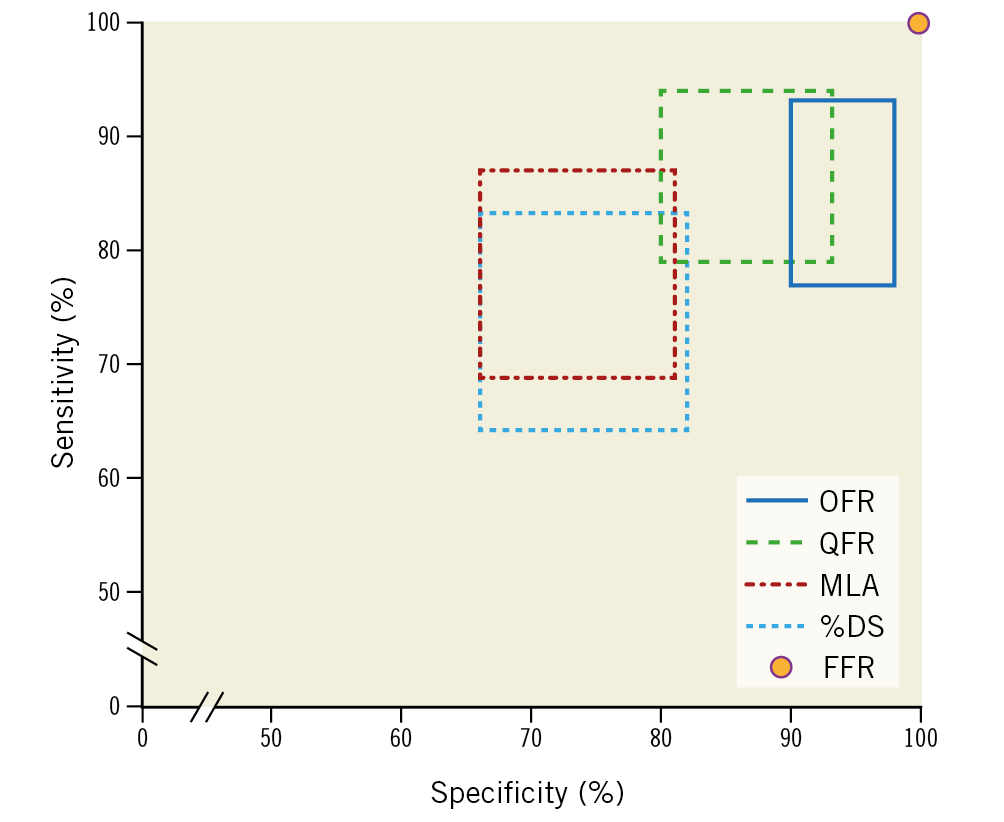
Figure 6. Sensitivity and specificity of morpho-functional and morphological methods in identifying the physiological significance of coronary stenosis. Sensitivity and specificity of OFR, QFR, OCT and 3D QCA: each rectangle in the panel represents the 95% CI of sensitivity and specificity for each method. Wire-based FFR was used as the standard of reference with 100% specificity and sensitivity. 3D: three-dimensional; %DS: percent diameter stenosis; FFR: fractional flow reserve; MLA: minimal lumen area; OCT: optical coherence tomography; OFR: optical flow ratio; QCA: quantitative coronary angiography; QFR: quantitative flow ratio
IMPACT OF PRIOR MI ON COMPUTATIONAL FFR
A total of 57 interrogated vessels were related to prior MI. Mean FFR of this group was 0.86±0.10, compared with 0.81±0.10 in the non-MI group. The diagnostic accuracy of OFR was not inferior in the MI group (95% [95% CI: 89%-100%] versus 90% [95% CI: 86%-95%], p=0.456). However, the ICC was numerically lower in the MI group, though statistically non-significant (0.80 [95% CI: 0.69-0.88] versus 0.88 [95% CI: 0.84-0.91], p=0.094). Similar results were observed for QFR, with a comparable diagnostic accuracy and a numerically lower but statistically non-significant ICC in the MI group compared with the non-MI group (accuracy: 86% versus 88%, p=0.911; ICC: 0.69 versus 0.77, p=0.231). The diagnostic accuracy was better for OFR than for QFR in both groups, though statistically non-significant (MI group: 95% versus 88%, p=0.204; non-MI group: 90% versus 88%, p=0.586). The same applied to the ICC with FFR (MI group: 0.80 versus 0.69, p=0.178; non-MI group: 0.88 versus 0.77, p=0.004).
IMPACT OF PRIOR PCI ON COMPUTATIONAL FFR
Mean FFR was 0.85±0.10 and 0.80±0.10 in vessels with and without previously implanted stents, respectively. The diagnostic performance of OFR was comparable in vessels with in-stent restenosis (ISR) and in native vessels (AUC=0.96 versus 0.97, p=0.608). However, there was a trend towards lower diagnostic performance of QFR in vessels with ISR compared with that in native vessels (AUC=0.88 versus 0.95, p=0.102). The agreement with FFR was better for OFR than for QFR in both groups with (ICC=0.84 versus 0.71, p=0.005) and without previously implanted stents (ICC=0.86 versus 0.77, p<0.001).
Discussion
The following points summarise the key findings of the present study. 1) OFR has an excellent agreement with FFR in consecutive patients with an a priori high likelihood of PCI. The agreement with FFR was significantly better for OFR than for QFR. 2) OFR is superior to QFR, and much better than conventional morphological parameters in diagnosing the physiological significance of coronary stenosis. The diagnostic superiority of OFR over QFR remains regardless of the presence of prior PCI or MI. 3) The diagnostic performance of OFR is not significantly different in patients with or without prior MI, or in native vessels and in vessels with ISR.
This is the first study comparing the diagnostic performance of two novel morpho-functional methods, i.e., OFR and QFR, and two conventional morphological methods, i.e., OCT-derived MLA and 3D QCA-derived %DS, with diagnostic concordance with FFR being 92%, 87%, 76%, and 75%, respectively. Our findings are in line with previous studies showing that purely anatomical parameters have limited diagnostic accuracy6. It might be too simplistic just to measure the area or diameter stenosis in a single cross-section, disregarding many other morphologic parameters and the size of the downstream perfusion territory which all play a crucial role in determining the functional significance of a coronary stenosis. On the contrary, OFR or QFR integrates the morphological parameters in all the cross-sections along the reconstructed vessel and the estimated perfused flow, resulting in substantial improvement in the diagnosis of functional significance of a coronary stenosis. Remarkably, the present study found very similar diagnostic accuracy to previous studies that used the same algorithms: OFR and OCT-derived MLA by Yu et al3 where diagnostic concordance with FFR was 90% and 74%, respectively, QFR by Westra et al7 (87%), and 3D QCA-derived %DS by Ding et al (74%)8. This demonstrates the robustness of the study findings. The limit of agreement between FFR and OFR is better in the present study compared with the previous study by Yu et al (SD of the difference between OFR and FFR: 0.05 versus 0.07)3. This can possibly be explained by the different lesion characteristics in these two studies. The previous study enrolled patients with more severe stenoses than the present study, with mean FFR of 0.80 compared with 0.82 in the present study. It was shown that numerical deviation of computational FFR with respect to wire-based FFR increased with lesion severity7,9. Therefore, a narrower limit of agreement between OFR and FFR was found in the present study, when applying the same OFR algorithm.
COMPARISON BETWEEN OFR AND QFR
Both OFR and QFR are based on fluid dynamics equations that calculate the pressure drop over consecutive segments along the reconstructed vessel. The fundamental difference between these two computational approaches is in the reconstructed lumen geometry and the estimated hyperaemic flow. While OCT images provide more accurate lumen geometry than angiographic images, they are static images providing no information on coronary flow. Therefore, a fixed hyperaemic flow velocity of 0.35 m/sec was used for computing OFR. This flow velocity was multiplied by the size of reference coronary artery, i.e., the normal lumen as if there was no stenosis, to obtain patient-specific volumetric flow for the subtended myocardial mass. Seiler et al10 assessed the relation between coronary artery cross-sectional lumen area and regional myocardial mass and observed a linear correlation in patients without coronary artery disease. This implies that the assumption of a fixed hyperaemic flow velocity before developing coronary artery disease is acceptable. Of note, it is crucial to use the reference lumen rather than the actual lumen geometry, since the maximum flow demanded by the subtended myocardial mass will not change as a result of developed epicardial stenosis. Thus, patient-specific maximal flow would have been underestimated if the actual lumen geometry instead of the reference geometry had been used to estimate the flow. In the methodology of OFR computation, areas of the side branch ostia were quantified and used to calculate the step-down reference diameter when crossing coronary bifurcations, potentially contributing to an improvement in estimation of maximum flow. On the other hand, coronary angiography can be used to calculate coronary flow velocity by quantifying the speed of contrast dye in an interrogated vessel during the wash-in phase. The FAVOR Pilot study showed that the accuracy of QFR computation was improved when using the contrast-flow model compared with a fixed-flow model4. The subsequent FAVOR II China study which enrolled a much larger study population confirmed the improvement of diagnostic accuracy in QFR by using the contrast-flow QFR rather than the fixed-flow QFR. However, the improvement was limited (increase in AUC was 0.02, p=0.005)5,11. Thus, the better accuracy by OFR is not unexpected. It appears that the use of better lumen geometry by OFR outweighs the use of contrast-flow by QFR, resulting in a better diagnostic performance by OFR compared with QFR. This is further confirmed by the result of our subgroup analysis: agreement with FFR was significantly better for OFR than for QFR even in patients with prior MI. The finding is clinically relevant since the use of OFR can further improve the accuracy of computational physiological assessment during diagnostic coronary angiography, while OCT also allows assessment of plaque composition and stent expansion/apposition. In addition, OFR can overcome some inherent limitations of angiography-based FFR, i.e., vessel foreshortening and overlap. For those patients with an a priori high likelihood of PCI, OFR can be included in the present clinical routine for functional evaluation of coronary stenosis without extra instrumentation. For patients presenting with acute coronary syndrome, the use of OCT to assess culprit lesions is recommended1. In this case, OFR allows more effective assessment of non-culprit lesions that can contribute to the concept of functionally complete revascularisation. Moreover, for those patients undergoing subsequent PCI, OFR can be used to improve the functional result of PCI. It was recently reported that a significant proportion of patients had suboptimal post-procedure FFR12. Thus, OFR represents a step forward towards precise PCI in compliance with customary reimbursement restrictions. Nevertheless, it should be noted that the current penetration of OCT is still very low in most countries.
COMPUTATIONAL FFR IN VESSELS WITH IN-STENT RESTENOSIS
The present study found that the diagnostic accuracy of QFR is reduced in vessels with ISR compared with that in native vessels, despite being statistically non-significant (AUC=0.88 versus 0.95, p=0.102). For vessels with ISR, QFR correctly classified 82% of the interrogated vessels. This finding is in line with a recent study reporting an 83% diagnostic concordance between QFR and FFR in vessels with ISR13. The decrease in diagnostic accuracy in vessels with ISR can possibly be explained by the geometric modelling of QFR, which assumes an elliptical cross-sectional shape in angiographic reconstruction. For vessels with prior implanted stents, the lumen borders are less smoothed and might not be represented by elliptical cross-sections. In addition, stent malapposition and underexpansion cannot be identified from angiographic images. Thus, the geometric model based on 3D angiographic reconstruction is less accurate, resulting in impaired accuracy in QFR computation. On the other hand, OCT images allow precise quantification of lumen borders and stent struts, improving the accuracy of the geometric model and the subsequent OFR computation. Thus, the diagnostic performance of OFR was excellent in both vessels with ISR and native vessels (AUC=0.96 versus 0.97, p=0.608).
Limitations
This study is limited by its retrospective nature. However, all patients undergoing both OCT and FFR were enrolled. Thus, selection bias was avoided. Although following a standard protocol, quite a number of OCT images failed to cover the distal lesion, resulting in 20% of enrolled vessels being excluded from paired OFR and FFR comparison. Nevertheless, the latest OCT consoles support longer OCT image pullback which might reduce the chance of not covering the entire lesion. Future studies are needed to assess the feasibility of OFR in a prospective fashion. The present study did not find significant difference in diagnostic accuracy in vessels related to prior MI. However, this result needs to be interpreted with caution. Indeed, correlation between OFR and FFR was numerically lower in vessels related to prior MI. Future dedicated studies are therefore warranted. The incremental value of integrating plaque composition in computational FFR has not been investigated and needs to be understood in future studies.
Conclusions
OFR had an excellent agreement with FFR in consecutive patients with coronary artery disease. OFR was superior to QFR, and much better than conventional morphological parameters in determining physiological significance of coronary stenosis. The diagnostic performance of OFR was not influenced by the presence of previously implanted stents.
|
Impact on daily practice OFR provides superior diagnostic accuracy in assessing functionally significant stenosis in addition to other morphological features that can also be assessed simultaneously for better guidance and optimisation of PCI. Moreover, OFR permits the operator to conform to the highest standards currently recommended in PCI, thus complying with the majority of reimbursement policies in developed countries. |
Funding
This work was supported by the Natural Science Foundation of China (grant number 81871460), the National Key Research and Development Program of China (grant number 2016YFC0100500), the Science and Technology Commission of Shanghai Municipality (grant number 18440731700), and by the Program of Shanghai Technology Research Leader.
Conflict of interest statement
S. Tu reports grants from Medis Medical Imaging Systems, grants from Pulse Medical Imaging Technology. The other authors have no conflicts of interest to declare.
Supplementary data
To read the full content of this article, please download the PDF.