Abstract
Aims: The minimum fibrous cap thickness (FCT) is considered a major criterion of coronary plaque vulnerability according to autopsy studies. We aimed to assess the reproducibility in the measurement of the optical coherence tomography (OCT)-detected minimum FCT and the agreement in the classification of thin-cap fibroatheroma (TCFA), by a software-based semi-automatic method compared with the manual method.
Methods and results: A total of 50 frames with fibroatheromas (FA) were randomly selected from the Integrated Biomarker Imaging Study-4 (IBIS-4). Two experienced OCT analysts independently measured the minimum FCT at two different time points, manually and by three different semi-automatic software-based algorithms, based on the assessment of light intensity along the axial scan line. A TCFA was defined as an FA with minimum FCT <65 μm. The inter- and intra-observer reproducibility of the manual measurement of the minimum FCT was moderate with an intra-class correlation coefficient (ICC) of 0.71 and 0.79, respectively. The corresponding ICCs by either one of the three semi-automatic algorithms were 0.99. When categorising FA according to the minimum FCT based on the manual assessment, the inter- and intra-observer agreement was poor (κ=0.23) and moderate (κ=0.50), respectively. In contrast, the semi-automatic assessment showed perfect agreement for both inter- and intra-observer assessments (κ=0.90-1.00 and 1.00, respectively).
Conclusions: While semi-automatic assessment of FCT and TCFA classification was associated with excellent reproducibility and agreement, manual measurements were associated with a moderate reproducibility and agreement in the quantification of FCT and classification of TCFA.
Abbreviations
FA: fibroatheroma
FC: fibrous cap
FCT: fibrous cap thickness
IVUS: intravascular ultrasound
OCT: optical coherence tomography
ROI: region of interest
TCFA: thin-cap fibroatheroma
Introduction
Coronary artery disease is the leading cause of morbidity and mortality worldwide1. Most acute coronary events are the result of ruptured atherosclerotic plaques, with thin-cap fibroatheroma (TCFA) being the foremost precursor lesion2,3. The TCFA is histologically characterised by a large necrotic core, covered by a thin fibrous cap (FC) infiltrated with macrophages2,4. The fibrous cap thickness (FCT) is regarded as one of the major morphological determinants of plaques to rupture; the best cut-off to indicate the threshold of instability remains a matter of debate. The most applied cut-off is the threshold of 65 µm which originates from the initial work of Burke et al, showing that 95% of ruptured FCT in 41 thrombosed plaques from patients dying of acute coronary thrombosis measured <65 µm2. More recently, Narula and colleagues found, in a sample of 295 plaques, that the majority of non-ruptured TCFAs had FCTs in the range 54 to 84 µm, suggesting that 84 µm may be a more appropriate cut-off for intact cap thicknesses5. Either way, accurate identification in vivo of vulnerable lesions before they disrupt may allow optimisation of treatment strategies to prevent subsequent coronary events.
Optical coherence tomography (OCT) is an intravascular light-based technology with a near-histological resolution of 10-20 µm. With a generally high sensitivity and specificity for detecting lipid plaques, OCT is superior to intravascular ultrasound (IVUS) and angioscopy for plaque characterisation and is, at present, the only imaging modality which can quantify the FCT in vivo 6,7. Accordingly, OCT has been applied in a number of studies to examine the relationship between TCFA morphology, FCT, and clinical presentation, overall providing in vivo results that are similar to autopsy data using 65 µm as a cut-off for the FC of TCFA8. In contrast to this, in a recent report, Yonetsu and colleagues found 95% of the analysed FCTs of ruptured plaques by OCT to be <80 µm thick, with a median (IQR) FCT of 80 (67-104) µm for non-ruptured plaques9. This discrepancy in relation to other OCT studies may be due to sample differences; however, in comparison with initial pathology studies, tissue shrinkage by histological processing has been suggested to play a role9,10. In any case, the ultimate threshold for defining a TCFA remains debatable.
The current approach for quantifying FCs by OCT is based on single, manual measurements of the thinnest part of the FC. Analysts manually run through the consecutive cross-sections to identify segments within the arterial wall consistent with fibroatheroma (FA): per definition, the presence of a signal-poor region with diffuse borders (lipid/necrotic core) covered by a signal-rich layer constituting the FC6. The minimum FCT is selected and measured manually as the line extending from the vessel lumen to the inner border of the lipid pool at the point in the cross-section where the FC appears to be thinnest by visual inspection. Although this manual method may seem straightforward, it is to a varying degree subjective and thus prone to inter- and intra-observer variability. In addition to being time-consuming, this method, by which one single point represents an entire region, does not take into account the volumetric character of the FC, thus hindering the comprehensive assessment of FAs to elucidate better the mechanisms of plaque rupture.
With the purpose of extending beyond the single-point, manual FC quantification11, we developed a new, computer-assisted method for semi-automatic assessment of the FCT at the two-dimensional cross-sectional level. The aim of the present study was to validate this method by comparing its variability at the frame level to that provided manually by experienced OCT analysts – more specifically, to assess the intra- and inter-observer variability for the assessment of the minimum FCT and of the clinically meaningful categorisation into TCFA and thick-cap FA (ThCFA).
Methods
STUDY POPULATION
The study included data from the Integrated Biomarker Imaging Study (IBIS-4), which was a prospective IVUS and OCT study nested into the COMFORTABLE-AMI trial (NCT00962416) – the latter comparing the safety and efficacy of biolimus-eluting stents with bare metal stents in patients undergoing primary percutaneous coronary intervention12. Patients were included between September 2009 and January 2011. The IBIS-4 study included a total of 103 patients from four different centres examined with OCT and virtual histology (VH) IVUS in the non-target vessels and treated target vessels, at baseline and 13-month follow-up, to assess prospectively the evolution of atherosclerotic plaques. While the IVUS and VH-IVUS results of this study were recently published13, the OCT analysis of IBIS-4 is ongoing. For the present study, 50 cross-sections containing FAs, from 103 patients, were randomly selected by an analyst experienced in reading OCT images (LR). The selection was based on: i) good image quality, defined as satisfactory blood clearance with visibility of >3 quadrants; and ii) the presence of an FA as defined by the international consensus14, taking into consideration the structures that may mimic these lesions, including fibrocalcific plaques as well as various artefacts, which were excluded11. All patients provided written informed consent, and the IBIS-4 study was approved by the ethics boards of the participating centres.
OCT IMAGE ACQUISITION
OCT images were acquired with the commercially available Fourier-domain C7-XR™ imaging system (St. Jude Medical, St. Paul, MN, USA), using the Dragonfly™ imaging catheter (also St. Jude Medical) which was advanced over a conventional wire distally to the region of interest (ROI). Image acquisition was performed at a frame rate of 504 lines/frame and 100 frames/s, with a pullback speed of 10-20 mm/s, while the vessel was continuously flushed by automatic injection of contrast medium through the guiding catheter.
OCT IMAGE ANALYSIS
Three experienced image analysts were involved in the present evaluation, which was performed off-line using QCU-CMS software (Medis, Leiden, The Netherlands). The preparation analyst (LR) was responsible for selecting the cross-sections, proper calibration of images, and for the definition within each cross-section of the circumferential ROI using two angular lines to delineate the region laterally (Figure 1). The ROI included the presence of an FA as defined by the international consensus14. In case the guidewire shadow was located within the ROI, the shadow area was marked out and excluded from the analysis. The variability of the manual segmentation of the abluminal boundary of the FC by senior observers 1 and 2 (HGG and MDR) was compared with the computer-assisted assessments. In order to optimise the conditions of the manual assessments and allow measurements in a manner resembling available standard on-line computer-assisted approaches as provided by OCT system manufacturers, all (manual and semi-automatic) evaluations started with the semi-automatic segmentation of the luminal contour, with the possibility of manual adjustment at the analysts’ discretion in order to account for minimal imperfections in flush quality. The same luminal contour was then used for all assessments (manual and semi-automatic) as the border where the cap thickness trace ended.
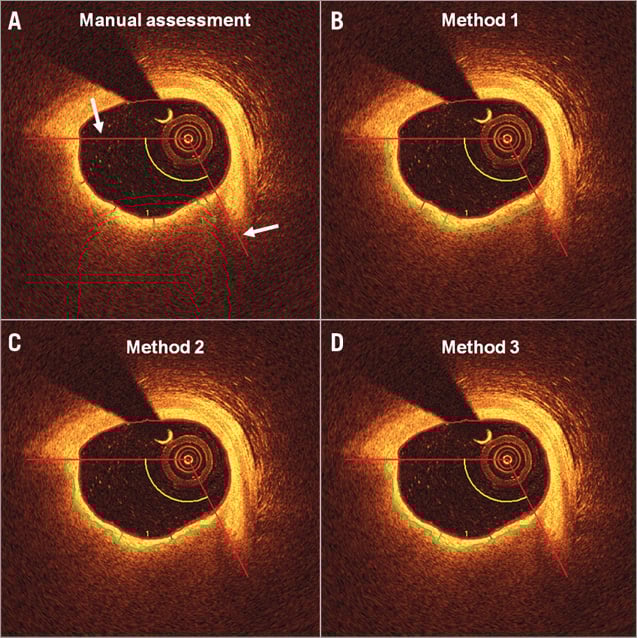
Figure 1. Example of the manual and semi-automatic analysis. The region of interest was delineated laterally by two angular red lines (white arrows). A) - D) show an example of the assessment of FCT by the manual method and by Methods 1-3 of the same fibroatheroma. With the manual method, a green dot was placed at the suggested site of the minimum cap thickness (here denoted as “1”) followed by four additional dots spaced equally along the fibrous cap. Each of these was automatically connected with the lumen contour by the software through the shortest distance to the lumen. By the algorithm assessment (Methods 1-3), the segmented fibrous cap boundary is seen as a continuous green line spanning the two angular lines defining the region laterally. Between this green border and the lumen contour one can see a red line indicating the site of the minimum cap thickness, and the green line indicating that of the maximum cap thickness.
MANUAL ASSESSMENT
This included estimation of the minimum and maximum FCT, and three additional FC measurements spaced approximately equally over the defined ROI in order to derive the mean FCT. Following automatic segmentation of the luminal contour as described above, the FCT was assessed by indicating manually the point of the abluminal boundary between the FC and lipid/necrotic core, after which the software traced the FC to the already defined luminal contour, as described below (Figure 1A).
SEMI-AUTOMATIC ASSESSMENT
The semi-automatic FC segmentation was applied on Cartesian (transversal) OCT images, and the luminal and abluminal boundaries of the FC within the manually defined ROI were extracted automatically as follows:
In both cases (luminal and abluminal), border detection was based on dynamic programming – an effective method to find the optimal global solution for a border when this is based on gradient information: in the present context, changes in light intensity. Since the anatomical interfaces of interest are located at sites along the analysed axial lines displaying strong intensity transitions (for lumen border: transition from dark to bright; for the border between fibrous cap and lipid region: transition from bright to dark), an edge detector using a certain kernel was employed such that the edge strength value was calculated for each pixel. In combination with dynamic programming, the pixels with the best edge values given smoothness constraints based on a priori knowledge were connected laterally in a manner similar to that described by Wang et al and Zahnd et al15,16. An example of the three semi-automatic methods, as described below, is presented in Figure 1B-Figure 1D.
An important feature of an edge detector is its kernel, which describes the response of the algorithm to a certain edge. In the present study, we tested three different kernels for the abluminal border detection to investigate which one best described the border between the FC and the lipidic region, as evaluated by expert analysts. Method 1 uses a kernel which looks mainly at the intensity difference between the FC and lipid region. After calculating the average intensity of the cap and lipid region, the border is defined at the point where the intensity profile crosses the mean of both (Figure 2A). By Method 2, the abluminal border is defined by the point displaying the largest change in intensity (zero crossing the 2nd order), i.e., at the point on the sigmoid curve where the slope steepness reverts (Figure 2B). In contrast, Method 3 uses the largest gradient in pixel intensity (1st derivative) between the cap and the lipid region (i.e., where the slope on the sigmoid curve is steepest) to locate the abluminal border (Figure 2C). To avoid false edge information, the pixels in front of the maximum intensity in the fibrous cap region (i.e., pixels originating from the lumen) were discarded.
After segmentation, the distances between the lumen and abluminal cap borders were determined for all three methods allowing the computation of the minimum, maximum, and mean FCT within the ROI, where the mean FCT was calculated from data points in the luminal contour located at 1 degree intervals, taking the centre of the optical catheter as reference. The semi-automatic aspect of the methods permitted the analysts to adjust the computer-defined luminal contour in case of, e.g., residual luminal blood. The abluminal contour, however, was left unaltered.
For both the manual and semi-automatic analyses, the line from the abluminal FC boundary to the luminal contour was traced by the software along the shortest distance to the lumen – an approach that renders these axial measurements less dependent on the shape of the lumen or luminal position of the catheter. For the evaluation of the reproducibility in the circumferential direction, we recorded the angle between the vertical axis at 12 o’clock and the position of the minimum and maximum FCT at 1 degree intervals using the centre of the optical catheter as reference. We report the agreement in classification of TCFA vs. ThCFA using the cut-off of 65 µm. Taking into account recent histology and OCT data5,9, we also chose to define a TCFA as present when the minimum FCT was <90 µm for the purpose of evaluating the consequence of different FCT thresholds.
RANKING OF THE QUALITY OF THE SEMI-AUTOMATIC ASSESSMENTS AS EVALUATED BY THE ANALYSTS
This was performed after full completion of tasks 1 and 2, and after the preparation analyst had randomly arranged the software-derived cap measurements side by side with the method applied being concealed from the analyst.
Intra-observer variability was assessed by observers 1 and 2, by re-analysing all data one month later. All analyses were performed randomly and in a blinded manner.
Statistical analysis
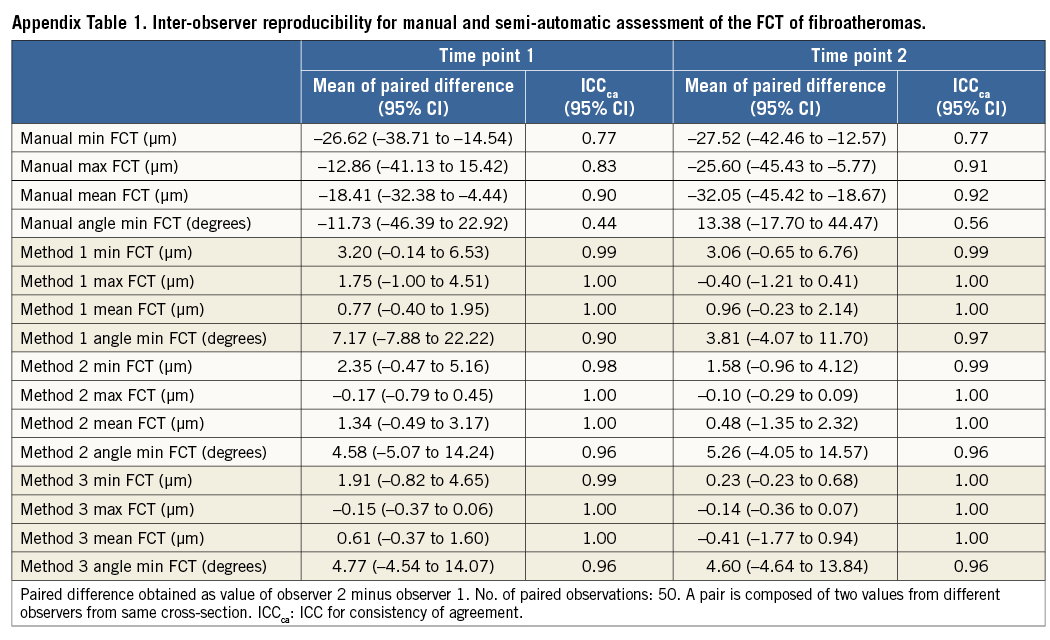
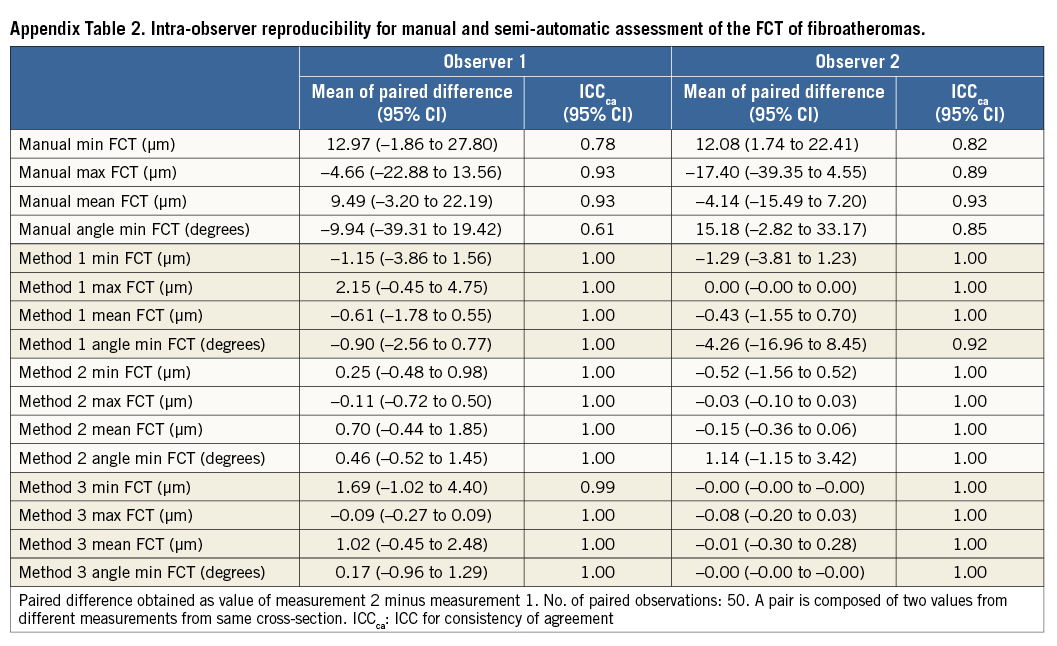
Continuous variables were expressed as mean±standard deviation, or mean and 95% confidence intervals (95% CI). There were 50 cross-sections from 36 patients, each with FCT measurements from two observers, two observation times, and four methods (manual and Methods 1-3). To quantify intra-observer, inter-observer, and inter-method agreement in FCT, we report three statistics: 1) the mean of the paired differences, which informs on the bias between two observers, observation times, or measurement methods; 2) the intra-class correlation coefficient for consistency of agreement (ICCca), which provides information on the correlation between two methods without considering the actual bias; and 3) the ICC for absolute agreement (ICCaa) which reflects the ability of two methods to agree in absolute terms such that ICCaa is reduced if there is a systematic bias between observers. Generally, an ICC <0.4, between 0.4-0.75, and >0.75 indicates poor, moderate, and excellent agreement, respectively17. Since we assumed that observers 1 and 2 were representative of randomly selected OCT observers, and since the separate intra-observer variation was very similar for the four methods (Appendix Table 1, Appendix Table 2), we performed the analyses on pooled pairs including two measurements from two observers (N=100 pairs) using one-way or two-way mixed-effects models. The agreement of the presence of TCFA was estimated by Cohen’s κ-test. The result of the ranking of the quality of the computer assessment was compared using the Kruskal-Wallis test with a Bonferroni correction.
Results
REPRODUCIBILITY OF QUANTITATIVE MEASUREMENTS
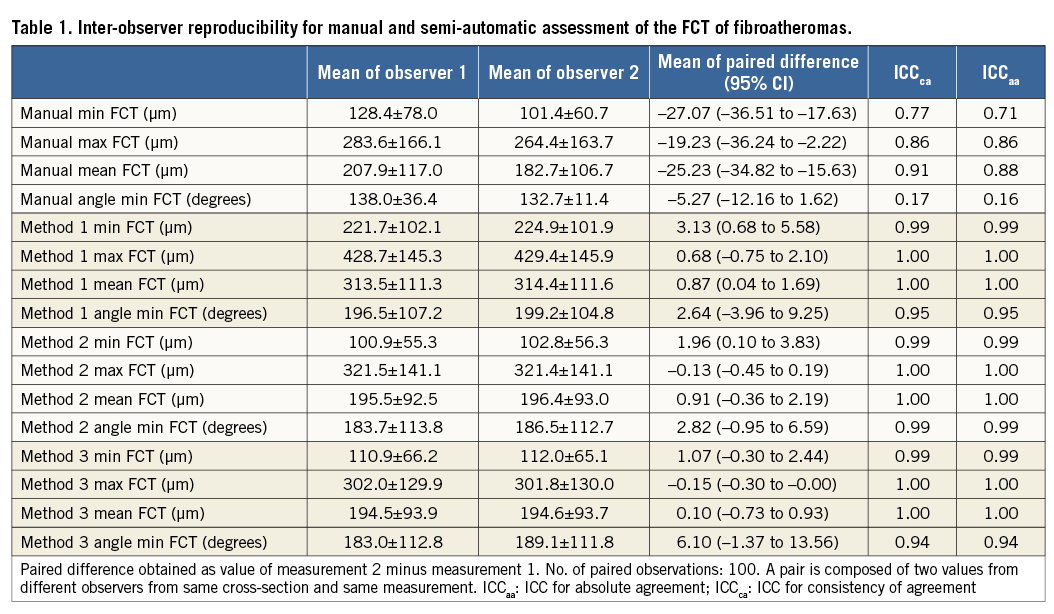
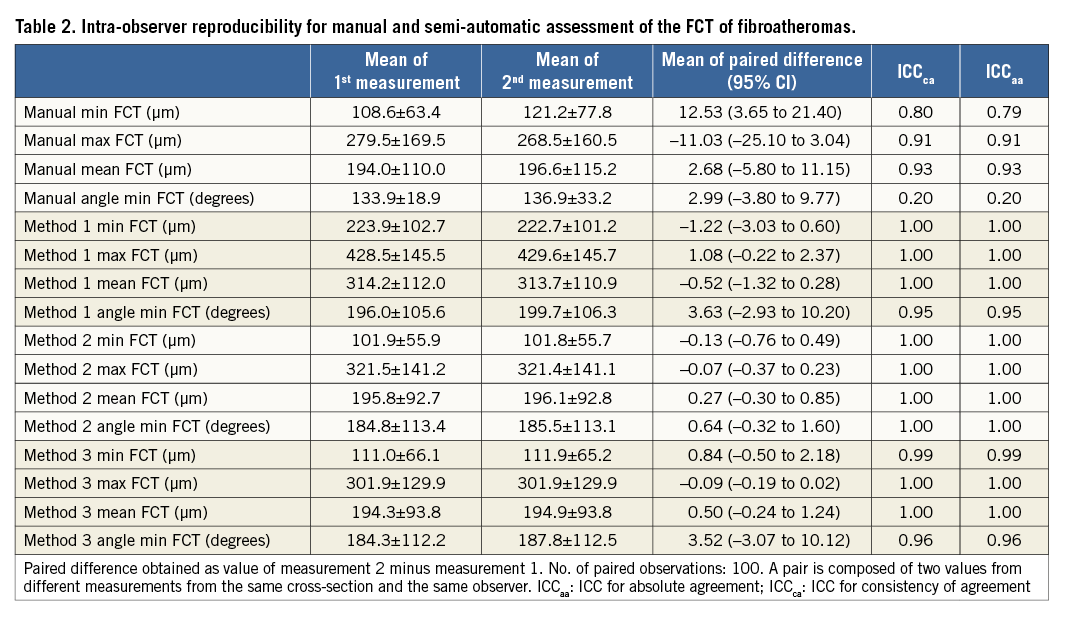
Results of the manual and semi-automatic assessment of FCT of the 50 FAs are presented in Table 1. The mean of the paired difference between corresponding assessments of the two observers decreased for all assessed parameters when switching from a manual to a semi-automatic approach. Specifically, the mean paired difference of the minimum FCT decreased from an average of 27.1 µm by manual assessment to 3.1 µm, 2.0 µm, and 1.1 µm, for Method 1, 2, and 3, respectively. This was associated with an increase in inter-observer reproducibility from ICCca 0.77 to 0.99 (similar in Methods 1-3), and ICCaa 0.71 to 0.99 (similar in Methods 1-3), and accompanied by a similar increase in the reproducibility of the angle point at which the minimum FCT was measured (ICCca increasing from 0.17 to 0.94-0.99; and ICCaa from 0.16 to 0.94-0.99). For the manual assessment, observers 1 and 2 agreed on the chosen angle point along the luminal contour in two of 100 (2%) cross-sections, whereas the agreement increased to 91 of 100 (91%), 92 of 100 (92%), and 96 of 100 (96%) cross-sections using Method 1, 2 and 3, respectively. Similar improvements were seen in the intra-observer reproducibility (Table 2).
ASSESSMENT OF THE PRESENCE OF TCFA
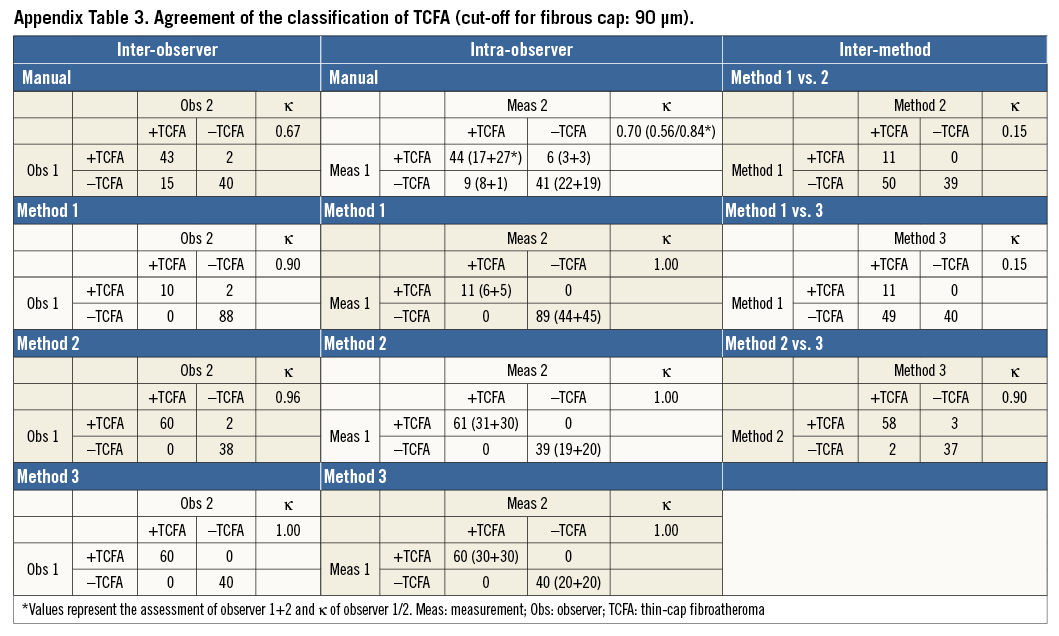
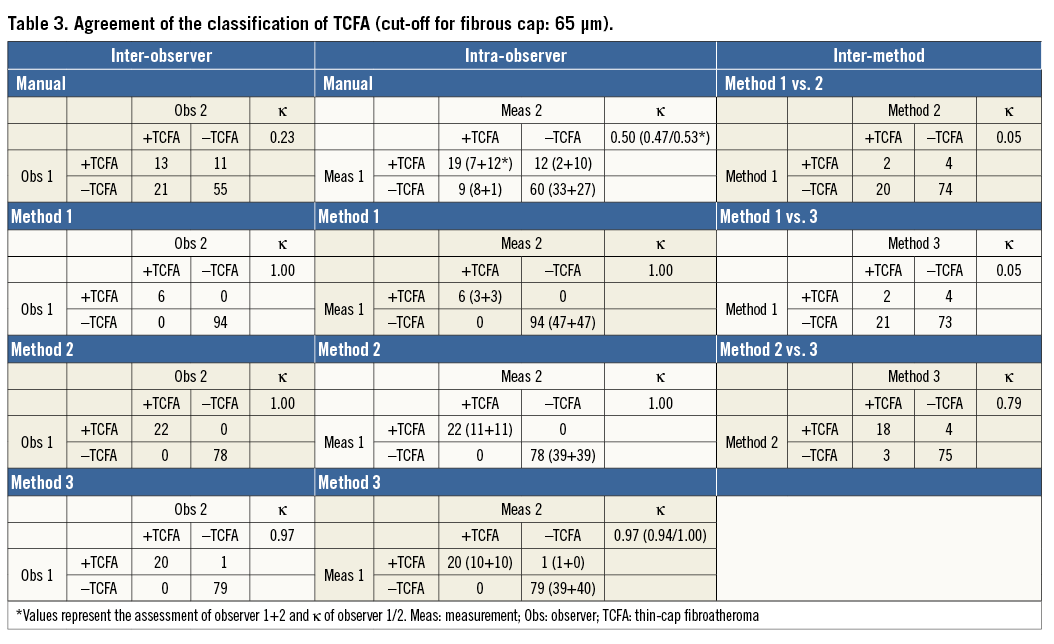
Table 3 and Appendix Table 3 present the agreement of the presence of TCFA (vs. ThCFA) between different assessments based on the minimum FCT with cut-offs of <65 µm and <90 µm, respectively. For the former, corresponding agreement was modest (κ=0.23 and 0.50, respectively) by manual assessment, and increased to almost perfect agreement (κ=0.97-1.0) by the semi-automatic methods (Table 3). For the latter cut-off, inter- and intra-observer agreement by manual assessment (κ=0.67 and 0.70, respectively) was moderate, increasing to excellent irrespective of the semi-automatic method used (κ=0.90-1.0) (Appendix Table 3).
DIFFERENCES BETWEEN SEMI-AUTOMATIC METHODS AND THE QUALITY OF THE DELINEATION OF THE BORDERS OF THE FIBROUS CAP
Measurements by Method 1 were systematically larger than those by Methods 2 and 3, which were very similar (Table 4). In comparison with the manual measurements, the greatest similarity in terms of mean paired differences was found between the manual measurements and Method 3. This was also reflected in the observer-assessed visual ranking of the quality of the computer-based cap delineation (Figure 3): while observers judged the delineation of Method 1 to be of significantly poorer quality than that of Methods 2 and 3 (overall p<0.001), the quality of the two latter was perceived as very similar (p=0.20), with a trend towards higher ranking of Method 3.
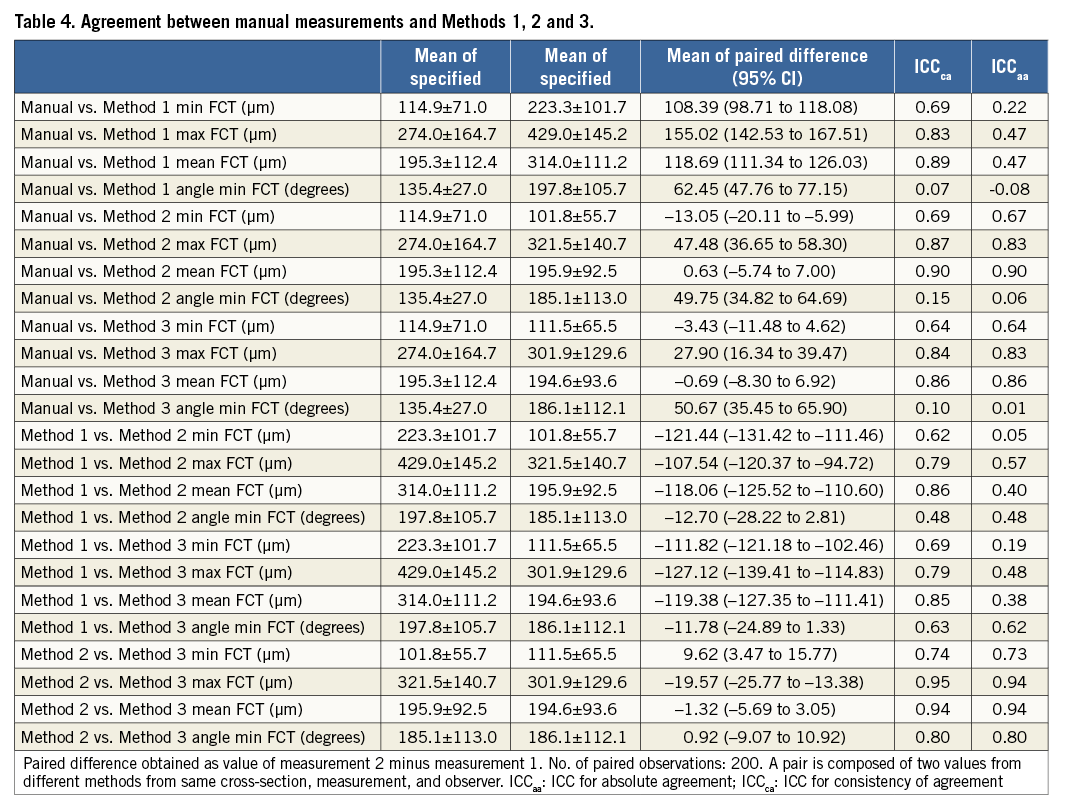
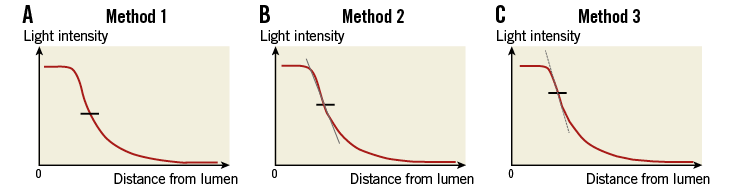
Figure 2. Technical principles of the three semi-automatic methods.
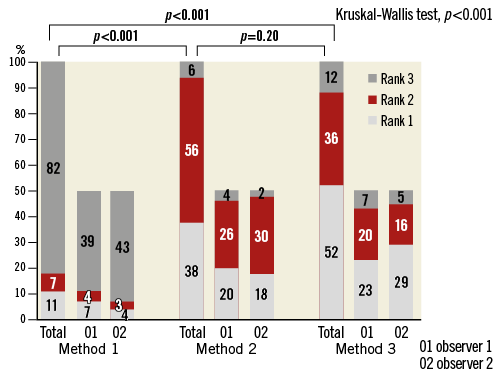
Figure 3. Ranking of the quality of fibrous cap delineation by the semi-automatic algorithms.
As for the agreement between methods for the classification of the presence of TCFA (cut-off 90 µm), this was poor for comparisons of Methods 2 and 3 with Method 1 (κ=0.15), but increased to excellent agreement (κ=0.90) between Methods 2 and 3 (Table 3).
Discussion
Given the important role of TCFAs as lesions prone to rupture and to trigger coronary events, there is a strong desire from the interventional community to identify and treat these lesions before they cause harm. The ability of OCT to identify TCFAs6 constitutes one of the driving forces of the diffusion of the technology into clinics and research. The reliable examination of these lesions, which will eventually determine the clinical value of OCT, depends on the application of meaningful and reproducible methods. The main findings of the present study were the moderate reproducibility of the manual assessment of FCT and moderate inter-observer agreement in the classification of the presence of TCFA, which increased to excellent when applying semi-automatic measures. In addition, the manual inter- and intra-observer agreement increased considerably when raising the threshold for FCT to define a TCFA from 65 µm to 90 µm.
CURRENT AND EMERGING METHODS AND THEIR REPRODUCIBILITY
The introduction of new diagnostic methods requires thorough evaluation of their reproducibility and accuracy. Even though TCFAs as visualised by OCT are often diagnosed with confidence, several factors may preclude a correct diagnosis, i.e., those involving the qualitative aspect of the assessment (identification of FAs), as well as those concerning the quantification of the FC with the aim of distinguishing TCFAs from ThCFAs11,18. Considering the inevitable variability in current manual FCT assessment (which may vary between study samples and groups) along with the fact that this method has already been applied to assess the incidence of TCFA in clinical studies to evaluate the effect of medical and interventional treatment on the evolution of FCT7,19-22, it is somewhat surprising that reproducibility analyses of this method are scarce. The only such study is from 2006 by Kume et al who reported a low inter-observer variability (n=35 lipid-rich plaques) with a mean difference in cap thickness of 20±59 µm23.
With newer-generation OCT systems providing an enormous amount of information, it has become of interest to improve data integration, analysis and reproducibility by computerised means. While Wang et al and Zahnd et al were the first to propose computer-assisted semi-automatic methods for FC quantification15,16, the present study provides a comprehensive frame-level evaluation of the reproducibility of both manual and semi-automatic FC measurements. In the present study, we tested three different algorithms for segmentation of FCT. Although it may appear peculiar to evaluate visually the result of a semi-automatic technique when hypothesising that this has a superior quantitative reproducibility compared to manual assessment, it should be emphasised that the kind of automatic segmentation that we and others have developed15,16 primarily considers changes in light intensity along axial lines and does not integrate overall information from the cross-section, e.g., appearance of the plaque and artefacts, and location of the catheter within the lumen, which are important for how a lesion is perceived overall by the expert (axial and circumferential information combined). This is different from manually determining the precise point along an axial line in a diffuse border, and is reflected in the fact that all tested methods were highly reproducible; however, they segmented the abluminal boundary of the FC differently. This difference in segmentation method also explains the absolute differences and thus poor inter-method agreement seen between the different algorithms. Similar to other studies which, however, did not highlight this step, we ranked the different algorithms and found that Method 3 delineated the FC in the best manner. This is noteworthy, considering that this algorithm is in fact identical to that described separately by Wang et al and Zahnd et al. In terms of inter-observer mean absolute difference for manually assessed minimal FCT, our variability (–27 [95% CI]: –36.51 to –17.63 µm) was slightly higher than that reported by Wang et al (12.8±8.2 µm) and Zahnd et al (22±18 µm)15,16. Since it is conceivable that the mean absolute difference might vary with the cap thickness, and since the other studies did not report the actual means of the two observers, it is difficult to evaluate whether this variation can be attributed to differences in study samples. Whether differences in the way that the FCT was traced by the software could also have been involved remains unknown. Of note, this tracing from the abluminal FC boundary to the luminal contour was, in our study, carried out along the shortest distance to the lumen, whereas, in the report by Wang et al, it was traced using the luminal centre of the vessel as reference, and by Zahnd et al using the centre of the catheter as reference.
Despite the similarity in results of our manual and Method 3 assessment of minimum FCT (Table 4), it was remarkable that the location of the angle point of the manually assessed minimum FCT was identical between observers in only two of 100 cases. This probably reflects the difficulty of placing the marker at the FC border twice identically. Though the rate is discouraging, it may be assumed that the FCT in the vicinity of the minimum site is relatively stable – something that is supported by the overall reproducibility of manually assessed minimum FCT being relatively high (ICCaa=0.71) (Table 1), despite the fact that measurements did not necessarily stem from identical sites. Whether this variation in the manual selection of the site of minimum FCT is clinically important needs to be assessed in future clinical studies involving whole vessel segments.
Even though the reproducibility increased significantly from the manual to the semi-automatic FC assessment, the latter was apparently not completely perfect (i.e., ICCs≠1.00). This was attributed to the fact that the semi-automatic aspect of the method permitted the analysts to adjust the computer-defined luminal contour. This was performed twice by observer 1 in the first assessment due to residual blood in the lumen (Figure 4 Case A, Figure 4 Case B), and in addition this observer adjusted the angular line delineating the ROI laterally in one case at both time points (Figure 4 Case C). The latter resulted in the extension of the ROI into a region where the OCT light was subject to the artefact tangential signal drop-out due to catheter marginalisation24, and thus the minimum FCT was recorded at the site of an artefact mimicking a TCFA. The effect of these manual changes reflects reality accurately, suggesting that TCFA assessment is to some extent observer-dependent even when using semi-automatic methods, highlighting the need for the observers to possess knowledge about the pitfalls of OCT image interpretation. In spite of these results, the overall reproducibility remained excellent (Table 1, Table 2), confirming that there is room for such corrections as long as they are limited.
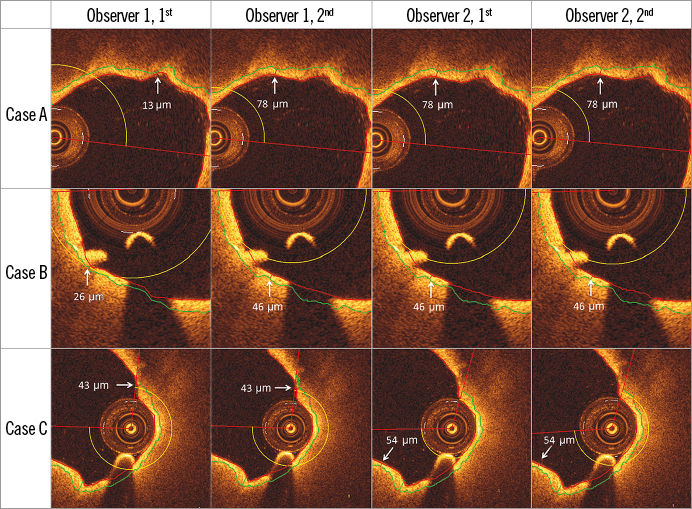
Figure 4. Cases in which manual corrections in the luminal contour were performed. Measured TCFA thickness was changed after adjusting computer-defined luminal contour in Case A and Case B (both by Observer 1, first assessment), and after extending ROI in Case C (Observer 1, both assessments). Note that the guidewire shadow can be actively excluded from the fibrous cap thickness tracing (not shown here).
CLASSIFICATION OF TCFA AND THE IMPORTANCE OF SEMI-AUTOMATIC METHODS FOR FUTURE STUDIES
In view of the specific interest in studying FAs as a binary defined group of lesions (TCFA vs. ThCFA) rather than by their actual cap thickness, a satisfactory reproducibility of the TCFA classification is crucial for the reliability of prognostic and therapeutic results. In the present study, we reported mean absolute differences in manually assessed minimal FCT of 27 µm. Even though low, this difference may have an important effect on the classification of lesions based on cap thickness (TCFA vs. ThCFA). In our study, this was associated (as expected) with a moderate agreement (κ=0.76) compared to the excellent agreement (κ=0.90-1.0) by the semi-automatic methods. Additionally, we observed an interesting increase in the agreement of TCFA classification by manual assessment when raising the threshold from 65 µm to 90 µm. On the one hand, the lower reproducibility at 65 µm might be related to a certain difficulty in obtaining such low values by manual measurements; on the other hand, even minor variations such as the above absolute difference of 27 µm may have a greater impact when related to smaller, compared to larger references. Altogether, it is necessary to consider the effect of the selection of FC threshold on manual reproducibility when interpreting available reports and selecting methodology for analysis. By extension, future studies will need to assess whether the enhanced agreement in classification of FA by semi-automatic compared to manual methods, together with the opportunity of full volumetric analysis of larger plaque regions, will elucidate the mechanisms of plaque rupture better and allow prediction of subsequent coronary events.
Limitations
Considering the expectation that the semi-automatic assessment would be superior to the manual, we would like to acknowledge the possible bias in the study against the latter. Although we sought to minimise this by using the same lumen contour segmentation and assisted FC tracing as with the semi-automatic methods, this may not constitute a sufficient optimisation.
Although the reproducibility of all three semi-automatic methods was excellent, we found differences in the FCT values derived by the different algorithms. The main limitation of the present study is that cap thickness segmentation was merely compared to manual assessments, thus sufficiently addressing the question of reproducibility but not that of accuracy, which requires validation against ex vivo histopathologic specimens15,16. Validation in the true sense of the word was not performed in any of the previous studies either. Still, this shortcoming should be seen in the light of the limitations of histology, where manual quantitative assessments may be expected to be associated with a similar type of variability to the one in this study. Additionally, tissue shrinkage owing to histological processing together with matching problems are also expected to constitute sources of error in the comparison25.
The semi-automatic aspect of the present method is limited by the need to define the lateral boundaries of the FA manually. A potential solution for this might be the application of tissue characterisation by light attenuation analysis of the entire frame to delimit regions containing FAs, something which, however, also needs to be validated. With respect to the inaccurate segmentation of the luminal contour in the presence of residual blood, optimisation in the quality of image acquisition should be assured in order to limit the need for manual corrections.
Finally, it should be noted that the current study was not designed to assess the real-world reproducibility, but was limited to a relatively small sample focusing specifically on the potential improvement in reproducibility of the semi-automated methods. Larger and real-world data are needed in order to estimate the true absolute reproducibility.
Conclusion
While semi-automatic assessment of FCT and TCFA classification is associated with excellent reproducibility and agreement, manual measurements are associated with moderate reproducibility and agreement. The agreement in manual classification of FA increased from poor agreement when raising the FC threshold for defining a TCFA from 65 µm to 90 µm.
| Impact on daily practice The in vivo detection of TCFAs by means of OCT appears clinically relevant owing to its potential to identify patients at increased risk for future coronary events. To date, a manual quantification of the fibrous cap thickness is widely used in clinical practice and intracoronary imaging studies. This report suggests that the use of a semi-automatic delineation of the fibrous cap improves the reproducibility and agreement when assessing the minimal cap thickness and categorising fibroatheroma into thin- versus thick-cap plaques. For this reason, the use of a semi-automatic assessment appears essential when performing serial analyses (e.g., investigation of the effect of pharmaceuticals on fibrous cap thickness) or when categorising fibroatheroma based on their fibrous cap thickness. |
Guest Editor
This paper was guest edited by Fernando Alfonso, MD; Cardiac Department, Hospital Universitario de la Princesa, IIS-IP Universidad Autonoma de Madrid, Madrid, Spain.
Conflict of interest statement
M. Radu, S. Windecker and L. Räber received speaker fees (all) or research grants (LR, SW) from St. Jude Medical. The other authors have no conflicts of interest to declare. The Guest Editor has no conflicts of interest to declare.
Supplementary data