Abstract
Aims: To validate the accuracy and evaluate the intra- and inter-observer variability of vascular measurements using novel Fourier-domain optical coherence tomography (FD-OCT) versus intravascular ultrasound (IVUS) in a coronary phantom model.
Methods and results: A dedicated cylindrical phantom comprised of four sections with differing dimensions was used to compare images generated by five FD-OCT and five IVUS catheters. Each FD-OCT catheter was tested using three different consoles, generating 15 imaging pullbacks. Two independent experts, blinded to the phantom data, performed measurements. There were 180 FD-OCT and 60 IVUS cross-sectional measurements of mean lumen diameter (MeanLD), minimal lumen diameter (MLD), maximum lumen diameter (MaxLD) and lumen area (LA) at three points in each section. FD-OCT measurements had excellent correlations with IVUS (concordance correlation coefficient [CCC]: ≥0.9769 for MeanLD, LA or longitudinal length [LL]) and phantom dimensions (CCCs for FD-OCT: ≥0.9958 for MeanLD, LA or LL). FD-OCT measurements were larger than IVUS (p<0.0001), but showed less measurement errors compared to IVUS (p<0.0001). Moreover, FD-OCT caused less discrepancy between MaxLD and MLD versus IVUS (p<0.0001). Intra- and inter-observer variability was low for both FD-OCT (CCCs for MeanLD, LA and LL ≥0.9996) and IVUS (≥0.9935). Image catheter position did not influence FD-OCT measurements.
Conclusions: FD-OCT was more accurate than IVUS and had similar high reproducibility to determine vascular dimensions in vitro. These results support the use of FD-OCT in the clinical setting.
Introduction
Optical coherence tomography (OCT) is an optical analogue of intravascular ultrasound (IVUS)1 and is becoming a standard invasive imaging tool in the catheterisation laboratory. Its high resolution (10-20 µm) enables detailed and unprecedented imaging of intravascular structures, such as thin fibrous caps2 and strut-level tissue coverage in drug-eluting stent struts3-6. The first generation time-domain OCT (TD-OCT) required balloon occlusion proximal to the target segment to displace blood during image acquisition7. The relatively longer acquisition times due to slower pullback speeds (1-3 mm/sec) of TD-OCT scanning have been shown to trigger transient ischaemic symptoms and electrocardiographic changes while obtaining coronary images8,9.
Recent advances in OCT technology, called Fourier-domain OCT (FD-OCT), enable acquisition of images at speeds 15-50 times faster than TD-OCT, as well as wider fields of view and improved lateral resolution10. Although FD-OCT has recently been introduced into clinical practice, no formal study was performed to validate vascular measurements using the new FD-OCT system. This study aimed to validate the accuracy and intra- and inter-observer variability of FD-OCT measurements using an in vitro vascular phantom.
Methods
Phantom model
In this study, we used a single dedicated arterial phantom model with four sequential, circular styrene plastic arterial models, which had lumen diameters of 2.667 mm, 3.810 mm, 2.032 mm, and 3.378 mm. The segments were 14.17 mm, 12.23 mm, 8.08 mm and 9.25 mm in length, respectively.
Fourier-domain optical coherence tomography
Prototype FD-OCT system consoles (C7-XR™, OCT Imaging System; LightLab Imaging, Westford, MA, USA) and 2.7 Fr image catheters (Dragonfly™ imaging catheter; LightLab Imaging, Westford, MA, USA) were used for image acquisition. Each FD-OCT catheter was tested using three different consoles; a total of 15 pullback images were acquired. All pullback images were acquired at frame rates of 100 frames/sec and 20 mm/s of pullback speed in a tank filled with contrast held at 37 degrees Celsius. Measurements of cross-sectional and longitudinal images were performed by two independent experts, blinded to the actual phantom dimensions, using a dedicated software with an automated contour-detection algorithm (Off-line Review Software, version C.0; LightLab Imaging, Westford, MA, USA).
Each expert reviewed the automated system calibration (zero-point setting or “Z-offset”) and manually adjusted it as required. The review of the Z-offset was performed on every frame assigned for cross-sectional measurement for the best alignment between the four yellow fiducials and the outer ring of the image catheter sheath reflection (Figure 1A).
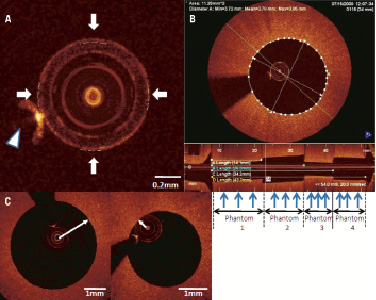
Figure 1. A) Magnified image of LightLab™ C7-XR image catheter sheath reflection. Arrows indicate four fiducials which are properly positioned after Z-offset adjustment. Arrow head indicates guidewire blooming. B) Cross-sectional and longitudinal Fourier-domain optical coherence tomography (FD-OCT) images in phantom model. For cross-sectional image, mean lumen diameter, minimal lumen diameter, maximal lumen diameter and lumen area were measured at approximately 1/4, 1/2, 3/4 point (blue arrows) for each phantom section. For longitudinal image, four different lengths, which were (A) phantom1, (B) phantom1 and 2, (C) phantom1, 2 and 3, (D) phantom1, 2, 3 and 4 were measured. C) FD-OCT image catheter position in coronary phantom model. Arrow indicates the minimal catheter-to-lumen distance. Left: Concentric catheter position. Wire concentric index (WCI) is 0.82. Right: Eccentric catheter position. WCI is 0.31.
If the four fiducials did not align with the outer ring exactly, the sum of the distance from each fiducial to the outer sheath should have been zero or near zero. A total of 180 cross-sectional measurements were performed at different longitudinal transverse distances as shown in Figure 1B. For diameter and area measurements, automatic lumen contour detection was used, followed by minor manual correction if necessary. Mean lumen diameter (MeanLD), minimal lumen diameter (MLD) and maximum lumen diameter (MaxLD) were computed automatically after drawing the lumen contours. Furthermore, a total of 60 longitudinal lengths (LLs) were calculated on longitudinal images measuring (A) phantom 1, (B) phantom 1 and 2, (C) phantom 1, 2 and 3, (D) phantom 1, 2, 3 and 4 (Figure 1B). One expert performed the same measurements four weeks after the first reading for assessment of intra-observer variability. The same expert also assessed the impact of image catheter position on measurements using a wire concentric index (WCI) (Figure 1C), which was calculated as the minimal distance from the center of the image catheter to the lumen divided by the lumen mean radius for the same 180 cross-sectional images, as reported previously11. Since this WCI was defined for presenting the position of the optic light that was located in the centre of the TD-OCT catheter in the vessel lumen, we applied this index for the FD-OCT catheter whose optic light was similarly located in the centre of the catheter.
Intravascular ultrasound
The Atlantis SR Pro 40 MHz catheter and the iLab ultrasound console (Boston Scientific Corporation, Natick, MA, USA) were used for IVUS image acquisition. IVUS pullback images were acquired at a 1 mm/s pullback speed and 30 frames/s in a tank filled with circulating heparinised (ACT of nominally 300 sec) porcine blood held at 37 degrees Celsius. The flow rate was 2 ml/s, which is essentially a nominal physiological rate. A total five pullback images were acquired using five different IVUS catheters. Quantitative IVUS analysis was performed using a validated semi-automated detection algorithm (Curad, version 4.32, Wijk bij Duurstede, The Netherlands) by two blinded independent experts. Measurements were performed for 60 cross-sections and 20 LLs, the same as for FD-OCT measurements (Figure 2).
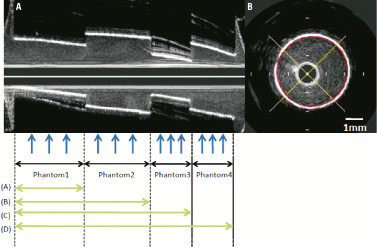
Figure 2. A) Longitudinal IVUS image in phantom model. Blue arrows indicate each point for cross-sectional measurements. (A) phantom1, (B) phantom1 and 2, (C) phantom1, 2 and 3, (D) phantom1, 2, 3 and 4 are identical to those in FD-OCT longitudinal image (Figure 1). B. Cross-sectional IVUS image. Red line is semi-automatically detected lumen contour.
Semi-automatic lumen contour detection was used for lumen area (LA) measurement, and MeanLD, MLD and MaxLD were automatically computed after lumen contour detection. As in the FD-OCT, one expert performed the same measurements four weeks after the first reading for assessment of intra-observer variability.
Endpoints
Study endpoints were the accuracy of measurements performed using FD-OCT, evaluated by concordance correlation coefficients (CCCs) and differences compared with IVUS measurements and the actual dimensions of phantom sections, intra- and inter-observer variability of FD-OCT and IVUS also assessed by CCCs, and the influence of FD-OCT catheter position on the accuracy of the FD-OCT measurements.
Statistical analysis
All analyses were conducted with SAS, version 8.2 (SAS Institute, Cary, NC, USA). Continuous variables were presented as mean±SD, and the paired t-test was used for significant differences. P <0.05 was considered to be significant. Categorical variables were expressed as percentages. Correlation between FD-OCT and IVUS measurements was determined by CCC using mean measurements of two readers. Correlation between measurements of each modality with actual dimensions was also determined by CCC using mean measurements of two readers. Bland-Altman-style plots were used to display the measurement errors of the mean measurements from actual values (y-axis) and the actual values (x-axis). Differences between lower and upper 95% confidence intervals (CIs) were displayed. Intra- and inter-observer variability was evaluated by CCCs. Correlation between WCI and % difference of cross-sectional measurement, which was the absolute difference divided by the actual value, was assessed by linear regression analysis.
Results
All images acquired by FD-OCT and IVUS met quality standards and were analysed for morphometric measurements. OCT penetrated better through styrene than IVUS; however, both IVUS and OCT detected sharp boundaries; in fact, IVUS had a slightly higher contrast boundary. Since FD-OCT measurements were consistent among the three different consoles (p=NS), we used 60 cross-sectional measurements and 20 longitudinal measurements of FD-OCT images acquired using console 1 for comparison with IVUS. Table 1 shows correlations between FD-OCT (console 1) and IVUS measurements, between FD-OCT (all results) and actual dimensions, and between IVUS and actual dimensions.
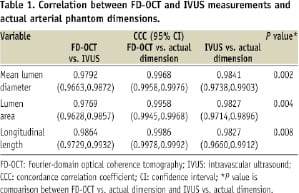
There was a strong correlation between these two modalities for MeanLD, LA and LL. Both FD-OCT and IVUS presented good correlation with actual dimensions for MeanLD, LA and LL, but FD-OCT showed better correlation. As shown in Table 2, FD-OCT measurements for MeanLD, LA, and LL were larger than IVUS, but MaxLD-MLD was smaller (p <0.0001).
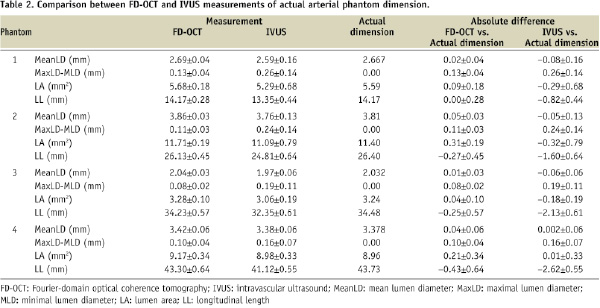
Figure 3 presents Bland-Altman-style analyses that display the measurement errors between each modality and the actual phantom dimensions and show narrower 95% CIs in all FD-OCT measurements compared to IVUS.
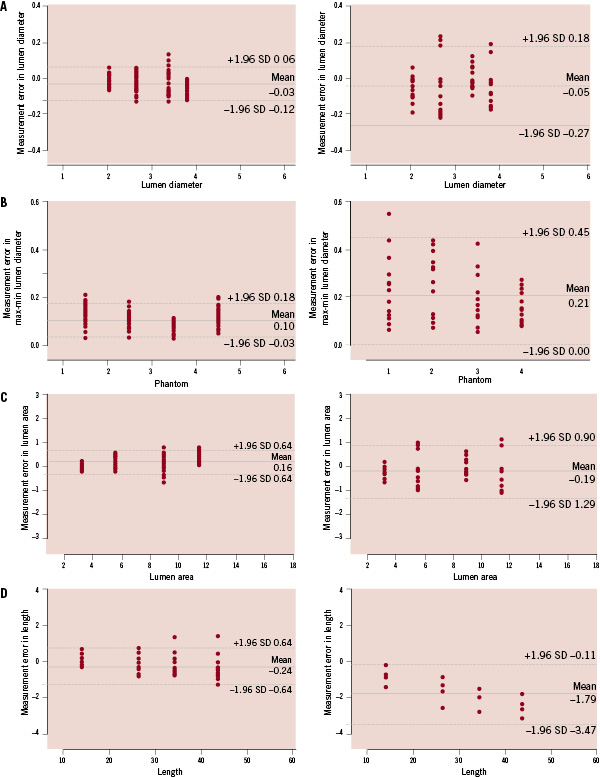
Figure 3. Bland-Altman-style plots presenting measurement errors for mean lumen diameter (A), maximal lumen diameter - minimal lumen diameter (B), lumen area (C), and longitudinal length (D). Left: FD-OCT, Right: IVUS. Y-axis: measurement errors (mm). X-axis: (A) known lumen diameter (mm), (B) phantom number, (C) known lumen area (mm), (D) known length (mm).
Measurement errors were smaller in FD-OCT measurements than IVUS for all variables (p<0.0001).
Figure 4 shows representative images at the junction of two sequential phantoms.
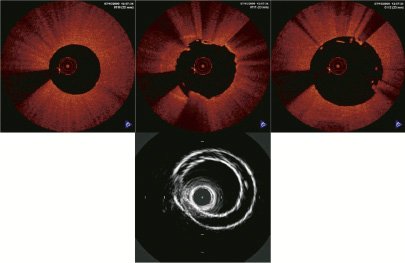
Figure 4. FD-OCT and IVUS images at the junction of 2 sequential phantoms. Upper: Sequential (0.2mm interval) FD-OCT images at junction of phantom1 and 2 (from left to right), none of which showed two 2 phantom walls which do not physically exist. Lower: IVUS image at the same junction. Two phantom walls were clearly visualised.
The IVUS image visualised two phantom walls (edges) directly over one another, which was not seen in the FD-OCT phantom images.
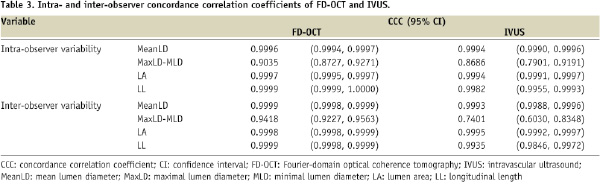
Table 3 presents intra- and inter-observer variability of FD-OCT and IVUS measurements. Both FD-OCT and IVUS showed excellent correlation for MeanLD, LA and LL with low intra- and inter-observer variability.
The correlation between WCI and % difference of FD-OCT cross-sectional measurements from actual values is shown in Figure 5. For MeanLD (Figure 5A) and LA (Figure 5B), there was no correlation between WCI and % difference of measurements.
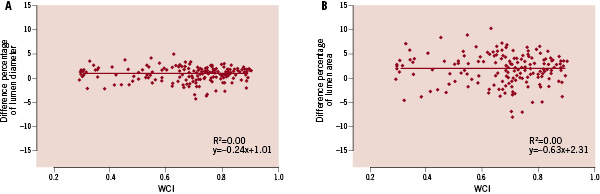
Figure 5. Correlation between wire concentric index (WCI) and % difference of cross-sectional measurements in FD-OCT. (A) mean lumen diameter, (B) lumen area. Y-axis: difference percentage of (A) mean lumen diameter, (B) lumen area. X-axis: WCI.
Discussion
Preclinical validation of new imaging systems is indispensable for the conduct of vascular morphometric assessments in the clinical setting. IVUS vascular measurements have been extensively validated in both in vitro and in vivo studies12-14, but OCT is a relatively new and still evolving intravascular modality. This first validation study of FD-OCT imaging showed good agreement with both IVUS and actual vascular phantom dimensions. The study also demonstrated that FD-OCT measurements reflected actual arterial phantom dimensions more accurately than IVUS with low intra- and inter-observer variability. Finally, the study showed that the position of the FD-OCT image catheter within the phantom lumen did not influence morphometric measurements, and that FD-OCT images had less axial distortion than IVUS.
Yamaguchi et al reported a high correlation between measurements of lumen diameter and lumen area obtained by first generation TD-OCT and IVUS, but TD-OCT measurements were found to be smaller than IVUS9. This clinical study did not use a gold standard method to validate these measurements, but several factors have been postulated to explain the observed discrepancies between IVUS and TD-OCT in the clinical setting. One possibility is that intracoronary perfusion pressure is reduced during balloon inflation leading to artificially smaller vessel dimensions during TD-OCT image acquisition. Another possibility is that the larger profile of IVUS catheters may stretch smaller vessels causing artificially larger dimensions.
Gonzalo et al reported that without occlusion, or the flushing technique, lumen area was still smaller by 21.5% using FD-OCT compared to IVUS in the five in vivo coronary arteries15. Since end-diastolic frames were selected for obtaining IVUS pullback using a gating system in their study, which was not allowable for OCT pullback, lumen area might be larger by IVUS than OCT. Ex vivo results in human coronary arteries have also shown smaller areas with OCT than IVUS in the same study. No flexibility of the material used for the phantom model could explain the discrepancy between their ex vivo results and our in vitro results. However, considering that image acquisition conditions are different for IVUS and OCT, it is probable that these differences could affect the morphometric results acquired in vivo, and thus the applicability of our results in phantoms to the clinical setting is limited. In the present study, FD-OCT measurements showed strong correlation with IVUS. Although the in vitro experiment set up in this study attempts to mimic the clinical application of FD-OCT with contrast-filled lumen, future clinical validation of the present findings is still required.
The observed high reproducibility of FD-OCT measurements is critical for future clinical and research applications of this technology. Current OCT systems require image calibration (Z-offset) prior to the measurements, which might impact the reproducibility of quantitative measurements. In TD-OCT systems, Z-offset calibration is performed using sheath reflection of the 0.019 inch imagewire as a reference, but the outermost ring of the sheath reflection is sometimes difficult to define. The new rapid-exchange imaging catheter of the FD-OCT system has a transparent plastic sheath which better enables the recognition of the “target” outer ring of reflection. This facilitates adjustment of the Z-offset, which likely contributed to the excellent intra- and inter-observer reproducibility observed in the present study.
The accuracy of TD-OCT measurements was previously evaluated by Sawada et al using vascular phantom objects16. In that study, TD-OCT measurements were affected by the imagewire position and the frame rate of image processing. When the imagewire was located in eccentric positions and the frame rate was lowered to 8.2 frames/s, measurements of diameter and area presented with significant errors. Also, the ratio of the MaxLD and MLD became significantly larger in eccentric positions. Our group previously reported that eccentric imagewire position with WCI<0.22, occurred frequently in the clinical setting (>50% of cases) and influenced image measurements11. FD-OCT catheter position did not influence the accuracy of measurements in the present study. The larger profile FD-OCT catheters (0.90 mm) compared with 0.019 inch (0.48 mm) TD-OCT imagewire may lead to a less eccentric position within the lumen. Indeed, WCI was always >0.22 in the present study, even when the image catheter was in direct contact with the lumen wall. Further evaluations will be required to validate these findings in vivo, as vessel tortuosity, motion and larger vessel diameters may impact these results.
FD-OCT measurements were more accurately reflective of the true phantom dimensions than IVUS. These results are in line with a previous phantom study which showed that TD-OCT provided closer measurement to the actual phantom dimension compared to IVUS15. Furthermore, FD-OCT measurements were less influenced by image distortion compared to IVUS. The difference between MaxLD and MLD, which is ideally expected to be zero in the circular phantom model when it is centre-located, was smaller in FD-OCT compared to IVUS images (Table 2). This might be explained by image distortions caused by the non-uniform angular velocity of IVUS probes, which is not observed with FD-OCT. Moreover, the superior lateral resolution of FD-OCT enabled the accurate visualisation of the sequential alignment of the phantoms sections, which are not physically overlapped as depicted in IVUS images (Figure 4). It is likely that the wider beam spread of IVUS explains this image misalignment, which may also explain the fact that measured LLs by IVUS were much shorter than the actual section lengths.
Although the differences of FD-OCT measurement compared to the actual phantom were negligible and better than that observed for IVUS, there was a trend towards larger LA in FD-OCT measurements compared with the actual phantom dimensions. In vivo and ex vivo validations using native arterial segments are required to provide further guidance for future interpretations of FD-OCT measurements in the clinical setting.
Study limitations
This study cannot evaluate all conceivable clinical conditions, including cardiac motion, vessel tortuosity, and complex lesion shapes. Simulation of all possible conditions in the human coronary is technically difficult and requires ex vivo or in vivo preclinical studies which are already planned. OCT shows the better lumen boundary delineation for in vivo coronary arteries in the previous published data17. In our study, we observed a higher contrast boundary in IVUS, although OCT also showed sharp boundaries. This difference is considered to be the result of the styrene plastic that was used as a material for the phantom arterial model. The ellipticity may partially account for the lumen disproportion for both FD-OCT and IVUS, since the catheter can be located in the vessel non-coaxially for both FD-OCT and IVUS.
Acknowledgements
Funding sources were University Hospitals, Case Medical Center, Cleveland OH, USA and LightLab Imaging, Westford, MA, USA.