Abstract
Aims: Fourier domain optical coherence tomography (FD OCT) enables imaging of long coronary artery segments within few seconds, employing high data acquisitions, speed and fast automated catheter pullback. However, the reproducibility of these high-speed pullbacks in the clinical situation is unknown. We tested the reproducibility of in vivo, intracoronary FD OCT and assessed the influence of different computer-assisted algorithms on quantitative analysis.
Methods and results: In patients undergoing elective coronary stenting, two repeated FD OCT pullbacks (20 mm/sec), were acquired. Lumen area (LA) and stent area (SA) were measured at 1 mm longitudinal intervals (n=18 pullbacks, n=326 frames). Inter-study variability in terms of absolute difference of mean LA, mean SA and minimum LA was very low (–0.06±0.28 mm2, –0.05±0.29 mm2 and –0.11±0.33 mm2 in software 1) Sources of variability were incomplete visualisation of the vessel circumference, ambiguous luminal borders and drift of internal catheter calibration (Z-offset). Inter-software variability for LA and SA was low (R2=0.98 ~ 1.00, p<0.01, respectively).
Conclusions: FD OCT shows excellent reproducibility for consecutive pullbacks and represents a reliable tool for the in vivo assessment of stented coronaries. Computer-assisted quantitative analysis of FD OCT may be a valuable tool for future studies.
Introduction
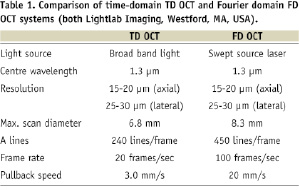
Optical coherence tomography (OCT) is a light-based imaging modality that can be used to study tissues in vivo with near-histologic, high resolution1-5. The clinical application of the first generation intracoronary OCT systems (time domain TD OCT) was hampered by the need to create a blood-free environment during OCT data acquisition and a relatively shallow penetration depth into the tissue. In consequence, intracoronary TD OCT was restricted to selected patients in which only a relatively short coronary segment could be visualised in order to avoid significant ischaemia during imaging in a locally blood-free environment6,7. Fourier domain OCT (FD OCT) represents the second generation intracoronary OCT developed to overcome these limitations by using frequency-domain ranging techniques. FD OCT is capable of acquiring images at up to 160 frames/s which is more than five times speed of TD OCT6,8,9, and allows for in vivo OCT data acquisition with high pullback speeds (up to 40 mm/sec). Coronary arteries can now be imaged within a few seconds while blood is only temporally displaced by the injection of X-ray contrast through the guiding catheter and without need for transient vessel occlusion. This approach may offer significant advantages in feasibility, patient safety and length of the visualised coronary segment6,7.
However, there is paucity of data regarding the reproducibility of image data acquired by such unprecedented high pullback speeds. We recently reported that TD OCT images are suitable for computer assisted contour delineation allowing for accurate quantitative analysis in vitro10,11 and in vivo with very low observer variability12.
The objectives of the present study are i) to test the inter-study reproducibility of quantitative FD OCT performing multiple pullbacks in patients after elective coronary stent implantation and ii) to test three different computer assisted, quantitative analysis approaches.
Methods
Patient population and FD OCT imaging procedure
Patients scheduled for elective coronary stent-implantation were included. All patients received weight-adjusted intravenous heparin in order to maintain the activated clotting time >300 sec. The FD OCT image catheter was advanced distally to region of interest (ROI) over a 0.014-inch conventional angioplasty guidewire and 6 Fr guiding catheters. Two repetitive pullbacks were performed during continuous injection of X-ray contrast (Iodixanol 370, VisipaqueTM; GE Health Care, Cork, Ireland) through the guiding catheter using an injection pump (Mark-V ProVis; Medrad Inc. Indianola, PA, USA). During FD OCT pullback, the fiberoptic core was withdrawn while the outer translucent sheath stayed stationary in the artery and did not change the position during the repetitive pullbacks. An arbitrary contrast flush rate of 3 ml/s has been chosen on an empirical basis as contrast injection at a flow rate of 3-5 ml/s is needed for optimal coronary arteriogram. Each pullback was preceded by the intracoronary administration of 0.2 mg nitroglycerine. All patients gave written informed consent.
FD OCT imaging system
We used an intravascular swept source FD OCT system (LightLab Imaging, Westford, MA, USA)9. This OCT system used a scanning laser as light source which swept over a range of wavelengths between 1,250 and 1,350 nm. In order to create the OCT images, the echo-time delay and the amplitude of light reflected from the tissue microstructure at different depths were determined by processing the interference between the tissue sample and a fixed reference mirror. The imaging depth was approximately 1.5 mm into tissue with an axial resolution of 15 ~ 20 µm and a lateral resolution of 25 ~ 30 µm (Table 1).
The FD OCT imaging catheter (2.7 Fr crossing profile) had a short monorail design and contained the fiberoptic core that rotated within a translucent sheath (Figure 1).
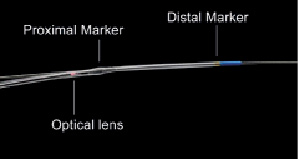
Figure 1. View of the FD OCT catheter tip. The 2.7 Fr FD OCT imaging catheter is 6 Fr guide catheter compatible and designed for rapid-exchange delivery over a 0.014 inch conventional guidewire. During automated pullback the fiberoptic imaging core, containing the optical lens, is withdrawn within the transparent outer catheter sheaths, while the catheter stays stationary within the coronary artery.
The imaging catheter was connected at its proximal end to the imaging console that permitted real-time data processing and the two-dimensional representation of the backscattered light in a cross-sectional plane. Images were acquired at 100 frames/s and an automated pullback speed of 20 mm/s.
OCT calibration
Prior to introduction of the FD OCT catheter into the coronary artery, a Z-offset adjustment was performed manually in order to account for the inter-catheter differences in optical pathway by matching the length between light source and reference mirror to the length between light source and the tip of fiberoptic imaging core. After in vivo FD OCT data acquisition and prior to DICOM conversion and loading on picture archiving system, this Z-offset correction procedure was repeated whenever necessary by an experienced analyst (Figure 2A).
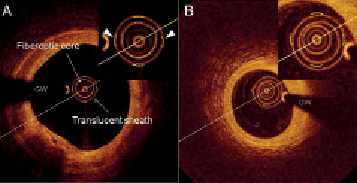
Figure 2. A: Standard calibration technique in software 1. The visualisation of the outer border of the translucent sheath was adjusted to the calibration markers (triangles). B: The outer border of the translucent sheath cannot be aligned accurately to the calibration markers because the centre of the translucent sheath deviated from the centre of the fiberoptic core. GW: guidewire
OCT analysis
The corrected OCT image datasets were then transformed into DICOM image standard and stored onto a picture archiving system.
The region of interest (ROI) was the stented segment, defined as the region between the first and the last frame in which struts were visible over 360 degree vessel circumference. Quantitative OCT analysis was performed using three different dedicated software packages. (software 1: proprietary Lightlab Imaging software on a dedicated core laboratory workstation; software 2: CURAD vessel analysis [Curad B.V., Wijk bij Duurstede, The Netherlands], software 3: QCU-CMS [Medis Medical Imaging Systems B.V., Leiden, The Netherlands]). While lumen areas (LA) could be traced to various degrees in a computer-assisted way, stent areas (SA) had to be traced manually in all software packages: Software 1 allowed for manual tracing of LA and SA by placing multi-points (12 ~ 20 points in each cross section) on the respective borders in individual frames. Software 2 allowed for semi-automated tracing of the LA using computer assisted contour detection in the cross sectional plane13. The lumen contour was obtained with an automated detection algorithm and additional manual corrections were performed if necessary. Software 3 allowed for tracing of the LA using a combination of transversal and longitudinal contour detection. The lumen contours were detected automatically in eight automatically defined longitudinal cutplanes, then the transversal lumen contours were generated using these points as guidance. This approach allowed to analyse every individual frame within the ROI14. For software 1 and 2 cross sections were analysed at 1 mm intervals along the ROI. For software 3, two types of analysis were performed: one including all frames within the ROI and one with selected frames at 1 mm intervals. In case the selected cross section was not suitable for analysis, the adjacent frame proximal or distal to the target frame was analysed. Cross sections with a major side branch (diameter >2 mm; or side branch take off occupying more than 60 degrees of the lumen circumference of the parent vessel) were excluded from analysis as well as cross sections, in which the complete lumen circumference of 360 degrees could not be visualised e.g., due to motion artefacts during the cardiac cycle. Data were analysed as follows:
STUDY 1: INTER-STUDY VARIABILITY
Inter-study variability for two repetitive FD OCT pullbacks was assessed by software 1, 2 and 3. Mean LA, mean SA, minimum LA (MLA) and the length of ROI were compared. Corresponding ROI were matched based on anatomic landmarks such as stent edges or side branches. The lengths of ROI was calculated as frame count (n) divided by frame rate (n/sec) and then multiplied by pullback speed (mm/sec).
In a subset of lesions treated with single stent implantation, measured stent length was compared to nominal stent length. Stent length was derived from the first and the last cross section where struts were visible over 360 degree vessel circumference.
STUDY 2: INTER-SOFTWARE VARIABILITY
Inter-software variability was assessed by comparing mean LA, mean SA, MLA based on corresponding cross sections at 1 mm longitudinal intervals calculated by pullback speed and frame rate with the three software packages.
STUDY 3: IMPACT OF THE NUMBER OF ANALYSED FRAMES ON ACCURACY
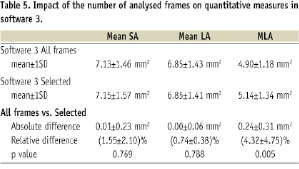
To assess the impact of the number of analysed frames within a given ROI on accuracy, mean SA, mean LA and MLA as calculated in selected frames at 1 mm longitudinal intervals were compared to data generated by continuous analysis of all frames in software 3.
Statistical analysis
Statistical analyses were performed using SPSS 15.0.0 (SPSS Inc., Chicago, IL, USA) for Windows (Microsoft Corporation, Redmond, WA, USA). Data are expressed as mean±SD or median and inter-quartile range, if appropriate. Intraobserver-inter-software agreement was determined by comparing measurements of each software using the Bland–Altman method15. The relative difference between measurements (absolute difference divided by the average) gives the bias; its standard deviation gives the random variation. The limits of agreement were calculated as mean bias±2SD. In addition, absolute data were analysed for correlation by regression analysis as necessary. A P value less than 0.05 (two-tailed students t-test) was considered statistically significant.
Results
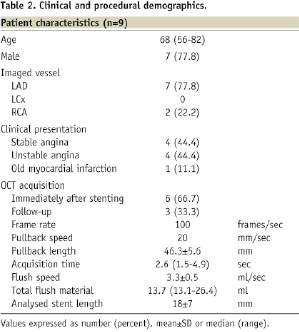
In nine patients treated with stents, a total of 18 pullbacks were performed without complications and without clinical signs of ischaemia. Clinical and procedural data were summarised in Table 2.
A total of 326 frames were included into the analysis. In 12 frames, the target cross section had to be replaced by the adjacent cross section. A total of six frames were excluded due to the presence of a major side branch.
Study 1: Inter-study variability
LUMEN AND STENT AREA
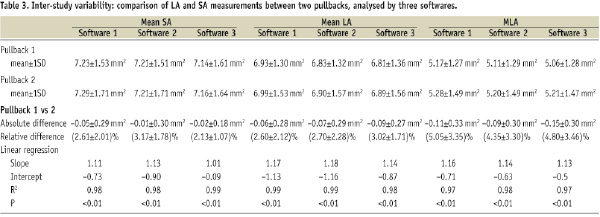
Quantitative OCT data for mean SA, mean LA and MLA are summarised in Table 3.
Bland–Altman plots for mean LA, mean SA and MLA are shown in Figure 3.
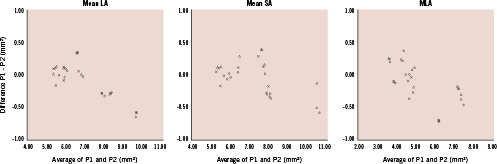
Figure 3. Bland-Altman plots for mean LA, mean SA and MLA measurements by two repetitive FD OCT pullbacks. The x-axis shows the mean area of two pullbacks and the y-axis shows the difference between the area by pullback 1 (P1) and 2 (P2). (open circle: software 1; triangle: software 2; cross: software 3) LA: lumen area; SA: stent area; MLA: minimum lumen area
The bias between two repetitive pullbacks was low. The main source of disagreement was a slight drift of calibration (Z-offset) occasionally caused by stretching of the fiberoptic core during pullback (Figure 4).
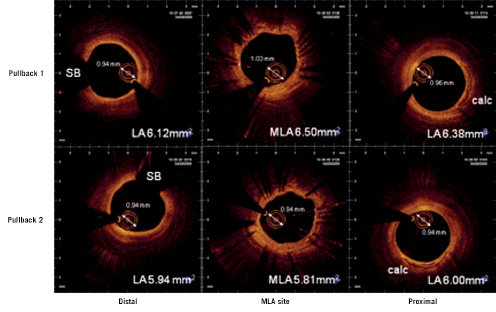
Figure 4. Corresponding cross sections in two repetitive pullbacks from distal (left) to proximal (right) illustrating the impact of minor changes in optical path length on morphometry as apparent in the diameter of the OCT catheter sheath. Due to differences in the optical pathway during imaging, the OCT catheter sheath diameter at the MLA site in pullback 1 appears slightly larger than the sheath diameter at the same site in pullback 2. Likewise, the lumen area appears slightly bigger. LA: lumen area; MLA: minimum lumen area; SB: side branch, calc: calcium
We observed calibration drift as fluctuations of the distance from the centre of the catheter to the outer border of the translucent sheath in the range of 0.06±0.07 mm or as inaccurate alignment of the outer border of the translucent sheath to the calibration markers (Figure 2B).
LENGTH OF THE STENTED SEGMENT
Bland – Altman plot for the measured length of the stented segment in two repetitive pullbacks are shown (Figure 5).
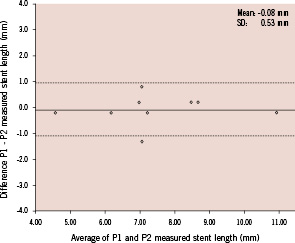
Figure 5. Bland-Altman plots for calculated ROI length. The x-axis shows the mean ROI length of two pullbacks and the y-axis shows the difference between the calculated ROI length by pullback 1 (P1) and 2 (P2). The dotted lines indicate the limits of agreement (bias±2SD). SD: standard deviation
The bias between two pullbacks was very low. The absolute difference of matched stent lengths between two pullbacks was low (–0.08±0.53 mm). Likewise, linear regression analysis showed high correlation between two pullbacks (Slope 0.990, Intercept 0.261, R2=0.99, p<0.001).
In five coronary arteries where single stents were implanted a comparison between the nominal stent lengths and the measured stent length in situ was performed, The nominal stent length in these cases was 17.4±3.8 mm and the actually measured stent length was 17.1±3.0 mm (relative difference 4.9±3.9%; R2=0.97).
Study 2: Inter-software variability
The absolute differences between software packages were low (Table 4).
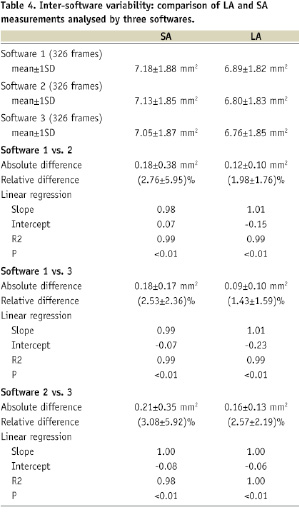
Linear regression analysis confirmed these observations and showed a good correlation between measurements (R2=0.98-1.00). Bland–Altman plots are shown in Figure 6.
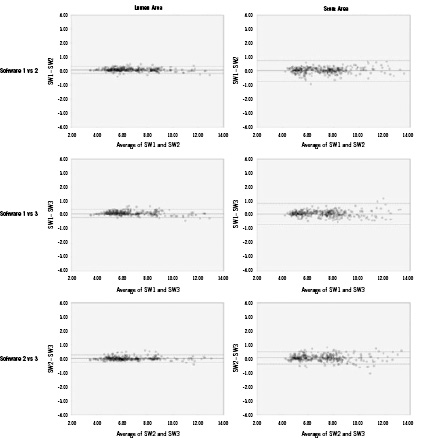
Figure 6. Bland-Altman plots for measurements by the three software (SW) packages, respectively. The x-axis shows the mean area measured by two software packages and the y-axis shows the difference between the areas by two packages as well. The dotted lines indicate the limits of agreement (bias±2SD). SD: standard deviation
The bias between the measurements was low. The main source of error for the delineation of SA was the incomplete visualisation of stent struts over the 360 degrees of vessel circumference. The leading cause for error in LA tracing were ambiguous lumen borders caused by dissections or mural thrombus.
Study 3: Impact of the number of analysed frames on accuracy
Bland–Altman plots for mean SA, mean LA and MLA are shown in Figure 7.
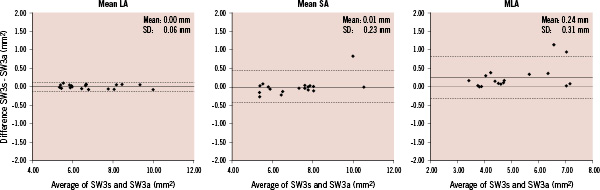
Figure 7. Bland-Altman plots for mean LA, SA and MLA by software (SW) 3. The x-axis shows the average of the areas from selected frames and all frames and the y-axis shows the difference between the areas from selected frames and all frames. SW3s: area from selected frames corresponding to SW1 and SW2; SW3a: area from all frames; LA: lumen area; SA: stent area; MLA: minimum lumen area
MLA analysed by software 3 using all frames was significantly smaller than that analysed using selected frames (Table 5).
Discussion
The present study demonstrates a remarkably high reproducibility for in vivo quantification of LA and SA using the new generation, FD OCT technology. The inter-study variability for LA and SA measurements in repetitive pullbacks was very low. Furthermore, we showed that this high reproducibility is robust when subjected to various core laboratory software solutions with different levels of automation for contour tracing.
Inter-study reproducibility
We demonstrated a remarkably high inter-study reproducibility of in vivo morphometry by FD OCT in stented coronary segments suggesting low variation or low impact of vasotonus on LA and SA dimensions in our patient cohort. Furthermore, our findings confirm previous reports that showed that the high contrast between the lumen and vessel wall in OCT imaging allows for precise tracing of these interfaces. In our study, the main source of disagreement between corresponding cross sections at the same spot within the coronary artery was an unclear demarcation of the endoluminal border due to dissections, mural thrombi or artefacts (incomplete blood removal, guidewire shadow and cardiac motion artefact), in accordance to previous reports for TD OCT analysis10. Precise guidelines for the screening of OCT image quality and consecutive contour tracings might reduce the influence of these sources of variability in the future.
Another source of error was occasionally a drift in calibration during the pullback, a phenomenon already known from conventional TD OCT imaging. The order of magnitude of this phenomenon in the clinical setting, however, was poorly described. In the present study, we observed a drift range from -0.01 to 0.13 mm even after Z-offset adjustment before image acquisition and re-adjustment before quantitative analysis whenever necessary.
In our limited sample size, there was a tendency for pronounced drift for the first pullback and when imaging the right coronary artery, possibly attributable to vessel tortuosity and potential non-uniform rotational distortion as described by Kawase et al16. Even though this observation is important to understand potential for future technology improvement, it is noteworthy to emphasise that the observed Z-offset drifts were minor, and their impact on absolute vessel dimensions is not relevant for clinical decision making. Automated Z-offset correction as available in the current commercial FD OCT system (Lightlab Imaging, Westford, MA, USA) without observer-dependent interference might alleviate this problem in the future.
Accuracy of in vivo, high speed data acquisition and fast automated pullback
The accuracy of automated catheter pullback has been studied in the past for intravascular ultrasound (IVUS)17,18. Tanaka et al18 evaluated four different automated pullback systems at a speed of 0.5 mm/sec. The difference between IVUS and the nominal stent length was 8.8±10.2%. In our study, the difference between FD-OCT and nominal stent length was 4.3±4.1%. A possible explanation for the lower difference could be the much faster data acquisition and pullback speed (20 mm/sec), minimising the impact of motion-induced artefacts causing non-uniform catheter withdrawal during cardiac cycle.
Possibility of computer-assisted analysis
We evaluated inter-software variability for quantitative analysis employing manual contour tracing, semi-automated lumen contour detection algorithms and selected cross sections in longitudinal intervals versus continuous analysis of all consecutive frames. As expected, MLA was significantly smaller when continuous analysis was employed. Clearly, the chance of missing the true MLA is increasing with the pitch between analysed cross sections. However, the differences in absolute dimensions are very small (Software 3 selected frames vs. all frames, 0.24±0.31 mm2) and mean LA and SA showed good correlations in absolute terms. The clinical significance and the potential analysis time to benefit balance have to be evaluated in the future. Off-line, manual tracing of vascular dimensions after coronary stenting is feasible for experienced observers, however it is time consuming. In the present study, semi-automated contour detection showed clear advantages in the analysis time and this effect was independent of the ROI length. (analysis time for a 20 mm ROI for software 1 and 2: 20-30 min, software 3: 5-10 min) The lumen contour of the longitudinal reconstruction of FD OCT images is smoother and shows less motion artefact than conventional TD OCT, potentially allowing for fast contour tracing in a long coronary segment using the longitudinal view as opposed to time consuming contour tracing in individual cross sections. Further computerised analysis strategies might include automatic stent strut detection as recently reported19.
Limitations
The study is obviously limited by the sample size. The role of potential confounders, such as differences in heart rate, blood pressure, vascular tonus and intravascular pressure during repetitive pullbacks can not be completely excluded. However, nitroglycerine was administered before every pullback and no changes in blood pressure and heart rate was recorded in our patients. The impact on motion artefacts during the heart cycle has not been assessed. During FD OCT data acquisition, no ECG trigger was used nor retrospective gating techniques were applied. Inter-software variability was analysed, but all quantitative measurements were analysed by a single, experienced observer. Thus intraobserver variability has not been addressed. Unfortunately, a DICOM OCT imaging standard is not available yet. Therefore we cannot exclude completely that OCT images were saved non-uniformly potentially influencing quantitative results. However, a DICOM OCT imaging standard is currently being developed to avoid this problem in the future.
Clinical implications
FD OCT represents a major improvement of OCT technology allowing for a widespread and user-friendly clinical application. The fast data acquisition and pullback speeds and the low required flush volumes enable widespread use and fast assessment of multiple plaques of long coronary segments or even the complete epicardial vasculature. Our study demonstrate that in vivo morphometry by FD OCT is highly reliable.
This might offer interesting possibilities for the clinical practice as IVUS studies suggested in the past that the acutely achieved minimal stent area is predictive for stent failure, both in bare metal as well as in drug-eluting stents20-24, while the relevance of malapposition and tissue prolapse is less clear. Future software development might allow to calculate on-line and in an automated fashion minimum lumen area as well as volumes for lumen, stent malapposition and tissue prolapse. It might improve patient outcome after drug-eluting stent implantation.
Conclusion
In vivo FD OCT shows excellent reproducibility in stented coronary segments. Computer-assisted morphometry is feasible and may be a valuable tool for future clinical application and clinical studies.