Abstract
Aims: To assess the inter- and intra- observer reproducibility for strut count, strut apposition and strut tissue coverage measurements with optical coherence tomography (OCT).
Methods and results: Ten drug-eluting stents (244 frames, 1712 struts) imaged with OCT nine months after implantation were analysed by two independent analysts. One of the analysts repeated the analysis of five stents (120 frames, 795 struts) one week later. Offline analysis was performed with the proprietary LightLab Imaging software. The number of struts was counted and lumen and stent area contours were traced. Tissue coverage thickness was measured at 360 degrees of vessel circumference and in front of every individual strut. The number of malapposed struts was determined. There was good agreement for strut number count (Kendall’s Tau-b 0.90 for inter- and 0.94 for intra- observer variability). The relative difference for lumen area, stent area and tissue coverage measurements was around 1%. There was complete inter- and intra- observer agreement for malapposed struts classification (4 out of 1708 struts, Kappa=1).
Conclusions: In a Corelab setting, the inter- and intra- observer reproducibility for strut count, strut apposition and strut tissue coverage measurements with OCT is excellent. This emphasises the value of OCT as a tool for the clinical long-term assessment of stents.
Abbreviations and acronyms
OCT: optical coherence tomography
DES: drug-eluting stent
ROI: region of interest
Introduction
Optical Coherence Tomography (OCT) is a light-based imaging modality that can provide in vivo high-resolution images of the coronary artery. This technique offers the possibility of identifying coronary stents and individual stent struts. Further, it is able to provide detailed information about struts apposition and tissue coverage. This is of special interest in drug-eluting stents (DES) in which the neointimal proliferation is inhibited to such an extent that it might not be visualised with conventional intravascular ultrasound (IVUS). Animal studies demonstrated good correlation between intracoronary OCT and pathology for neointimal thickness measurements. However, no criteria have been established for the quantitative analysis of stents on a per strut level with OCT. The objective of the present study was to assess the inter- and intra- observer reproducibility for strut count, strut apposition and strut tissue coverage measurements with OCT.
Methods
Study population
Ten stents (244 frames, 1712 struts) were analysed in eight asymptomatic patients undergoing an intracoronary OCT study nine months after sirolimus (Cypher Select, Cordis, Johnson & Johnson, Miami, FL, USA; 40%) or biolimus-eluting (Biomatrix III, Biosensors, Morges, Switserland; 60%) stent implantation. The target vessel was the LAD in 50%, the LCX in 20% and the RCA in the 30% of the cases.
OCT acquisition
The OCT acquisition was performed using a commercially available system for intracoronary imaging (LightLab Imaging Inc, Westford, MA, USA). The ImageWire (LightLab Imaging Inc, Westford, MA, USA) consists of an optical fibre core (125 µm) covered by a protective sheath with a maximum outer diameter of 0.019”. It was positioned distal to the region of interest using a double lumen catheter (Twin Pass catheter, Vascular Solutions Inc, Minneapolis, MN, USA) that had been previously placed in the artery over a conventional guidewire. The automated pullback was performed at 3 mm/s while the blood was removed by the continuous injection of iso-osmolar contrast (Iodixanol 370, Visipaque™, GE Health Care, Ireland) at 3 ml/s through the guiding catheter. The data was stored on CD for offline analysis.
OCT quantitative analysis
The analysis was performed with the proprietary LightLab software for off-line analysis (LightLab Imaging, Westford, MA, USA). The data was imported in the workstation using the LightLab database format.
Z-OFFSET CORRECTION
The Z-Offset was adjusted in the catheterisation laboratory before image acquisition while holding the ImageWire between two fingers. The Z-Offset is set properly when the ImageWire sheath is aligned with the yellow fiducials in the OCT image. During image acquisition, the optical fibres can stretch, especially at the beginning of the pullback. This may produce changes in the size of the Z-Offset along the pullback that can affect the accuracy of the measurements. Therefore, the Z-Offset was checked and modified if necessary in all the pullbacks before performing any measurement. To correct the Z-offset in saved pullbacks, a frame in which the ImageWire sheath was in direct contact with the vessel wall was selected. In this frame the Z-Offset was corrected aligning the ImageWire sheath and the vessel wall with the yellow fiducials. This value of the Z-Offset was applied at the beginning of the pullback. If needed, the Z-Offset was recalibrated again along the pullback. The corrected Z-Offset was the same for both analysts.
DEFINITION OF THE REGION OF INTEREST AND FRAME SELECTION
The region of interest (ROI) comprised the stented region and the reference segments. The ROI was systematically analysed in 1 mm longitudinal intervals throughout the pullback. The stented region was defined as the region comprised between the first and the last frame with circumferentially visible struts. The reference segments were defined as the 5 mm proximal and distal to the stent. Frames were excluded when more than 45° of the lumen border was not visible and when they presented severe artefacts such as incomplete blood clearance or non-uniform rotation distortion. When a frame was not analysable an alternative frame located within the two proximal or distal frames was selected for analysis. No overlapping stent segments were included in the analysis.
LUMEN ANALYSIS
The lumen contour was obtained with an automated detection algorithm available in the LightLab proprietary software and additional manual corrections were performed if necessary.
STENT ANALYSIS
Strut definitions
stent struts can show different appearances in OCT. In the present study structures were considered struts according to the following definitions.
a) Highly reflective surfaces (metal) with cast dorsal, radial shadows.
b) Highly reflective surfaces without dorsal shadowing.
c) Sector shaped shadows with sharp defined borders radial to the lumen.
Stent area
The stent contour was traced using a multiple point detection function. A support point for the contour was set in the middle of the endoluminal border of each stent strut. A semi-automated contour was then applied linking the points.
STRUTS COVERAGE DEFINITIONS AND MEASUREMENTS
The tissue coverage area was calculated as stent area minus lumen area. Assessment of tissue coverage thickness was performed using a new function of the software which provides 360 degrees measurements, at 1 degree incremental, around the circumference of a given cross sectional image, developed in collaboration by Cardialysis-Cleveland, Cardialysis-Rotterdam and Lightlab (Figure 1). This also permits the measurement of the tissue located in front of every strut that was defined as strut coverage. The mean, maximum and minimum tissue coverage per strut were calculated.
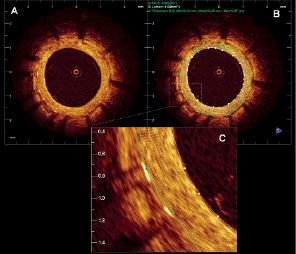
Figure 1. Tissue coverage measurement. A. Sirolimus eluting stent 9 months after stent implantation. B. The figure shows the lumen contour (white) and the stent contour (green). The tissue coverage area was calculated as stent area minus lumen area. The tissue coverage thickness was measured in 360 points (represented by the white chords). C. Magnification of 2 struts showing all the measurements (white chords) of the tissue coverage in front of every strut. For every strut the minimum, maximum and mean strut coverage was calculated.
MALAPPOSITION DEFINITIONS AND MEASUREMENTS
Malapposition was defined as separation of at least one stent strut from the vessel wall. To evaluate apposition by OCT, especially with DES, some considerations must be taken into account. Most DES are constituted by a metal body covered by a polymer. Since OCT can show only the endoluminal surface of the strut due to limited penetration through the metal, strut and polymer thickness must be considered in assessing apposition for each type of stent design. For the present study, a strut was considered malapposed if the distance from its endoluminal surface to the vessel wall was higher than the sum of the metal and polymer thickness (Figure 2).
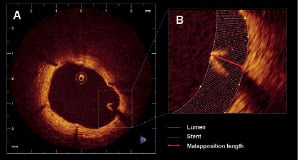
Figure 2. Malapposition. A. Example of a malapposed strut in a sirolimus eluting stent at 9 months follow up. B. Magnification of the malapposed strut. The yellow line represents the lumen contour and the white line corresponds to the stent contour. The distance from the endoluminal surface of the strut to the vessel wall (red arrow) was 440 µm (higher than the sum of the metal and polymer thickness for this type of stent).
Reproducibility design
The reproducibility for the struts count and the malapposition and tissue coverage thickness measurements were tested independently.
STRUT COUNT REPRODUCIBILITY
In order to assess the inter-observer variability for the struts count, two experienced observers analysed independently 100 cross sections and counted the number of struts in each one. To test the intra-observer variability one of the two observers repeated the analysis of 50 randomly selected cross sections one week later.
STRUT APPOSITION AND TISSUE COVERAGE REPRODUCIBILITY
Two experienced observers analysed independently 10 stents in order assess the inter-observer variability for the struts apposition and tissue coverage measurements. One of the observers repeated the analysis in five of the cases one week later to evaluate the intra-observer variability.
Statistical analysis
The agreement of the number of struts counted in the same frame was estimated by calculating the Kendall’s Tau-b rank correlation coefficient with its 95% confidence interval.
The inter and intra-observer reproducibility for lumen, stent and tissue coverage measurements were tested at three levels: per stent, per frame and per strut.
On a per stent level the mean and minimum lumen and stent area and the mean lumen and stent diameters were compared. The mean tissue coverage area and the mean, minimum and maximum tissue coverage thickness and strut coverage were also compared. The lumen, stent and tissue coverage volume were calculated by the Trapezoidal rule. In the proximal and distal reference, the mean luminal area, diameter and volume were compared.
On a per frame level, the luminal and stent areas and diameters were compared as well as the tissue coverage area and the mean, minimum and maximum tissue coverage thickness and strut coverage. In the frames corresponding to the proximal and distal edge, the mean luminal area and diameter were compared.
On a per strut level, the mean, minimum and maximum tissue coverage in front of every strut were compared.
The reproducibility was calculated by estimating the residual standard deviation in an ANOVA model. The true value is expected to be within 1.96 times the calculated reproducibility of the single measurement for 95% of the observations. In addition the agreement between both observations has been expressed in Bland-Altman plots. The Bland-Altman plot depicts the differences of each pair of observations versus their mean values with reference lines for the mean difference of all paired observations and its 95% confidence limits, the so-called limits of agreement.
The Kappa coefficient for the agreement between observers for struts classification as incompletely apposed was tested for being not equal to zero.
Results
A total of 244 frames and 1,712 struts were evaluated for the inter-observer reproducibility and 120 frames, 795 struts were evaluated for the intra-observer variability. The mean stent length and diameter of the analysed stents were 17.8 mm and 2.8 mm respectively.
Strut count reproducibility
INTEROBSERVER VARIABILITY
There was complete agreement in the number of struts between the two observers in 55% of the cross sections, difference of one strut in 31%, difference of two struts in 9% and difference of more than two struts in only 5% of the cross sections. The correlation between both observers was high, i.e. Kendall’s Tau-b was 0.90 (95% confidence interval 0.85-0.94).
INTRA-OBSERVER VARIABILITY
There was complete agreement in the number of struts in 72% of the cross sections, difference of one strut in 24% and difference of two struts in 4% of the cross sections. The correlation between both observations was very high, i.e. Kendall’s Tau-b was 0.94 (95% confidence interval 0.91-0.97).
Lumen, stent and tissue coverage measurements reproducibility
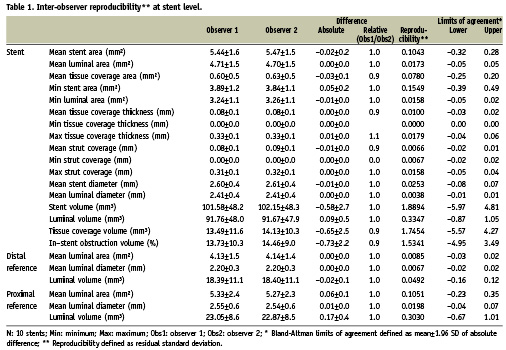
STENT LEVEL
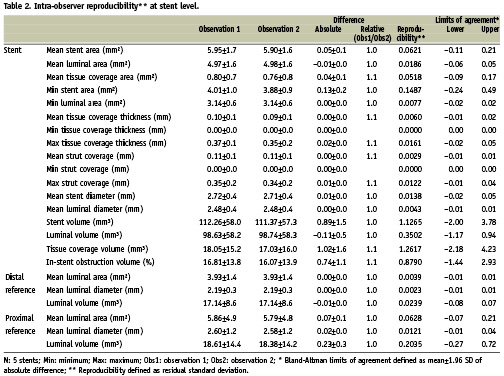
The results for the inter and intra-observer reproducibility at the stent level are summarised in Tables 1 and 2 respectively.
FRAME LEVEL
The results for the inter- and intra- observer reproducibility at the frame level are summarised in Tables 3 and 4 respectively. Figures 3 and 4 show the results for the lumen, stent and tissue coverage area and mean neointimal thickness for inter- and intra- observer reproducibility respectively.
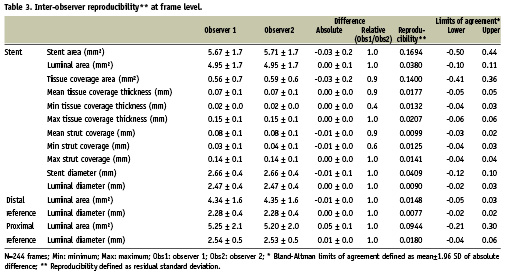
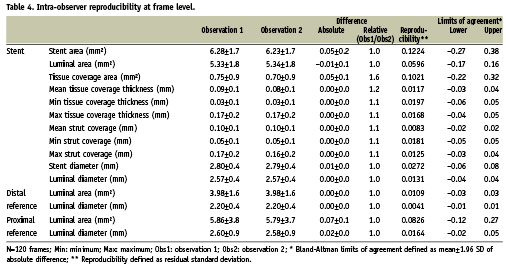
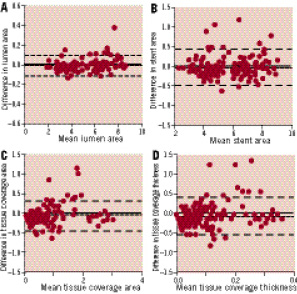
Figure 3. Inter-observer reproducibility. Bland-Altman plots for the inter-observer variability for mean lumen (A), stent (B) and tissue coverage area (C) and mean tissue coverage thickness (D).
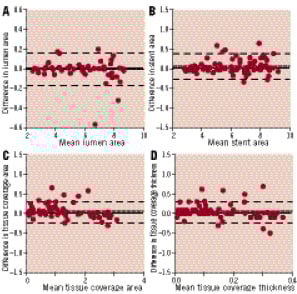
Figure 4. Intra-observer reproducibility. Bland-Altman plots for intra-observer variability for mean lumen (A), stent (B) and tissue coverage area (C) and mean tissue coverage thickness (D).
STRUT LEVEL
Tables 5 and 6 show the inter (A) and intra-observer (B) reproducibility for the measurements at the strut level. Figure 5 shows the variability for the mean strut coverage.
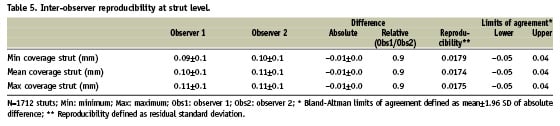
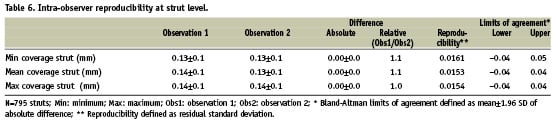
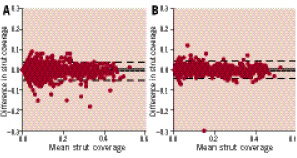
Figure 5. Strut coverage measurement reproducibility. Bland-Altman plots for the inter (A) and intra-observer (B) reproducibility for mean strut coverage measurements.
Malapposition classification reproducibility
The observers had complete agreement for the classification of malapposed struts (four out of 1,712 struts malapposed, Kappa coefficient 1). The intra-observer analysis show the same result (four out of 795 struts malapposed, Kappa coefficient 1).
Discussion
Due to its high resolution, OCT can be a very valuable tool for the evaluation of the acute and long-term impact of stent implantation. OCT offers the possibility to assess stent apposition in great detail and allows the visualisation and measurement of the tissue covering the struts, even if this consists of tiny layers as it is frequently observed in DES. As the use of OCT is increasing rapidly, standardisation of the methodology to measure and report stent apposition and tissue coverage is needed, as well as data about the reproducibility of these measurements. Our results show that the methodology described in the present study allows analysis of stents by experienced analysts in a highly reproducible way.
Stent struts can have different appearances by OCT. The most common appearance is a highly reflective surface with cast dorsal, radial shadow. However, very often only the shadow is observed (probably when the borders of the stent cells are imaged). In our study, shadows were considered struts only when they were sector shaped with sharp defined borders radial to the lumen and the presence of metal (high reflective surface) could be confirmed in the two contiguous distal or proximal frames. The reproducibility of struts count has not been previously reported. Our data suggests that the inter- and intra- observer variability for strut count is low when applying strict strut definitions. For the intra-observer variability, only in 4% of the cases the difference between the two observations was more than one single strut, while for the inter-observer in only 5% of the cases the difference was higher than two struts.
High accuracy and precision for diameters measurement in vitro using proprietary software from LightLab has been reported. Tanimoto et al showed a low inter-observer variability for lumen and stent area measurements with OCT using dedicated computer-assisted contour analysis. However, no specific study to assess the reproducibility of strut apposition and strut tissue coverage measurements by OCT has been reported.
Recently several OCT studies evaluating the struts apposition and tissue coverage in DES in humans at different time intervals using proprietary off-line software provided by LightLab Imaging have been published.
In most of these studies, the operator manually traced the stent and lumen area, to derive the tissue coverage area. Stent struts apposition and tissue coverage are usually individually measured at 1-mm intervals. However, the way of reporting the tissue coverage varies between studies. Some authors report just tissue coverage thickness without detailed methodology. Other studies report the minimum, maximum or average tissue coverage but the selection method, the number of measurements and calculations method was not specified. The methodology used in the present study provides 360 data points for tissue coverage thickness for each cross section. Further the mean, the minimum and the maximum tissue coverage is reported for each individual strut. The mean tissue coverage per strut is derived from all the measurements at equidistal intervals along the strut.
Prati et al reported high inter- and intra- observer reproducibility for neointima thickness measurements with OCT in carotid rabbit model (r 0.88 and 0.90 respectively). Another study in humans comparing tissue coverage between SES and BMS reported 6±8 µm and 8±8 µm intra- and inter- observer variability for the measurement of tissue coverage. However, the authors did not specify if the measurements correspond to mean, minimum or maximum tissue coverage, how many measurements were performed per strut or in which part of the strut measurements were taken. In the present study we observed absolute differences around 10 µm for the maximum and minimum strut coverage in repeated measurements. Those differences are in the limit of resolution of the technique. The absolute differences for tissue coverage area were 0.04±-0.1 mm and 0.03±0.1 mm for the intra- and inter- observer variability respectively. Similar results were found when comparing stent and lumen area. A very good reproducibility for lumen measurement was expected as the automatic contour detection was used and not modified by the analyst in the majority of cases. The differences found in the present study are smaller than the ones reported previously by Xie et al for area measurements with OCT (0.3±0.5 mm and 0.2±0.4 mm for the intra- and inter- observer variability respectively). There are no reports on the reproducibility of lumen, stent and tissue coverage volumes derived from OCT. We found absolute differences around 1 mm³ for the intra and 0.65 mm³ for the interobserver variability for tissue coverage volume. Similar values (0.89 and 0.58 mm³ for the intra and interobserver respectively) were obtained for the stent volume. As expected, the lumen volume variability was even lower (around 0.10 mm³) as it was derived from automatic contour detection.
The higher resolution of OCT makes this technique superior to IVUS for the detection and measurement of tissue covering the stent struts. An IVUS study reported 62% of inter-observer agreement for the presence of neointimal tissue with discrepancy between observers in very thin neointimal layers and when the neointimal area was <2 mm . In the present study evaluating DES, a very good agreement was found between observers for the measurement of tissue coverage, even when the mean tissue coverage area was less than 1 mm. An increased variability in the classification of individual struts was observed when the tissue coverage was below 50 µm. This may be related to the image resolution, but also to software limitations. Automatic algorithms for detecting stent coverage from OCT datasets are under development. This could help eliminating the remaining small observer-related variability found in our study.
Kubo et al reported a good intra- and inter- observer agreement (Kappa=0.90 and 0.75 respectively) for malapposed struts classification in sirolimus eluting stents. Those results are in line with our study in which the agreement between observers for malapposed struts was excellent (kappa=1), even when applying customised cut-off points for each stent. However, our results are limited by the small number of malapposed struts found in our population.
Clinical implications
The evaluation of strut apposition is essential in the evaluation of new stents designs as IVUS data have suggested a possible relation between apposition and the risk of stent thrombosis in DES. However, interpretation of malapposition as assessed by OCT requires caution. Due to the high image resolution, malapposition of stent struts is a relatively common finding by OCT, but its clinical implications remain poorly understood. Incomplete endothelial struts coverage has been identified in pathology as the most powerful histological predictor of stent thrombosis. Pathological data in humans suggest that neointimal coverage of stent struts could be used as a surrogate marker of endothelialisation due to the good correlation between strut coverage and endothelialisation. Animal data suggest good correlation between mean neointimal thickness measured by histology and OCT. The present study confirms that the tissue covering the strut can be measured with high reproducibility. However, the clinical relevance of uncovered struts as detected by OCT is not clear as some studies have reported presence of uncovered struts at follow-up not associated to clinical events. Further investigation and studies with longer follow-up are needed in this field.
Although OCT has proved to be a highly informative imaging technique in assessing stents, standardisation of the analysis of such images is not yet in place. In addition, OCT is a rapidly evolving imaging technology and there is lack of large stent trials with long-term clinical follow-up linking OCT findings and clinical events. Thereby this methodology of analysis is prone to changes in the future in order to adjust to the new clinical needs.
Conclusions
In a Corelab setting, the inter- and intra- observer reproducibility for strut count, strut apposition and strut tissue coverage measurements with OCT is excellent. This finding emphasises the value of OCT as a tool for the clinical long-term assessment of stents.