Introduction
The assessment of arterial wall healing following DES implantation with the use of optical coherence tomography (OCT) has become a standard in the systematic evaluation of coronary stents. As a result, the number of scientific manuscripts on stents and OCT has proliferated, and stent characteristics including strut coverage and malapposition are reported based on their association with stent thrombosis in observational studies1. In this issue of EuroIntervention, Kim and colleagues2 present the results of a randomised comparison between new-generation biodegradable biolimus-eluting stents (BES; Nobori®; Terumo Corp., Tokyo, Japan) and early-generation sirolimus-eluting stents (SES; Cypher®; Cordis, Johnson & Johnson, Warren, NJ, USA). In a cohort comprising 120 patients with predominantly stable coronary artery disease, uncovered struts were observed in 15.9% of BES and 25% of SES-treated patients (p=0.003). Consistent with improved strut coverage, a thicker neointimal layer in BES (52 µm [41.9-74.9]) compared with SES-treated lesions (42 µm [30.6-56.0, p=0.005]) was observed. A contour plot analysis displaying the spatial distribution of uncovered stent struts showed a more diffuse pattern of uncovered struts following SES implantation. Malapposed stent struts were numerically lower in BES (0.5%) than in SES-treated patients (1.0%, p=0.21).
In synthesis, the study suggests a superior healing profile of the biodegradable polymer BES as compared to the durable polymer SES. These results are largely confirmatory of previous OCT studies assessing stent-vessel wall interactions at later time points3. Owing to the relatively large number of stents and the random allocation of stent type, these data contribute importantly to the available literature on this topic. The assessment of strut coverage prior to full biodegradation of the polymer is somewhat debatable as any benefit associated with biodegradable polymers may occur weeks to months after completion of the biodegradation process.
Compared to previous OCT reports, the present study observed a higher frequency of uncovered stent struts in SES-treated lesions (approximately 40-50% higher)4-6, while reference studies for BES at six months are lacking. This discrepancy raises two important issues related to OCT studies: first, the assessment of strut coverage is delicate with considerable intra- and inter-observer variability7. Only trained image analysts with a proven reproducibility record should be involved in strut coverage analyses using appropriate definitions. Second, the characteristics of OCT datasets require careful consideration when analysing and interpreting OCT publications8.
Characteristics of OCT datasets
Data from intravascular OCT are inherently hierarchical. The lowest sampling units are struts, nested within lesions, which are in turn nested within patients. Clinically, it is of interest to predict how lesions will respond to the implantation of a particular stent type, while the response of an individual strut is of subordinate importance. Intuitively one might assume that strut characteristics correlate within lesion and patient. This correlation needs to be accounted for when performing statistical analyses. Depending on the model applied, results and conclusions may change substantially and this also sheds light on the findings in the present study.
Differences in analytical approach
To illustrate differences among a variety of analytical approaches, we used an existing OCT dataset9 on malapposition, which is shown in Figure 1. Percentage estimators, confidence intervals (CIs), and p-values were obtained by the following five methods, which have all been used for OCT analyses in the literature. Analyses were performed with the computing environment R and packages ime4 and geepack10-12.
CRUDE ANALYSIS
The percentage of all pooled struts is reported; CI and p-value ignore that struts are nested within lesions. This method falsely leads to small p-values and narrow CIs which ignores that struts from the same lesion are not independent.
GENERALISED ESTIMATING EQUATION MODEL (GEE)
Percentage estimators, CIs and p-values are obtained from a GEE model. The study of Kim et al used this approach to compute p-values. These percentage estimators are closely related to the percentages from the crude analysis but the GEE model takes into account that struts from the same lesion are correlated and gives valid CIs and p-values.13-15
NON-PARAMETRIC ANALYSIS OF AGGREGATED DATA
The lesion-level percentage is first obtained separately for each lesion and then the median of these percentages is reported as the overall percentage estimator. No CIs are computed. P-values are obtained from the Wilcoxon rank-sum test because it is a rank-based method which is valid for asymmetrical distributions as are present here (black dots in Figure 1)15-17.
MULTILEVEL MODEL
Percentage estimators, CIs and p-values are obtained from a multilevel logistic regression model, which implicitly derives lesion-specific percentages and provides an overall percentage estimator that is centred on these lesion-specific percentages. Models are estimated with the maximum likelihood approach18.
BAYESIAN MULTILEVEL MODEL
The multilevel logistic regression model as described above is estimated with a Bayesian approach based on uninformative priors3,9.
The results obtained by the individual methods are presented in Table 1 and Figure 1.
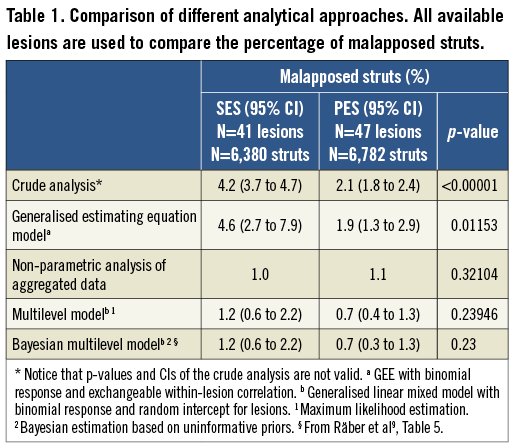
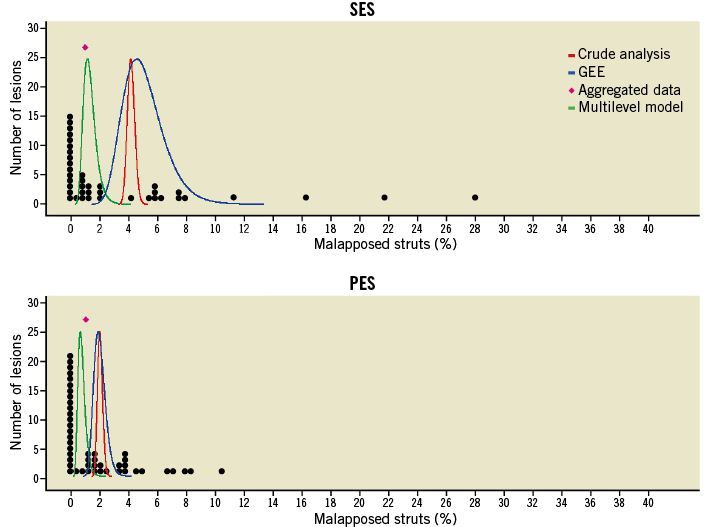
Figure 1. Representation of the dataset. Each black dot represents the lesion-level percentage of malapposed struts. Results of the crude analysis, GEE, and multilevel model are represented as confidence curves, which summarise CIs for several confidence levels; the peaks of the curves represent the percentage estimators given in Table 1. For the aggregated data analysis, only the median is indicated (pink diamond).
Non-parametric analysis of aggregated data
The interpretation of the median is simple and lesion-oriented: half of the lesions have a percentage above and the other half below the reported median. However, when data contain a large proportion of lesions with a value of 0%, confidence intervals cannot be computed.
Multilevel model
The multilevel model gives percentage estimators consistent with the median from the aggregated analysis method (Figure 1, Table 1), which is to be expected because it implicitly models the lesion-level percentages. It can be interpreted in a lesion-oriented manner. Estimation via frequentist or Bayesian methods leads to almost exactly the same results.
Crude analysis and GEE
The crude and the GEE-based methods estimate the strut-level response. It has been shown that their percentage estimator is always closer to 50% compared to a multilevel model19,20. In our example, the crude and the GEE-based percentages are consistent with each other but clearly higher than percentages from the aggregated and multilevel analysis methods (Figure 1, Table 1). As expected, the crude analysis method leads to p-values that are too small and CIs that are too narrow.
P-values
Multilevel models and GEEs account for the non-independence of struts within lesions. However, their p-values lead to different conclusions: GEE-based results indicate that malapposition is significantly higher in SES-implanted lesions; multilevel models indicate that there is no significant difference (Table 1). The conclusion of the multilevel models is correct but only as a statement regarding the majority of lesions; however, it does not capture the response of a few lesions with the highest level of malapposition. These lesions must be handled separately as done for example in Räber et al9. The GEE results are mainly driven by a few lesions. If the four lesions with highest malapposition are excluded, the GEE-based p-value rises from 0.01 to 0.63. Without a graphical representation of the data (Figure 1), the GEE results are misleading because the reader cannot understand that the significance is due to a few lesions only.
None of the methods captures the full distribution pattern of malapposition. A graphical representation where the clinically relevant units (here: lesions) are plotted9,18 should ideally be reported to allow a fully informed comparison of the groups. The multilevel and aggregated analysis methods are both correct if the percentage estimators are to be interpreted at lesion level. The GEE is a correct approach if the percentage estimators are to be interpreted at strut level, a scenario of little clinical relevance. Of note, the GEE-based p-value is adversely affected by lesion-level outliers (Figure 1, SES group). Percentage estimators from crude and GEE methods cannot be compared with percentage estimators from aggregated and multilevel methods. P-values and CIs of the crude method should not be used because they are not valid.
Conclusions
As for the study by Kim and colleagues, the reported percentage considerably overestimates the lesion-level percentage of uncovered struts. P-values were assessed by a GEE and also by multilevel logistic regression (OnlineTable1) and resulted in p-values consistently above or below the nominal significance level. Therefore, a scenario where p-values were adversely affected by a few lesions can be ruled out. However, a superior healing profile of BES as compared to SES based on a significant difference between treatment groups remains, and the conclusion on a superior healing response with the biodegradable stent platform appears valid.
The comparison of OCT data among different studies is limited not only by differences in patient population, follow-up duration and OCT interpretation, but also importantly by the statistical analysis. The fact that all five aforementioned methods have been used in the past represents a serious limitation for comparison across articles or meta-analyses of OCT-related studies. Although we suggest that multilevel approaches appear ideal for clinical OCT studies, the use of alternative methods may be appropriate.
Conflict of interest statement
The authors have no conflicts of interest to declare.