Abstract
Aims: To describe different patterns of stent strut apposition, as visualised with optical coherence tomography.
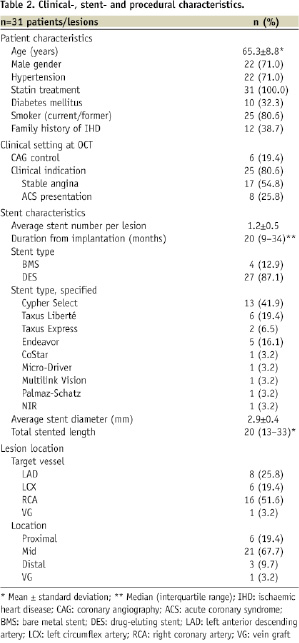
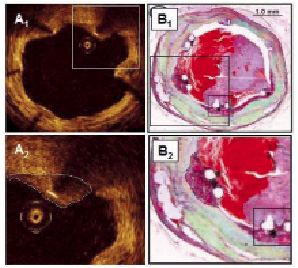
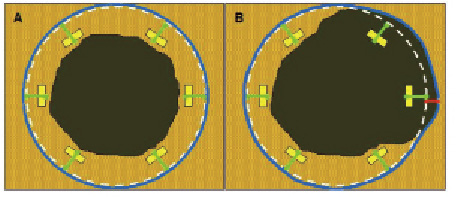
Methods and results: Strut thicknesses were reconstructed according to the manufacturers’ specifications. The stent area (SA) was measured by connecting the reconstructed abluminal surfaces of struts with a trace line, and the vessel wall area (VWA) was estimated from the abluminal strut surfaces, as well as from the lumen border, in cases of struts that were separated from the vessel wall by flush. Strut apposition was evaluated by comparing the SA- and VWA traces. We observed four patterns of strut apposition. Based on these, stent struts could be classified as: (I) apposed struts, (II) struts overlying the ostium of a side branch, (III) malapposed struts that were clearly separated from the vessel wall by flush, and (IV) pseudoapposed struts that were not separated from the vessel wall by visual estimate, but were malapposed in the sense that SA Conclusions: For a detailed analysis of strut apposition with OCT, we reconstructed strut thicknesses and estimated stent- and vessel wall areas. With this method, we found four types of strut apposition, where pseudoapposed struts constitute a type of struts not previously described. The clinical importance of pseudoapposed struts remains to be settled. Introduction The importance of refining stent implantation in coronary artery lesions was previously demonstrated using intravascular ultrasound (IVUS).1 Accordingly, it became customary to deploy coronary stents at high pressure, since this improves stent expansion and apposition to the vessel wall.2 Although IVUS- and histopathological reports have related stent strut malapposition to late thrombosis of drug-eluting stents (DES)3,4, other studies have shown that malapposition may occur in up to 10% of DES without any clinical consequence.5,6 The importance of strut malapposition therefore remains controversial. Optical coherence tomography (OCT) is an infrared light-based imaging technique with a resolution of 10 µm, which is ten times higher than that of IVUS.7 As a sensitive tool, OCT detects strut malapposition and thin strut coverages more often than IVUS.8 Consequently, intracoronary OCT examination of stented areas might contribute to evaluate the clinical importance of strut malapposition. At present, there is no consensus regarding the classification of strut apposition as visualised with OCT. It was recently suggested that strut apposition on OCT may be classified into three grades; embedded, protruding, and malapposed9, where embedded and protruding struts are different degrees of apposed struts. In our work with OCT, we have encountered various morphological configurations of the stent/vessel wall complex that seem to be related to strut apposition. The objectives of this study were therefore (1) to describe the different morphological appearances of the stent/vessel wall complex at the frame level, and (2) to analyse whether these, by means of various quantitative parameters, are related to apposition at the strut level. Methods Patient population The study included data from patients with coronary stents implanted at least two months prior to the OCT examinations. These were performed either as part of an elective diagnostic- or routine control angiography, or in connection with an angiography performed subacutely as part of the diagnostic program in acute coronary syndrome (ACS). Only examinations with a good image quality, defined as an adequate displacement of blood and visualisation of >70% of the vessel wall circumference, were included. OCT image acquisition The M2 OCT system (LightLab Imaging Inc., Westford, MA, USA) used in this study has been described previously.10 We used occlusive or non-occlusive techniques to obtain blood displacement during OCT imaging. In brief, after crossing the stent with an angioplasty wire, an over-the-wire OCT occlusion balloon catheter (Helios™) or a Renegade™ catheter (Boston Scientific, Natick, MA, USA) was advanced distal to the stented segment, and the coronary wire was exchanged with the OCT image wire (ImageWire™). For the occlusive method, the OCT catheter was retracted proximally to the stented segment and the balloon was inflated at 0.5-0.7 atmospheres. For the non-occlusive method, the Renegade catheter was retracted into the guiding catheter. During image acquisition, coronary blood was displaced by manual infusion of saline or Visipaque (Iodixanol 320, GE Healthcare, Ireland) for the occlusive and non-occlusive set-up, respectively. Although the non-occlusive technique may imply a slightly higher intracoronary pressure during image acquisition compared to the occlusive technique, the potential change in areas of relevance for this study, is likely to be proportional for the different areas. We therefore assumed it unlikely that the choice of technique would influence strut apposition. Cross-sectional images were acquired at 15.4 frames/s, and we used an automated pullback system at 1.0 or 2.0 mm/s. Image acquisition was performed for a maximum of 40 seconds under careful monitoring of heart rhythm and haemodynamics. OCT image analysis Frames within the stented segment were examined at 1 mm intervals to identify recurring morphological patterns in the stent/vessel wall complex at the frame level. Because OCT visualises only the endoluminal surfaces of struts, strut thicknesses are underestimated by visual estimate.11 To compensate for this, we reconstructed all strut thicknesses according to the manufacturers’ specifications (Table 1) before evaluating strut apposition (Figure 1). Figure 1. Schematic drawing of the methodology used for the OCT analysis. Yellow boxes represent the endoluminal surfaces of struts, as visualised by OCT. Actual strut thicknesses were reconstructed by drawing a trace line for every strut from the strongest endoluminal surface reflection a certain distance (exaggerated in the figure) in the abluminal direction (green traces), as specified by the stent manufacturer. White dotted lines represent the stent area (SA). Blue traces represent the best possible estimation of the vessel wall area (VWA), estimated from the SA in cases of apposed struts (panel A), or from the lumen contour in cases of clearly malapposed struts (panel B). For the purpose of clear visualisation, the VWA in panel A is depicted slightly outside the SA. Comparison of the abluminal strut surfaces with the VWA trace for every strut yields that struts are apposed in panel A, and malapposed at 1 and 3 o’clock in panel B. The interspace distance (red trace) for the malapposed struts was measured from the abluminal strut surface to the VWA trace. Aspects influencing the appearance of struts on OCT, and thus the reconstruction of strut thicknesses, are considered in the online appendix (www.eurointervention.org). The stent area (SA) was measured planimetrically by fitting a smooth curve through the trace points of the reconstructed abluminal strut surfaces (Figure 1A). If the lumen contour on visual estimation was located inside the stent area, the stent at this cross-sectional point was considered apposed. Thus, the best possible estimation of the vessel wall area (VWA) in contact with the stent, then equalled the SA. In cases of stent malapposition, the VWA was traced along points in the lumen contour located outside the stent contour (Figure 1B). Apposition to the vessel wall was evaluated for every strut by comparing the location of the reconstructed abluminal strut surface with the VWA trace line (Figure 1). A strut was defined as apposed if the abluminal strut surface was located outside the lumen contour and was tangent to the estimated VWA trace. In cases of malapposed struts, the distance between the abluminal strut surface and the VWA trace, interspace distance (ISD), was additionally measured (Figure 1B). Statistical analysis Statistical analysis was performed with SAS statistical package, version 9.2 (SAS Institute Inc., Cary, NC, USA), and the R statistical environment, version 2.10.0. Continuous data Given the hierarchical structure of the data (stent struts nested within frames nested within lesions), a multilevel model was applied to compare the interspace distance between relevant apposition classes, with variance components for “struts within frames” and “frames within lesions”, using only strut apposition as a fixed factor. In order to have a good fit of the normal distribution, analysis was performed on a logarithmic scale. Intra-observer reproducibility of the classification of strut apposition was assessed by calculating the Kappa coefficient. A two-tailed p-value of ≤0.05 was considered statistically significant for all analyses. Results Clinical-, stent- and procedural characteristics at OCT examination Thirty-one patients with 31 lesions (37 stents) were included in the study. Clinical-, stent-, and procedural characteristics are shown in Table 2. The majority (87.1%) of stents were DES, and the median duration from implantation was 20 months (range 2-125 months). Eight patients had acute coronary syndrome (ACS) at the time of OCT examination, while the remaining 23 patients were examined in a stable clinical setting. The non-occlusive technique was used in 13 patients, of which one developed ventricular fibrillation during image acquisition of a stent in the right coronary artery. Sinus rhythm was immediately restored after defibrillation. Otherwise there were no haemodynamic instabilities, arrhythmias, coronary dissections, subsequent myocardial infarctions, or deaths with any of the two methods used. Qualitative assessment of the stent/vessel wall morphology A total of 596 frames were analysed. We identified four morphological patterns of the stent/vessel wall complex, each of which were accompanied by distinct features of strut apposition. Figure 2A shows a frame where the lumen contour is regular, circular, and located inside the SA. The VWA is estimated as VWA=SA, and we conclude that every single strut is well apposed to the vessel wall. This pattern of the stent/vessel wall complex was seen in 506 frames from all 31 lesions. Figure 2. Morphological patterns of the stent/vessel wall complex. Green lines depict the reconstructed strut thicknesses, blue lines represent the vessel wall area (VWA) trace, and the white lines the stent area (SA) trace (A-D). In panels A2 and B2, the white lines are hidden behind the blue lines. Panel A shows apposed struts. In panel B, struts are overlying the ostium of a side branch at 4 to 6 o’clock. Panel C shows malapposed struts at 10 o’clock. In panel D, lumen is flower-shaped and struts are pseudoapposed at 6 to 3 o’clock. The regions in the vicinity of struts at 6 and 9 o’clock have a lower signal intensity than the rest of the vessel wall. Stent types and time points from implantation are: A: Cypher (41 months), B: Cypher (22 months), C and D: Cypher (15 months). As an example of the second morphological pattern, Figure 2B shows three struts where the abluminal strut surfaces are not in touch with the vessel wall. Analysis of consecutive frames shows that the vessel wall “opens up” and “closes” (not shown) again behind these struts, indicating that struts are overlying the ostium of a side branch. This pattern was seen in 15 frames from 10 lesions. In Figure 2C1 we see two struts that are clearly separated from the vessel wall by lumen extending behind them. Analysis of consecutive frames showed no signs suggestive of a side branch (not shown). Estimation of SA and VWA shows that VWA exceeds SA, and that abluminal strut surfaces at 10 o’clock are located inside the VWA trace (Figure 2C2), indicating that struts are malapposed. This pattern was present focally in seven lesions (23 frames), predominantly at the edges, but also at the mid portions of the stents. The stents in question included an Endeavor stent (12 months after implantation), one Taxus Express stent (40 months after implantation), one NIR stent (100 months after implantation), and four Cypher stents (12, 15, 20 and 29 months after implantation). In the last type of stent/vessel wall configuration, lumen contour is irregular and flower-shaped (Figure 2D). On first impression, struts look apposed to the vessel wall. After reconstruction of strut thicknesses and estimation of SA it appears that the lumen contour at several points exceeds the SA trace. Planimetrical estimation of the VWA from these outer points shows that SA is smaller than VWA, suggesting that the stent in this frame is malapposed although struts are not clearly separated from the vessel wall. Comparison of the location of the abluminal strut surfaces with the VWA trace suggests the presence of malapposed struts from 6 to 3 o’clock. Further, the regions in immediate approximation of these types of struts often displayed a lower signal brightness than the rest of the vessel wall (Figures 2D and 3A). The pattern where the VWA exceeds the SA, but where struts are not clearly separated from the vessel wall, was present to varying extents in 89 frames from 11 lesions, predominantly at the mid portions of the stents. The stents involved, and the time points from implantation were: Endeavor (three and 12 months), Taxus Express (40 and 51 months), Cypher (12, 15, 20, 29 and 41 months), Taxus Liberté (21 months), and NIR (100 months). Based on these four patterns of stent/vessel wall morphology, strut apposition can be divided in four classes: (I) apposed struts, in frames where SA=VWA; (II) struts overlying the ostium of a side branch (SA=VWA); (III) malapposed struts, that are clearly separated from the vessel wall where SA Quantitative assessment of strut apposition in relation to vessel wall and stent parameters A total of 5,966 struts were analysed and classified according to the definition above. 5,592 struts were apposed, 20 were overlying the ostium of a side branch, 52 were malapposed, and 302 were pseudoapposed. At the strut level, the interspace distance was 2.85 times higher for malapposed- compared to pseudoapposed struts (95% confidence limits [CI]: 2.29–3.56, p<0.0001), with a (geometrical) mean [95%CI] ISD of 101.1 µm [80.2–127.5] and 288.4 µm [213.4–389.9] for pseudo- and malapposed struts, respectively. The overall intra-observer agreement in classification of strut apposition was very good (Kappa coefficient [95% CI]=0.94 [0.92–0.96]). Further, the absolute difference in ISD between two observations by the same observer was 0 µm, within ±10 µm and ±20 µm for 17%, 44% and 60% of paired observations, respectively. The clinical importance of mal- and pseudoapposed struts In total, mal- and pseudoapposed struts were present in 35% of patients (11 out of 31). Mal- and pseudoapposed struts were found in bare metal stents as well as DES, and were often present together in the same lesions (seven out of 11 lesions with pseudo- and/or malapposed struts). Patients with ACS had more frequently mal- and pseudoapposed struts than patients examined in a stable clinical setting (fraction [95% CI]: 75% [35–97] vs. 22% [7–44], respectively [p=0.012]). Discussion The main finding of the present study is the identification with OCT of a type of stent strut apposition not previously described. These struts were found in frames where the stent/vessel wall complex was irregular, tending to have a flower-shaped appearance. Estimation of SA and VWA suggested they were malapposed, although not clearly separated from the vessel wall. Further, the region adjacent to these struts often displayed a lower signal brightness than the rest of the vessel wall. We propose that this category of struts be classified as “pseudoapposed” – a designation that refers to their lack of apparent separation from the vessel wall, as well as their malapposed appearance by closer examination. Since the detection of pseudoapposed struts is based on a methodology that estimates the location of the vessel wall, we find it relevant to comment on this methodology and how it relates to current approaches. Reconstruction of strut thicknesses and estimation of stent and vessel wall areas The underestimation of strut thicknesses on OCT may be addressed in different ways. One approach is to measure the distance from the endoluminal strut surface to the visible lumen- or vessel wall contour, and compare it with the actual strut thickness.9,12 We addressed this issue by reconstructing the actual strut thickness for every strut, which allowed us to locate the abluminal surfaces of struts, and use them for estimation of other parameters. Compared to the method used by Tanigawa et al, our approach does not distinguish between apposed struts that are “protruding” from- and apposed struts that are “embedded” into the vessel wall. Importantly, a consistent use of this grading, requires a clear definition of the reference structure that is being referred to, which in turn requires consideration of the time point at which OCT is performed and the presence or not of a strut coverage. In the present study, we assumed apposed struts to be of the protruding type, in order not to overestimate apposition. In this way, it is unlikely that a protruding strut which is covered, will be mixed up with a pseudoapposed strut surrounded by material. With other methodologies, the stent area is assessed from the leading endoluminal strut surface. We chose to estimate the SA from the reconstructed abluminal surfaces of struts because strut apposition refers to a contact between the vessel wall and the strut surface orienting towards it. In this way, the abluminal strut surfaces were used to estimate the dimensions of the vessel wall in contact with the stent (in cases of apposed struts), and in combination with the lumen contour, the vessel wall that was not in contact with the stent (in cases of malapposed struts), expressed as the VWA. Since the detection of pseudoapposed struts is dependent on the estimation of the abluminal SA and the VWA, these struts cannot be identified with the current approaches, because they do not estimate a parameter that is equivalent to the VWA used in this study. Until the importance of pseudoapposed struts is clarified, we find it relevant to reconstruct strut thicknesses when evaluating strut apposition, particularly in frames with an irregular lumen contour. It should be emphasised that the VWA as we have estimated it with OCT, is different from that measured with IVUS at stent implantation and generally referred to as the “external elastic membrane (EEM) area”. The EEM area refers to the border between the media and adventitia, and is used for the study of vessel remodeling behind the stent.13 Due to a limited tissue penetration, OCT is rarely able to visualise the EEM when the vessel is significantly diseased. What the VWA with OCT actually represents depends on the strut apposition at stent implantation, and the occurrence or not of late vessel remodelling and stent recoil. Due to the lack of post-implantation OCT, this was not possible to evaluate in our study. Nevertheless, as with IVUS, serial estimation of the SA and the VWA with OCT may allow us to monitor changes in the stent and vessel wall over time, including the luminal part of vessel remodelling and stent recoil. Strut malapposition with different imaging modalities and potential explanation of pseudoapposed struts With IVUS, strut malapposition, also referred to as incomplete stent apposition, has been defined as a lack of contact between stent struts and the underlying vessel wall not overlying a side branch, with blood speckle between struts and the vessel wall.13,14 With other OCT approaches, as well as with the one described here, struts were considered malapposed when the distance from its endoluminal surface to the vessel wall was greater than the actual thickness of the strut, indirectly including a separation of struts from the vessel wall by flush. Although no clear histopathological criteria have been defined for strut malapposition, histological images reveal that struts can be separated from the original vessel wall by material such as fibrin. In these cases the authors conclude that struts are malapposed.4,15 Considering this, it is interesting to speculate whether these struts would have appeared malapposed or apposed, had they been examined with IVUS or OCT in vivo; and inversely, whether there is a risk that some struts on IVUS and OCT visualised in vivo can be classified as apposed, although they are in reality malapposed. Although difficult to objectify, analysis of tissue texture is a novel and interesting aspect in the evaluation of coronary stents.16,17 In the present study, we noticed that the structures in the vicinity of pseudoapposed struts often displayed a lower signal brightness than the rest of the vessel wall (Figures 2D and 3A). Considering that the variation in signal intensity on OCT is related to variations in backscatter- and attenuation coefficients between tissue components18, the differences in signal brightness might indicate that the regions containing these struts are composed of various materials. On previously published histology images, it is not only evident that struts can be separated from the vessel wall by fibrin, but also that these fibrin deposits have a morphological shape that resembles that of the low-signal areas on OCT (Figure 3).4,15 Figure 3. Area of low signal brightness around a strut on OCT morphologically resembling fibrin deposition from a histology image of late stent thrombosis. Panel A shows an OCT image from a Cypher stent, 12 months after implantation. The pseudoapposed strut at one o’clock (estimated SA and VWA not shown) is separated from the vessel wall by material that has a lower signal brightness than the rest of the vessel wall. Panel B shows a histology section from a Cypher stent with thrombosis 24 months after implantation (stained with Movat’s pentachrome). Struts at 6 and 8 o’clock are separated from the vessel wall by fibrin. In panels A2 and B2, the morphological shapes of the low-signal area by OCT and fibrin deposit by histology, respectively, are marked. (B. from Finn et al; Circulation 2007. Reproduced with permission from Wolters Kluwer Health.) Moreover, some of these histological cross-sections exhibit a “flower-shaped” appearance of the lumen contour, reminding of the one observed with OCT in this study (Figure 4A1 and 4B1). Figure 4. Two types of “flower configuration” in OCT images and histology sections. OCT images in panels A1 (Cypher, 15 months) and A2 (Cypher, 15 months) are potentially corresponding with histology sections in panels B1 (Cypher, 24 months) and B2 (MultiLink, 4 weeks, rabbit artery, stained with toluidine blue). Yellow circles represent struts. In panels A1 and B1, the lumen contours are traced with a white and black line, respectively. In panels A2 and B2, the boundaries of the original vessel walls to which struts are apposed, are traced with a white and red line, respectively. (Panel B1 from Finn et al; Circulation 2007, and B2 from Carlier et al; Circulation 2003. Reproduced with permission from Wolters Kluwer Health.) Considering the proposed link between persistent fibrin deposition around struts and late stent thrombosis, it would be remarkable if OCT could visualise this in vivo. Whether the low-signal structures adjacent to some of the pseudoapposed struts on OCT may represent fibrin overlying components of the initial vessel wall; and whether pseudoapposed struts in some cases could actually be malapposed, would be interesting to investigate in comparison with histology. It should be stressed that the flower-shaped appearance of the stent/vessel wall configuration in frames with pseudoapposed struts should not be mixed up with a similar pattern seen in both OCT images and histological sections, where the outer portion of the “petals” are created by stent struts rather than the vessel wall (Figure 4).19 This phenomenon is probably a consequence of stent implantation at high pressure, stretching the vessel wall between struts. We would also like to mention that struts overlying side branch ostia were included as part of the classification, as to describe their existence. Since the mechanism of non-apposition, as well as the potential consequence hereof is pathophysiologically different from that of malapposed struts, they cannot be compared. Struts overlying side branch ostia are therefore often excluded from studies involving analysis of strut apposition.9 Relevance of detecting pseudo- and malapposed struts with OCT Although our study population was highly heterogeneous, it demonstrates that pseudoapposed struts can be found in many different stent types, at varying time points after implantation. In the present study, pseudoapposed struts were considerably more common than malapposed struts, and were frequently found in frames and lesions also containing malapposed struts. Both types of stent struts were found in stable as well as unstable clinical settings, albeit more frequently in ACS. Whether this could be related to mal- and pseudoapposed struts is difficult to evaluate from our small population, and requires larger, serial studies with OCT. Strut malapposition has been related to late stent thrombosis, although the frequency of malapposed struts has varied between autopsy- and IVUS studies.3,4 With histology, focus has mainly been on stent healing, where a lack of neointimal stent coverage and a persistent deposition of fibrin around struts has been associated with late stent thrombosis.15 However, the importance of strut apposition for stent healing is not known, which may partly be related to the insufficient resolution of IVUS, precluding the visualisation of very thin strut coverages and thus the study of the relationship between strut healing and apposition. Thus far, OCT studies have indicated that malapposed struts were more frequently uncovered than struts that were apposed.20,21 It is yet to be clarified whether the same is true for pseudoapposed struts. Limitations This study was a retrospective observational analysis. Due to the lack of post-implantation OCT data, it was not possible to evaluate whether mal- or pseudoapposition was present immediately after implantation or was acquired. Moreover, our study population was very heterogeneous and limited to a small number of cases, wherefore it was not possible to estimate the prevalence of pseudoapposed struts in different stent types, and at different time points after implantation. Conclusion For a detailed analysis of strut apposition with OCT, we used a methodology involving the reconstruction of strut thicknesses and estimation of stent- and vessel wall areas. With this method, we found four types of strut apposition, where pseudoapposed struts constitute a type of struts not previously described. These struts were found in frames with flower-shaped lumen contours, and were surrounded by structures of different signal intensities on OCT. The clinical importance of pseudoapposed struts remains to be settled.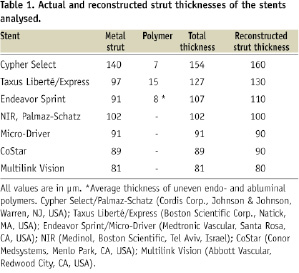
are presented as mean ± standard deviation or median and interquartile range (IQR), and categorical variables as percentages. Normality of the data was assessed by visual estimation of residual plots. Frequencies were compared with Fisher’s exact test.