Abstract
Aims: To develop a methodology that permits accurate 3-dimensional (3D) reconstruction from FD-OCT and angiographic data enabling reliable evaluation of the ESS distribution, and to compare the FD-OCT-derived models against the established models based on angiography/IVUS.
Methods and results: Fifteen patients (17 coronary arteries) who underwent angiography, FD-OCT and IVUS examination during the same procedure were studied. The FD-OCT and IVUS lumen borders were placed onto the 3D luminal centreline derived from angiographic data. Three-dimensional geometry algorithms and anatomical landmarks were used to estimate the orientation of the borders appropriately. ESS was calculated using computational fluid dynamics. In 188 corresponding consecutive 3-mm segments, FD-OCT- and IVUS-derived models were highly correlated for lumen area (r=0.96) and local ESS (r=0.89) measurements. FD-OCT-based 3D reconstructions had a high diagnostic accuracy for detecting regions exposed to proatherogenic low ESS identified on the IVUS-based 3D models, considered as the gold standard (receiver operator characteristic area under the curve: 94.9%).
Conclusions: FD-OCT-based 3D coronary reconstruction provides anatomically correct models and permits reliable ESS computation. ESS assessment in combination with the superior definition of plaque characteristics by FD-OCT is expected to provide valuable insights into the effect of the haemodynamic environment on the development and destabilisation of high-risk plaques.
Introduction
The arterial haemodynamic environment is a critical determinant of the cellular processes on the endothelial layer and arterial wall. Recent animal and clinical studies have highlighted the role of endothelial shear stress (ESS) as a powerful instigator of atherosclerotic lesion development/progression and an important predictor for future clinical cardiac events1-3, while the contribution of ESS to the phenomenon of neointimal hyperplasia following percutaneous coronary interventions has also been appreciated4,5. In vivo ESS assessment in coronary arteries is feasible using computational fluid dynamics techniques for blood flow simulation, but it requires realistic and accurate representation of the complex three-dimensional (3D) arterial lumen anatomy. Hybrid methodologies based on the fusion of x-ray angiographic and intravascular ultrasound (IVUS) data are the most accurate and widely accepted approach for reconstructing coronary arteries in 3D space since they incorporate the information on the 3D epicardial course of coronary arteries provided by angiography, and the detailed cross-sectional IVUS imaging of the arterial lumen and wall morphology6-8.
Intravascular optical coherence tomography (OCT) has recently gained interest in clinical practice as it provides coronary images of superior resolution (12-15 μm: ≈10 times higher than IVUS). The enhanced imaging capability of OCT allows characterisation of atherosclerotic plaques, the measurement of fibrous cap thickness over lipid pools, and the detection of plaque disruptions commonly occurring in acute coronary events9. Additionally, OCT enables the detailed imaging of stented arterial segments including evaluation of strut apposition/coverage. With the advent of the second-generation frequency domain OCT (FD-OCT) technology, initial limitations (e.g., need for occlusion of blood flow, short pullback length) were overcome, making FD-OCT a safe and easy-to-use modality in the catheterisation laboratory. Therefore, the use of FD-OCT for 3D coronary artery reconstruction enabling enriched in vivo investigations on the role of ESS in the atherosclerotic manifestations and pathobiology is deemed to be an extremely attractive opportunity.
Traditional IVUS-based fusion methodologies developed for geometrically correct coronary artery reconstruction require the extraction of the pullback trajectory of the IVUS catheter, and the placement and appropriate orientation of the IVUS images along the 3D catheter path. These approaches employ gating of end-diastolic angiographic and IVUS images to overcome deformations of the 3D vessel morphology caused by the lateral and backward-forward motion of the catheter during the pullback within the artery10, and require simultaneous visualisation of the catheter position and the luminal silhouette in angiography6-8. However, the high pullback speed during FD-OCT imaging (i.e., 20-40 vs. 0.5-1 mm/sec in IVUS) results in a very small number of end-diastolic images, which are not sufficient to reconstruct the coronary anatomy using the conventional IVUS-based methods.
In the current report, we present for the first time a method which provides anatomically correct 3D coronary artery reconstruction using x-ray angiographic and FD-OCT data, and which overcomes the above-mentioned inherent restrictions created by FD-OCT imaging. Consequently, this methodology enables the use of the 3D reconstructed arteries for blood flow simulation and creates the potential for further investigations involving the haemodynamic factors using FD-OCT data. Since, until now, angiography/IVUS imaging has been considered as the mainstay for ESS-related studies in coronary arteries, we also perform for the first time a head-to-head comparison of the FD-OCT-based 3D reconstructed arteries against their IVUS-based counterparts and evaluate the differences in geometrical features and the local ESS distribution.
Methods
STUDY POPULATION
Fifteen patients (17 coronary arteries) who underwent cardiac catheterisation and FD-OCT imaging were identified from the Massachusetts General Hospital (MGH) OCT registry. Inclusion criteria were: 1) both FD-OCT and IVUS examination in the same artery and at the same catheterisation procedure; 2) x-ray angiographic projections from two views (>35° apart); 3) no history of previous stent implantation in the artery to be studied (i.e., only native arteries were included); and 4) FD-OCT and IVUS pullback with a length >25 mm between corresponding proximal and distal anatomical landmarks (i.e., branches) that would be used for 3D reconstruction. The registry was approved by each institutional review board committee, and all patients provided informed consent before enrolment.
IMAGE ANALYSIS
Angiographic, FD-OCT and IVUS data acquisition is described in the Online Appendix. Two end-diastolic images were selected by the angiographic projections that portrayed the most distal and proximal anatomical landmark documented also in the FD-OCT and IVUS sequence. The portion of the artery defined from the distal and proximal anatomical landmark was reconstructed twice using the FD-OCT and IVUS data, respectively (i.e., FD-OCT-based and IVUS-based reconstruction).
The FD-OCT and IVUS image sequences were reviewed by expert observers who identified the most common distal and proximal fiduciary markers (i.e., side branches) that were visible in FD-OCT, IVUS and x-ray angiography. The IVUS frames were further analysed to select the end-diastolic IVUS images which were used for manually tracing the lumen border. For comparison purposes between IVUS and FD-OCT imaging, and in order to match approximately the axial sampling of imaging information between the two modalities, i.e., to match specifically the average 0.4-mm distance between IVUS end-diastolic frames (at a pullback speed of 0.5 mm/sec and an average heart rate of 75 bmp), every second FD-OCT frame (0.4-mm distance between frames at a pullback speed of 20 mm/sec) was selected for tracing the lumen border manually. The FD-OCT and IVUS lumen borders were then separately fused with the angiographic data to reconstruct the coronary anatomy.
3D CORONARY ARTERY RECONSTRUCTION
The reconstruction methodology utilised the 3D luminal centreline derived from the angiographic projections as a “backbone” to reconstruct the coronary artery. The centreline methodology11 was applied for reconstructing both the IVUS-based and FD-OCT-based 3D models according to the rationale described in the Online Appendix (Online Figure 1-Online Figure 3).
The selected end-diastolic angiographic images were processed for edge detection of the lumen borders, and then estimation of the luminal centreline11. The two centrelines detected in the angiographic views were used to define two B-splines which were extruded normal to their plane, each one forming a surface. The intersection of the two surfaces was a 3D curve which corresponded to the 3D luminal centreline. The centre of mass (i.e., centroid) of each lumen area from the FD-OCT and IVUS images was determined, and the lumen borders were placed perpendicularly onto the 3D lumen centreline in equidistant locations with the centroids being positioned on the 3D centreline. The axial twist of the FD-OCT and IVUS catheters occurring during the pullback, and as a consequence the relative rotational orientation of the FD-OCT and IVUS frames, was estimated with the use of the sequential triangulation algorithm6. Finally, the origin of corresponding side branches was identified in FD-OCT and IVUS images and their orientation was used to determine the absolute rotational orientation of the first FD-OCT and IVUS frame for the two types of reconstruction11, respectively (details in the Online Appendix).
The lumen 3D boundary points derived from the above-mentioned methodology were used to construct two non-uniform rational B-spline surfaces and thus rebuild the lumen geometry in 3D space for the FD-OCT-based and IVUS-based reconstructions of each artery. The obtained geometries were further processed with computational fluid dynamics techniques which can provide the detailed characteristics of intravascular blood flow and the local ESS distribution5. The methods for ESS computation are described in the Online Appendix.
DATA ANALYSIS AND STATISTICS
Several metrics regarding the geometry of the models and ESS distribution were used to compare the two types of 3D reconstruction. (I) We calculated the angle difference in the absolute orientation of the first FD-OCT and IVUS frame in the respective reconstructions. This metric reflects the overall agreement of the two types of reconstruction in estimating the distribution of plaque in 3D space. Details are included in the Online Appendix (Online Figure 4). (II) We computed the lumen volume in the 3D models. (III) Each 3D reconstructed coronary artery was divided into consecutive 3-mm segments2,3 along the 3D luminal centreline, and we assessed the average lumen area and local ESS; a total of 188 segments were available for analysis.
Continuous data are presented as mean±SD. Linear regression analysis and the Pearson correlation coefficient (r) were used to compare the metrics in the models obtained by the FD-OCT-based and IVUS-based 3D reconstructions. Bland-Altman analysis was also performed to assess the agreement of these metrics. Differences in total lumen volume in the arteries, and differences in average lumen area and ESS measurements in corresponding 3D 3-mm segments were assessed using the paired t-test. The Kolmogorov-Smirnov test was used for testing the overall equality of the frequency distributions of ESS values in the two types of reconstruction. Receiver operator characteristic curve analysis was performed to test the diagnostic efficiency of the FD-OCT-based methodology for identifying low ESS regions, which have been associated with atherosclerosis progression, high-risk plaque characteristics and the occurrence of future adverse clinical events in humans2. The cut-point for defining the categories of low vs. higher ESS in the FD-OCT-based and IVUS-based 3D models was set according to the lower tercile of the respective frequency distributions in the 3-mm segments (low ESS was defined as <1.5 Pa for both types of model). All tests were two-tailed and a p-value <0.05 was considered statistically significant. All analyses were performed using the commercial software SPSS 17.0 (SPSS Inc., Chicago, IL, USA).
Results
PATIENT CHARACTERISTICS
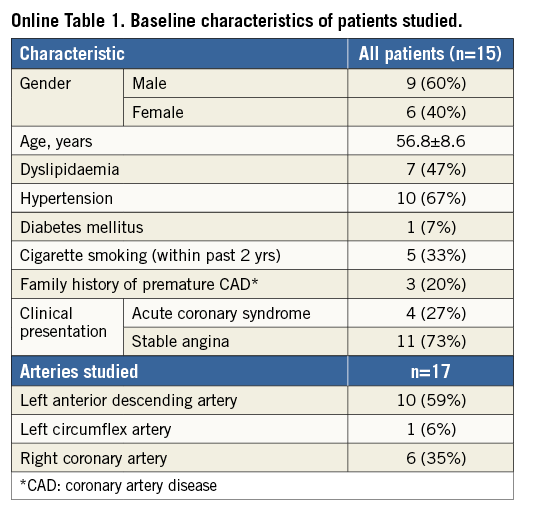
The baseline characteristics of the 15 studied patients are presented in Online Table 1. The arteries investigated with IVUS and FD-OCT examination included 10 left anterior descending arteries (LAD), six right coronary arteries (RCA) and one left circumflex artery (LCx). Six LADs had minimal atherosclerotic disease, whereas all other arteries were diseased with increased local atherosclerotic burden and significant stenoses which were treated with percutaneous coronary intervention following intravascular imaging. The average length of the 17 reconstructed arteries was 39.2±6.4 mm (range: 29 to 52 mm).
COMPARISON OF GEOMETRICAL FEATURES
Coronary reconstruction was performed successfully in all studied coronary arteries using both imaging modalities. A very good agreement was noted in the absolute orientation of the first IVUS and FD-OCT frames with a difference of only 16.3±13.1° between the corresponding 3D reconstructed models.
There was an excellent correlation in the lumen volume calculations between the FD-OCT-based and IVUS-based 3D models (r=0.986) (Figure 1A); the relative difference was −5.6±9.1% (mean difference: −12.12±19.10 mm3, p=0.019) (Figure 1B), indicating on average a smaller coronary lumen in the FD-OCT-based 3D models. A very high correlation was found for the average lumen area within the 3-mm segments (r=0.957) (Figure 2A), while on average the lumen size was smaller (mean difference: −0.32±0.93 mm2, p<0.001) (Figure 2B) in the FD-OCT-based compared to the IVUS-based 3D models with a relative difference of −7.3±17.7%.
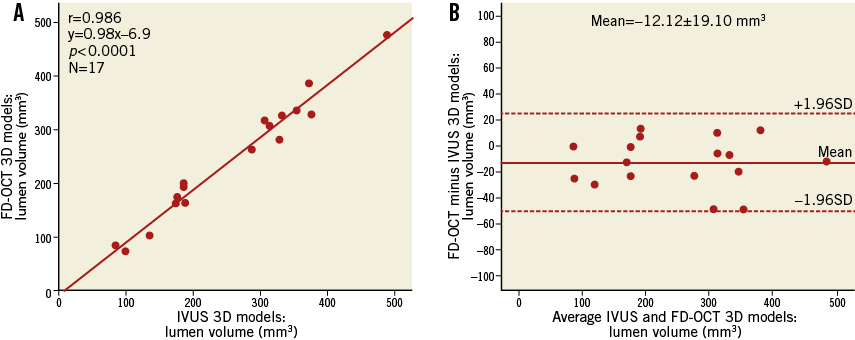
Figure 1. Vessel-based comparison of total lumen volume between the FD-OCT-based and IVUS-based three-dimensional reconstruction in 17 coronary arteries. A) Correlation plot. B) Bland-Altman plot.
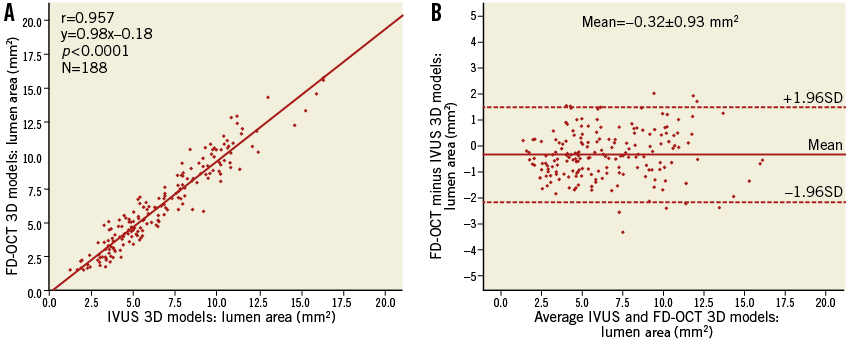
Figure 2. Comparison of the average lumen area in corresponding three-dimensional 3-mm segments (N=188) between the FD-OCT-based and IVUS-based reconstructed arteries. A) Correlation plot. B) Bland-Altman plot.
COMPARATIVE ASSESSMENT OF ESS DISTRIBUTION
The ESS measurements within the 3-mm segments correlated highly in the reconstructions derived by the two imaging modalities (r=0.886) (Figure 3A) and had a relative difference of 6.7±29.9% (mean difference: 0.47±1.75 Pa, p<0.001) (Figure 3B). There was a bigger spread of the data regarding the difference in ESS measurements for higher ESS values. When only the lower 90% of ESS values (<5.4 Pa) in the IVUS-based reconstructions were analysed separately, representing the most common ESS magnitude observed in coronary arteries, the relative difference was 3.8±28.1% (mean difference: 0.16±0.87 Pa) (Figure 3B, inset). We also performed a subgroup analysis to test whether there was any substantial difference in the correlation for ESS measurements between the reconstructions of left and right coronary arteries, since the latter are characterised by augmented motion during the cardiac cycle which could have an impact on the FD-OCT-based reconstructions. The correlation was found to be extremely similar for both types of coronary artery (LAD/LCx [n=127]: r=0.884, slope=1.39, p<0.001; RCA [n=61]: r=0.880, slope=1.35, p<0.001).
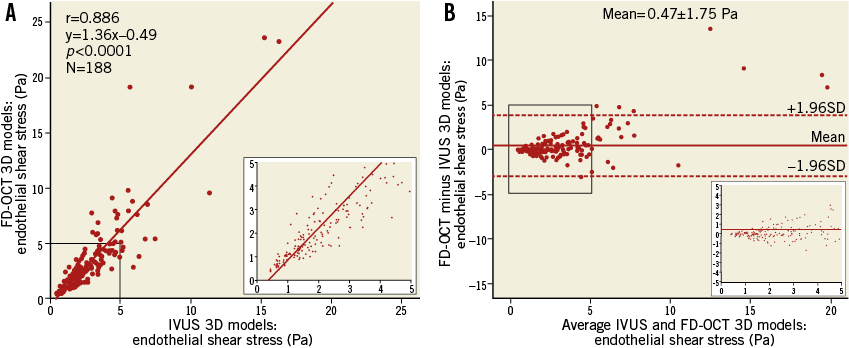
Figure 3. Comparison of the endothelial shear stress (ESS) distribution in corresponding three-dimensional 3-mm segments (N=188) between the FD-OCT-based and IVUS-based reconstructed arteries. A) Correlation plot. B) Bland-Altman plot. Insets focusing on the lowest 90% of ESS values (<5 Pa).
The frequency distributions of ESS values derived from the two types of reconstruction were very similar (Figure 4A and Figure 4B; p=0.67), resulting in virtually the same cut-point for the lowest tercile (1.46 and 1.48 Pa for the FD-OCT-based and IVUS-based models, respectively) which was used for defining the categories of low vs. higher ESS. Furthermore, the FD-OCT-based reconstructions showed very high diagnostic efficiency for identifying low ESS (<1.5 Pa) regions in the IVUS-based models which were treated as the reference gold standard (receiver operator characteristic area under the curve: 94.9%) (Figure 4C); the diagnostic accuracy for categorising 3-mm segments with low versus higher ESS was 87%. Figure 5 illustrates the 3D models of two coronary arteries as representative examples, demonstrating the overall similarity of ESS distribution between the reconstructed models using the two imaging modalities.
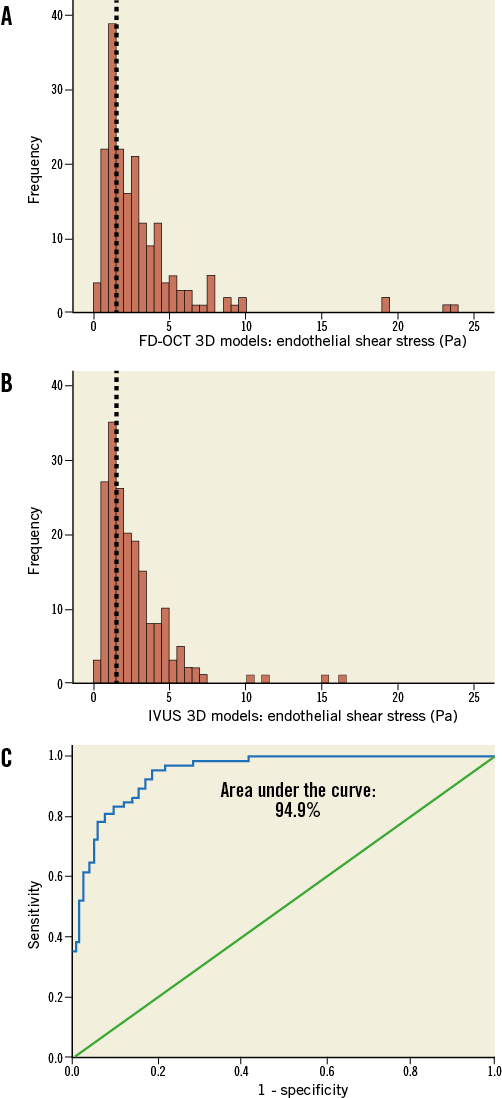
Figure 4. Comparison of the frequency distribution of endothelial shear stress (ESS) values in corresponding three-dimensional (3D) 3-mm segments (N=188) between the FD-OCT-based (A) and IVUS-based (B) reconstructed arteries. The frequency distributions of ESS values in the two types of reconstruction are very similar (p=0.67), resulting in the same cut-off for the lowest tercile of the values in both plots (<1.5 Pa; dotted lines). C) Receiver operator characteristic curve plot demonstrating a high discrimination performance (area under the curve: 94.9%) of the ESS assessment derived from the FD-OCT-based 3D models to detect regions with low ESS (<1.5 Pa; defined according to the lowest tercile of the frequency distribution) identified on the IVUS-based 3D models (i.e., gold standard).
Discussion
This study reports for the first time a methodology for accurate 3D coronary artery reconstruction based on the fusion of FD-OCT and x-ray angiographic data. This approach provides a realistic representation of the 3D complex anatomy of coronary arteries on the epicardial surface, incorporating the high-resolution cross-sectional FD-OCT structural information, and thus enables the use of the derived 3D models for blood flow simulation and ESS computation. Additionally, we present a head-to-head comparison of the FD-OCT-based coronary models against the respective 3D reconstructed arteries based on the fusion of angiography and IVUS, which has been widely used until now in studies investigating in vivo the role of haemodynamic factors. The reconstructed models based on FD-OCT imaging: 1) allow reliable coronary representation and luminal size estimations which correlate very highly with the corresponding IVUS-based 3D models; and 2) permit accurate evaluation of the local ESS distribution, and identification of the regions exposed to a proatherogenic low ESS environment, with a high diagnostic efficiency compared to IVUS-based 3D reconstructed models.
FD-OCT is a new intravascular imaging modality providing cross-sectional anatomical images with superior resolution which enable the identification and quantification of plaque and stent characteristics that were not previously available with IVUS. Three-dimensional volume rendering of the FD-OCT images has been introduced to visualise comprehensively the lumen, endothelial surface and implanted devices, demonstrating a great potential for real-time clinical applications and guidance of the interventional cardiologist in improving outcomes12. However, this type of 3D visualisation is performed in a linear fashion without incorporating any information about the 3D coronary curvature. Latest reports have described a simplified co-registration of the axial location of IVUS or OCT frames along 3D models derived from quantitative coronary angiographic data. This approach, however, does not allow accurate evaluation of the rotational orientation of IVUS or OCT frames13,14. To address the issue of appropriate orientation of OCT frames, Ellwein et al15 implemented a sophisticated method based on graph theory for retrospective estimation of the OCT catheter pullback path using the lumen centreline derived from computed tomographic angiography. This advanced approach was applied only to one stented left circumflex coronary artery using the earlier time-domain OCT technology with a slow pullback at 1 mm/sec, and there was no validation against an established gold standard, while it was also limited by requiring both invasive and non-invasive imaging.
In contrast to the previous studies, we present a methodology for anatomically correct 3D coronary artery reconstruction based on the fusion of x-ray angiographic and FD-OCT data, and provide for the first time direct comparison of the geometrical characteristics and ESS distribution in FD-OCT-based 3D coronary models against the respective models based on the fusion of angiography/IVUS, which have set the standard in studies focusing on ESS in coronary arteries. We found that the application of the lumen centreline methodology provides a very good approximation of accurate 3D reconstruction in the case of FD-OCT imaging despite the use of frames from different phases of the cardiac cycle, and the lateral and longitudinal (i.e., backward-forward) motion of the FD-OCT catheter inside the coronary arteries during the cardiac cycle10. Our approach directly overcomes the problem with the lateral movement of the FD-OCT catheter, while the error resulting from the longitudinal movement, previously quantified for IVUS10, was found to be small according to our adjunctive analysis (Online Appendix), probably due to the faster pullback of the FD-OCT catheter. The difference in the absolute orientation of the IVUS and FD-OCT frames in the respective 3D models was only 16.3±13.1°, indicating that FD-OCT-based reconstructions can provide anatomically correct information regarding the circumferential positioning of plaque features along each coronary artery.
Vessel-based volumetric measurements and local lumen area calculations in corresponding consecutive 3D segments showed that there was an excellent correlation (r>0.95) between FD-OCT- and IVUS-based 3D models in our study. Of note, lumen size in models derived from FD-OCT was found to be on average smaller than in those derived from IVUS. This finding is consistent with previous studies comparing cross-sectional lumen area measurements in OCT and IVUS image sequences in humans16, and ex vivo comparisons which also showed that OCT-based measurements were closer and had a higher correlation to histomorphometry than those obtained from IVUS17. Beyond any lumen dimension comparisons, and of utmost importance for investigations focusing on haemodynamic factors, the evaluation of local ESS distribution in our study showed that the FD-OCT-based reconstructed arteries can detect with a high accuracy coronary regions that are exposed to a proatherogenic low ESS milieu. Our findings support the application of OCT-based imaging modalities in studies investigating the role of haemodynamic factors in the natural history of atherosclerosis, and also help in forming a common basis for comparison purposes between the previously published studies using angiography/IVUS-based reconstructions and future ones with angiography/FD-OCT-derived 3D models.
Latest observations from large patient studies employing IVUS-virtual histology18 or vascular profiling of ESS2 support the prognostic implications and incremental value of (i) the greyscale IVUS for quantifying disease severity, (ii) the IVUS radiofrequency backscatter analysis for characterising plaque phenotypes, and (iii) in vivo ESS assessment using 3D coronary artery reconstruction and blood flow simulation. However, the predictive capacity of these modalities remains less than optimal since the combination of IVUS (plaque burden ≥70% and minimum lumen area ≤4 mm2) and IVUS-virtual histology (thin-cap fibroatheromas)18, and that of IVUS (plaque burden >60%) and ESS assessment (ESS <1 Pa)2 had a predictive value of 18% and 41% for future clinically relevant events, respectively. Therefore, an improved combined assessment of the structural and qualitative plaque characteristics, which constitute the substrate for subsequent atherosclerotic manifestations and clinical events, with the pathobiologically important stimuli (such as local ESS) on this substrate, is critical for enhanced understanding of vascular pathology in vivo and prediction of lesions and patients at high risk for adverse cardiac events. FD-OCT and its novel hybrid version of OCT-near-infrared fluorescence show particular promise for enhancing our predictive ability, since they can approximate histology for distinctive features of the wall that were not available until now and, most importantly, by using molecular probes they could also incorporate the in vivo assessment of local biological inflammatory processes into our armamentarium of predictive tools19. The use of these OCT-based imaging data in an anatomically correct 3D fashion permits combined ESS mapping (Figure 5, Figure 6), and thus enables advanced in vivo investigations of the effect of ESS on the dynamic pathobiology of the wall which may potentially help to test mechanistic hypotheses in humans and to understand the aetiologies of plaque rupture. Additionally, OCT imaging allows the detailed reconstruction of arteries with an implanted device, and thus our 3D reconstruction approach would enable further studies on the role of the haemodynamic micro-environment around stent struts in neointima formation and stent thrombosis, which remain the Achilles’ heel of percutaneous coronary interventions.
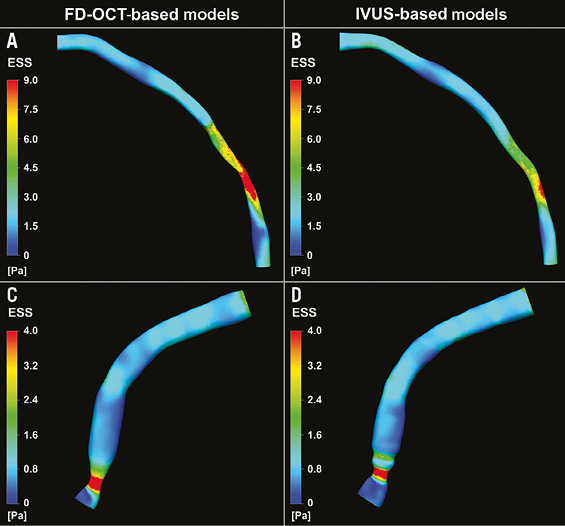
Figure 5. Three-dimensional (3D) reconstructed models of a left anterior descending and a right coronary artery using the FD-OCT (A and C, respectively) and the IVUS (B and D, respectively) imaging data, and colour-coded mapping of endothelial shear stress (ESS) values which demonstrate the overall similarity in the ESS distribution between the two types of reconstruction.
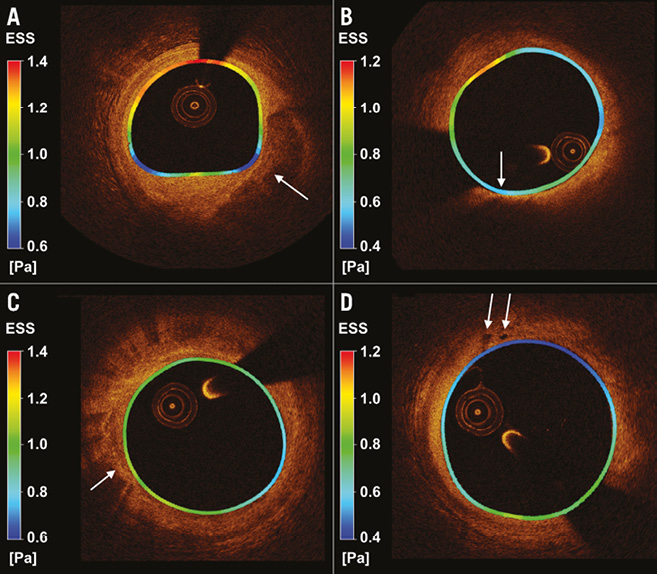
Figure 6. Cross-sectional FD-OCT images with local colour-coded endothelial shear stress (ESS) map derived from the three-dimensional models and superimposed on the lumen border circumferentially. A) An eccentric large atherosclerotic lesion with superficial calcification (arrow) is evident in the area where the lowest ESS values are mostly present. B) An eccentric large atherosclerotic mixed lesion with an area corresponding to a lipid core with a thin fibrous cap (63 μm, arrow) is present; the location with minimal cap thickness (arrow) co-localises with an area of very low ESS. C) Macrophage accumulations (arrow) in an atherosclerotic plaque. D) Intimal vessels (arrows) in a plaque with low ESS environment.
Limitations
The number of arteries included in the study is not large and LCx was underrepresented. However, we do not expect any differences regarding the reconstruction accuracy between the LAD and LCx, while the FD-OCT-based reconstruction for RCAs, which may be more tortuous and have increased motion during the cardiac cycle, showed very similar performance compared to the left coronary arteries. Furthermore, FD-OCT does not allow imaging of the media-adventitia border in most cases where plaque is present, and thus FD-OCT-based reconstruction of the outer vessel wall for plaque assessment is not possible and cannot be compared to IVUS. Finally, the very fast pullback of the FD-OCT catheter requires the use of frames from all phases of the cardiac cycle and thus it is not methodologically possible to overcome directly the longitudinal movement of the OCT catheter as is the case with IVUS by using end-diastolic frames.
Conclusions
The current report presents a new methodology for the reconstruction of coronary arteries from FD-OCT and x-ray angiography, and a head-to-head comparison of the FD-OCT-based 3D coronary models with the respective angiography/IVUS-derived 3D models of the same arteries for ESS assessment in humans. The comparison demonstrates that the application of the lumen centreline methodology to FD-OCT imaging provides anatomically correct representation of coronary arteries and results in highly comparable calculations of the ESS distribution against the corresponding models derived from IVUS. The use of FD-OCT data in a 3D fashion coupled with computational fluid dynamics for ESS assessment is expected to provide further insight into the pathophysiological processes of atherosclerosis and thus improve our ability to predict vulnerable locations likely to cause adverse coronary events.
Guest Editor
This paper was Guest Edited by Peter Barlis, MBBS, MPH, PhD, FCSANZ, FACC, FRSA, FRACP, FESC; Faculty of Medicine, Dentistry & Health Sciences, The University of Melbourne, Melbourne, Victoria, Australia.
| Impact on daily practice Frequency domain optical coherence tomography (FD-OCT), with its superior resolution, is increasingly applied for detailed invasive coronary imaging in the catheterisation laboratory. FD-OCT combined with routine angiography can be used for anatomically correct 3-dimensional modelling of coronary arteries and implanted devices, enabling advanced in vivo profiling of the local haemodynamic environment and plaque features. Ultimately, in daily practice, this methodology could be used for early identification of coronary regions at high risk for causing catastrophic anatomic outcomes leading to adverse cardiac events in humans. |
Acknowledgements
We acknowledge the support of the George D. Behrakis Fellowship and the Hellenic Heart Foundation. We thank Michelle Lucier, BSc, for technical evaluation of IVUS images.
Conflict of interest statement
I. K. Jang has received a research grant and a consulting fee from LightLab Imaging/St. Jude Medical. The other authors have no conflicts of interest to declare. The Guest Editor has no conflicts of interest to declare.
Appendix. Supplemental methods
DATA ACQUISITION
Angiographic images used for the analysis were recorded with full contrast injection before the insertion of the guidewire and imaging catheters. The order of performing intravascular imaging with FD-OCT and IVUS was at the discretion of the operator: in eight arteries FD-OCT was performed first, while in the remaining nine arteries IVUS was performed first; intravascular imaging data were acquired after nitroglycerine administration to prevent any vasospasm after the insertion of each one of the two catheters. FD-OCT imaging was performed using a frequency-domain (C7-XR OCT Intravascular Imaging System; St. Jude Medical, St. Paul, MN, USA) OCT system with a non-occlusive flushing technique; automatic pullback at a speed of 20 mm/sec (12 arteries) or 25 mm/sec (five arteries) was initiated in concordance with blood clearance by the injection of contrast media or Dextran. IVUS imaging was performed by using a motorised pullback device (constant speed of 0.5 mm/sec [12 arteries] or 1 mm/sec [five arteries]) with either a rotating 40 MHz transducer (11 arteries; Boston Scientific, Natick, MA, USA) or a phase-array 20 MHz transducer (six arteries; Volcano Corporation, Rancho Cordova, CA, USA). All imaging data were stored in DICOM format and transferred to a workstation for off-line analysis. Z-offset calibration for FD-OCT images was performed before converting to DICOM format.
RATIONALE FOR USING THE LUMEN CENTRELINE METHODOLOGY FOR THREE-DIMENSIONAL CORONARY ARTERY RECONSTRUCTION
The reconstruction methodology utilised the 3D luminal centreline derived from the angiographic projections as a “backbone” to reconstruct the coronary artery. The centreline methodology11 was applied for reconstructing both the IVUS-based and FD-OCT-based 3D models according to the following rationale:
(I) Conventional methods that were previously utilised for angiographic/IVUS data fusion use the 3D location of the catheter path documented in end-diastolic angiographic images at the beginning of the pullback as the “backbone” for coronary artery reconstruction, since the pullback trajectory of the catheter transducer is considered to coincide with the catheter position itself at end-diastole. The use of end-diastolic angiographic and IVUS images enables the 3D reconstruction at this particular phase of the cardiac cycle which is characterised by reduced cardiac motion. In the case of FD-OCT, the use of images from various phases of the cardiac cycle is necessary due to the very fast pullback which, along with the continuous FD-OCT catheter translocation within the lumen, invalidates the use of the imaging catheter path as the “backbone” for the reconstruction.
(II) Although IVUS and FD-OCT images are acquired orthogonal to the transducer and photodetector, respectively, at the tip of the imaging catheter and do not necessarily lie on the lumen centreline, the lumen centreline methodology provides 3D models yielding accurate estimations of the lumen area, plaque burden, plaque progression and local ESS distribution in IVUS-based 3D coronary artery reconstructions when compared to the traditional method using the catheter path11.
(III) Since the centreline methodology does not directly address the effect of any longitudinal motion of the FD-OCT catheter, we performed an adjunctive quantitative investigation to study the effect of such motion on the validity of the OCT-based reconstruction as presented below. Our analysis showed that the longitudinal movement results in a very small error (shortening or lengthening of less than 0.5 mm) (Online Figure 1-Online Figure 3) and thus does not have a major effect on the 3D reconstruction.
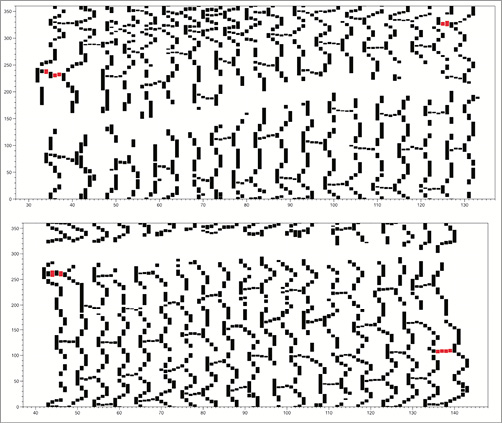
Online Figure 1. Example of 2D maps of a coronary segment with a BVS from two patient cases (top and bottom panels) in the ABSORB trial. Each identified strut in OCT images is depicted as a black dotted structure (the red dotted structures correspond to the proximal and distal markers included in the BVS architecture). The x-axis denotes the number of frames distally to proximally (each frame corresponds to 0.2 mm since the pullback speed was 20 mm/s), and the y-axis denotes the circumference in degrees. From the OCT-based 2D map, the architecture of the BVS is well represented with 18 rows of strut cells in the axial direction and the strut connectors within each row. The area which is blank (white) along the length of the BVS corresponds to the region of the guidewire artefact in each OCT image.
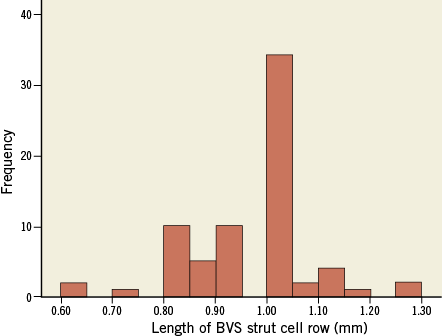
Online Figure 2. Frequency distribution of the OCT-based length (mm) of each BVS strut cell row (using the length of the visible strut connectors). The nominal length of each row is 1 mm. The mean length of a strut cell row derived from the OCT-based 2D maps was 0.95±0.12 mm with a range of 0.6 to 1.3 mm.
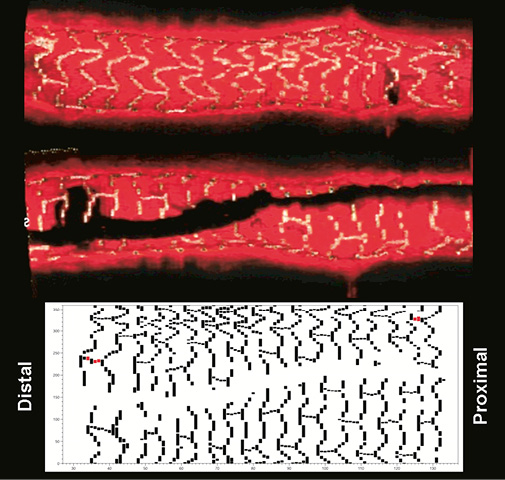
Online Figure 3. Top panels with the longitudinal section (the two sides of the section are provided) of the 3D volume-rendered representation of a segment with BVS derived from the OCT images where all visible struts were identified and segmented. At the bottom there is the corresponding 2D plot demonstrating the BVS struts around the whole circumference of the vessel.
(IV) An advantage of the lumen centreline methodology is that it enables the 3D reconstruction using retrospective data acquired during routine cardiac catheterisation11.
ADJUNCTIVE INVESTIGATION OF DISTORTIONS DUE TO LONGITUDINAL MOTION OF THE FD-OCT CATHETER
Longitudinal catheter motion is a critical issue for the 3D reconstruction, and thus we investigated in more quantitative detail the effect of such motion on the validity of the OCT-based reconstruction and, overall, the validity of using OCT imaging for 3D coronary artery reconstruction. Accordingly, we performed detailed axial measurements (which would be highly influenced if the effect of the longitudinal motion of the OCT catheter was great) relative to an object of known dimensions. We used OCT images derived in vivo from four patients with bioabsorbable vascular scaffolds (BVS), which have known precise dimensions and are visible by OCT. In each case, we linearly stacked the OCT images which were derived using the same FD-OCT equipment we used in our study, demonstrating the BVS scaffold, and we identified all visible struts in the OCT images and represented those in 2D map format (Online Figure 1). The patient heart rate in these four cases ranged from 72 to 78 beats/min which corresponds to a cardiac cycle period of 0.77 to 0.83 sec, which in turn span 15.4 to 16.6 mm in pullback length at a pullback speed of 20 mm/s. Therefore, the period with the greatest longitudinal movement of the OCT catheter, i.e., systole, would take place within the pullback length acquired for the BVS (nominal length: 18 mm).
The BVS scaffold (Revision 1.1; Abbott Vascular, Santa Clara, CA, USA) has a nominal length of 18 mm (distance between the proximal and distal marker of the BVS) and its architecture includes 18 rows of strut cells with a length of 1 mm each. We assessed qualitatively the appearance of the BVS design as represented by 2D maps and 3D volume-rendering techniques derived from the identified struts in the OCT images. Also, two different OCT-based metrics were used to quantify the accuracy of the linear stacking (i.e., axial reconstruction) of the OCT images which would be influenced if the effect of the longitudinal motion was great. The two quantitative analyses included:
1) the length of the BVS derived from the OCT images compared to the nominal length, and
2) the length of each of the 18 strut cell rows as derived from the OCT images.
The length of the BVS was measured using the most proximal and most distal marker of the BVS architecture visible in the 2D plots (Online Figure 1, marked in red). In addition, we calculated the number of frames (i.e., the distance) from one row to the other where struts in the axial direction (“connectors”) were visible in order to calculate the length of each row. When more than one connector was visible in a row, the average number of frames (from one row to the other) derived from all connectors was calculated. A maximum of three connectors was visible in each row.
The results of this quantitative analysis were the following:
1) The BVS length (average±standard deviation) by OCT-based 2D plots of the four BVS cases was 18.05±0.85 mm (max: 19 mm; min: 17 mm).
2) All 18 strut rows of the BVS characterising the BVS design were visible in all four cases that were analysed.
3) The mean length of a strut cell row was 0.95±0.12 mm with a maximum of 1.3 mm and a minimum of 0.6 mm. The nominal length of each strut cell row was 1.0 mm. The frequency distribution of the length of the strut cell rows is depicted in Online Figure 2.
The results of our detailed and quantitative analysis derived from in vivo assessment of the design and dimensions of a known object (i.e., BVS) dispel any concerns about the acquisition of OCT images being in a “non-contiguous” and “disturbed” order. The 2D maps and the quantitative measurements clearly demonstrate that the series of OCT images in a pullback provide rather smooth and contiguous imaging of the coronary segment of interest. All 18 strut cell rows were well visible in all four cases analysed, demonstrating a quite accurate representation of the overall BVS architecture, as we can observe in Online Figure 3 which includes longitudinal sections of a 3D volume-rendered segment with BVS and the corresponding 2D map from one of the four patient cases analysed.
Our quantitative estimations from the four patient cases with BVS show that the longitudinal error during the OCT pullback is small, despite the fact that OCT images come from all phases of the cardiac cycle. The mean length of the BVS scaffold derived from the OCT images was 18.05±0.85 mm, which is very close to the nominal length of 18 mm. These results are in agreement with previously published reports with OCT imaging in BVS demonstrating the accuracy in the length measurements by OCT (the error was only 0.09 mm [95% CI: −0.19 to 0.37 mm] in a previous study)20.
Since measurements of the total length of the BVS may not have captured any local errors with non-contiguous OCT imaging which could have been compensated within the whole length of the scaffold due to the backward and forward movement of the OCT catheter, we identified each strut cell row and all visible strut connectors. As noted above, all strut cell rows were visible in all four patient cases analysed, and the average length of each strut cell row was 0.95±0.12 mm, which again is very close to the expected true length of 1 mm. Furthermore, the range of these local measurements was 0.6 to 1.3 mm, which corresponds to an error of less than 0.5 mm. Therefore, the longitudinal movement of the catheter resulted in an erroneous shortening or lengthening of the axial dimensions of an absolute value <0.5 mm. The very small observed error allowed the representation of the BVS architecture in high local detail in the axial direction, and demonstrates that the stacking of OCT images linearly, indeed, does not result in mixing up proximal and distal parts of the same region (e.g., a plaque). Our quantitative analyses provide convincing demonstration that the longitudinal motion of the OCT catheter and the effect on the 3D reconstruction is small.
BLOOD FLOW SIMULATION AND ESS COMPUTATION
The obtained geometries were further processed with computational fluid dynamics techniques which can provide the detailed characteristics of intravascular blood flow and the local ESS distribution. These techniques involve the generation of a finite volume mesh in order to perform blood flow simulation by solving the 3D transport equations governing the conservation of mass and momentum (ICEM CFD and CFX 11; ANSYS, Canonsburg, PA, USA)5. Blood was treated as a homogeneous and Newtonian fluid with a dynamic viscosity of 0.0035 Pa·s and a density of 1,050 kg/m3. Blood flow was assumed to be laminar and incompressible, and a patient-specific steady flow with a uniform profile was specified at the inlet; developed flow was assumed to be established after an entrance length of 3 mm, and thus the proximal 3 mm were excluded from the analysis. Coronary blood flow for each artery was estimated by measuring the angiographic frames required for the contrast agent to pass from the inlet to the outlet of the reconstructed segment, the volume of the 3D lumen (separately for the FD-OCT-based and IVUS-based reconstructions) and the cine frame rate. The arterial wall was considered to be rigid and a no-slip condition was applied at the vessel wall, while zero pressure conditions were imposed at the outlet. ESS at the lumen surface of the artery was calculated as the product of blood viscosity and the gradient of blood velocity at the wall.
CALCULATION OF THE ANGLE DIFFERENCE IN THE ABSOLUTE ORIENTATION OF THE FIRST FD-OCT AND IVUS FRAME IN THE RESPECTIVE THREE-DIMENSIONAL RECONSTRUCTIONS
To measure any differences in the absolute orientation of the first frame, it is necessary first to account for the difference in the rotational orientation of the IVUS and the OCT frames due to the initial positioning of each catheter in the artery. To estimate the difference due to the positioning of each catheter, we identify corresponding IVUS and FD-OCT frames portraying side branches and then calculate the orientation of the side branches around the vessel circumference in these images. Online Figure 4 includes an example showing in detail the procedure followed for the measurement. The average angle difference between the orientation in IVUS and FD-OCT is estimated and then the entire FD-OCT sequence is rotated by the computed angle. Then the luminal borders are manually detected and the origin of the side branches is marked in the IVUS and the rotated FD-OCT images. These annotations are separately fused with the luminal centreline extracted from the angiographic data to reconstruct the coronary anatomy. The side branches detected in coronary angiography and the intravascular imaging data are used to define the rotational orientation of the first IVUS and first OCT frame in these reconstructions using a previously described methodology11. The angle difference between the estimated absolute orientation of the first IVUS frame in the IVUS-based models (which have been used as the reference gold standard) and the first FD-OCT frame in the FD-OCT-based reconstructions was calculated, and this represented the difference between the FD-OCT- and IVUS-based reconstructions in estimating the absolute orientation of the luminal borders.
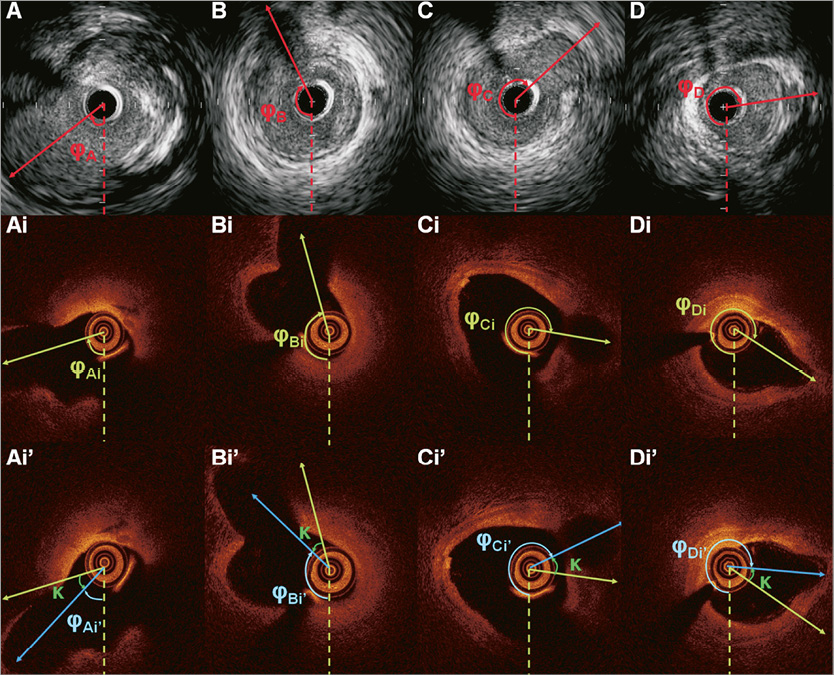
Online Figure 4. Panels A, B, C, and D portray the end-diastolic IVUS images acquired during IVUS examination showing the origin of the identified side branches. The orientation of each branch is estimated towards the clockwise direction starting from 6 o’clock (dotted line). Panels Ai, Bi, Ci, and Di are the corresponding FD-OCT frames acquired during the FD-OCT examination of the same arterial segment. The orientation of the detected side branches is estimated in a similar manner. The average angle difference between the orientation of the side branches detected in the corresponding IVUS and FD-OCT frames (κ) is determined. The entire FD-OCT sequence is then rotated at an angle κ so as to have the same orientation with the IVUS sequence (panels Ai’, Bi’, Ci’, and Di’). The new orientation of the side branches in the rotated FD-OCT sequence is indicated with a blue vector.
Online reference