Abstract
Aims: Atherosclerotic plaques develop at low shear stress locations in the arterial tree. However, at a certain moment, plaques encroach into the lumen causing local wall shear stress (WSS) increase. Minimal information is available on the relationship between WSS and plaque composition. We investigated in human coronary arteries in vivo the frequency with which the necrotic core and necrotic core in contact with the lumen are located at either low or high WSS regions in early and advanced plaques.
Methods and results: We combined a 3-D reconstruction technique of coronary arteries based on angiography and intravascular ultrasound with IVUS-virtual histology (IVUS-VH) data. With IVUS-VH the necrotic core was determined. The lumen of these 3-D reconstructions served as input for the computational fluid dynamics. Per cross-section the WSS at the regions with major necrotic core and necrotic core in contact with the lumen were compared to the median WSS in the cross-section. Ten human coronary arteries were studied. Only cross-sections with average wall thickness >0.5 mm were included in the analysis. In early plaques (plaque burden <40%), the necrotic core was most frequently located at WSS smaller than the median (61%) contrasting the advanced plaques (plaque burden >40%), being located at WSS higher than the median (60%, p<0.05 Mann-Whitney U test). Necrotic core in contact with the lumen was most often exposed to high WSS, being most pronounced in advanced disease (61%, p<0.05).
Conclusions: With the advancement of disease, necrotic core is less often located at low WSS regions, but exposed to high WSS, which is probably the result of lumen narrowing. Necrotic core in contact with the lumen was most frequently exposed to high WSS.
Introduction
Shear stress is known to play an important role in the generation of atherosclerotic plaques1. Studies on atherosclerotic plaques formation showed that plaques are predominantly located at low shear stress regions, which are often found at the inner curve of coronary arteries or close to side branches2,3. During plaque development positive vascular remodelling keeps the lumen open and could therefore be considered responsible for the persistence of unfavourable low shear stress regions during plaque growth. Consequently, in these regions continuous influx of lipids is anticipated with possible development into a vulnerable plaque phenotype, which is characterised by the presence of a large necrotic core covered by a thin fibrous cap (thin-cap fibroatheroma [TCFA])4,5. However, at a certain moment, plaques encroach into the lumen causing lumen narrowing, which in general is accompanied by shear stress increase at certain regions of the plaque6. Evidence is accumulating relating high shear stress to plaque destabilisation, cap thinning and ulcer formation7-9.
Thus, based on the before-mentioned literature, we hypothesise that in the early stages of the disease the plaque and thus also the necrotic core are located at the low shear stress regions. In the later stages of the disease the plaque will cause lumen narrowing, and thus high shear stress acts at the plaque. We hypothesise that this high shear stress contributes to cap thinning and thus our second hypothesis is that necrotic core in contact with the lumen, a typical characteristic for vulnerable plaques, is located at high shear stress regions.
Although some studies have investigated the relationship between shear stress and plaque composition, these are often concerned with the carotid arteries7,10 or with atherosclerotic animal models5,11,12. Until now minimal information was available on the relationship between shear stress and plaque composition in human coronary arteries in vivo. With the advent of IVUS-derived virtual histology (IVUS-VH) information on the plaque composition of human coronary arteries became available. Based on radiofrequency data, IVUS-VH is able to distinguish four plaque components including fibrous, fibro-lipid, necrotic core and calcified tissue13. This technique can identify in vivo features associated with plaque vulnerability. IVUS-VH-derived TCFA has been defined as a plaque with more than 40% plaque burden and more than 10% confluent necrotic core in contact with the lumen14. In the present study we combined IVUS-VH with the 3-D reconstruction technique ANGUS, which is based on fusion of biplane angiography and IVUS. The combination of these techniques plus computational fluid dynamics allowed us for the first time to correlate plaque composition to local shear stress patterns.
The aim of this study was twofold. The first aim was to investigate the frequency with which the necrotic core in early and advanced plaques is located at low shear stress regions. The second aim was to study the frequency with which confluent necrotic core in contact with the lumen, one of the characteristics of vulnerable plaque, is exposed to high shear stress, so as to find confirmation of the before-mentioned theory regarding the involvement of high shear stress in cap thinning.
Material and methods
PATIENT POPULATION
To investigate the relation between shear stress and plaque composition, 10 coronary artery segments (5 RCA, 2 LAD, 3 LCX) of 10 patients were studied. These patients were selected based on the availability of biplane angiographic data, ECG gated IVUS pullback data from a sheath-based catheter, as well as virtual histology data of the same vessel segment.
INTRAVASCULAR ULTRASOUND (IVUS)
For the acquisition of the IVUS images used to reconstruct the vessel in 3-D an R-wave gated motorised stepped pullback was performed using a 2.9 Fr sheath-based catheter (Atlantis SR Pro, 40MHz or Ultra Cross 30MHz; Boston Scientific, Natick, MA, USA). The transducer was withdrawn with a step size of 0.5 mm and the images were stored on a computer system (TomTec Imaging Systems GmbH, Unterschlussheim, Germany). To obtain from the IVUS images the contours of the lumen-intima interface and the interface between the external elastic membrane (EEM) and adventitia, a semi-automatic contour detection programme QCU analytical software package (LKEB; Dept of Radiology, Leiden University Medical Centre LUMC, Leiden, The Netherlands) was used. From these contours the following parameters were derived: lumen area (LA), vessel area (VA), plaque area (PA)= VA-LA; plaque burden: PA/VA*100% and wall thickness. Wall thickness was determined as the shortest distance between the lumen and EEM contour. For the acquisition of the virtual histology (IVUS-VH) images a continuous pullback (0.5 mm/s) with a 20 MHz phased-array IVUS catheter (Eagle® Eye; Volcano Corp., Rancho Cordova, CA, USA) was performed. An RF frame was selected at each R wave peak and stored for off-line analysis. The RF data was processed (PCVH 2.2; Volcano Corp.,) to obtain colour-coded tissue maps of each cross-section. Absolute and relative tissue component parameters and the presence and amount of necrotic core at 16 regions over the circumference of each cross-section were derived from the tissue maps by a custom-made programme written in Matlab (Mathworks, Natick, MA, USA). The major necrotic core of a plaque was defined as the largest connected region of pixels identified as necrotic core. If there was no visible tissue layer between lumen and necrotic core (cap thickness is less than 200 um, which is the IVUS-VH resolution) it was labelled necrotic core in contact with the lumen15. Strictly speaking this is the subendothelial necrotic core. Figure 1B shows an example of a cross-section with a major necrotic core (red) and necrotic core in contact with the lumen (right picture: orange).
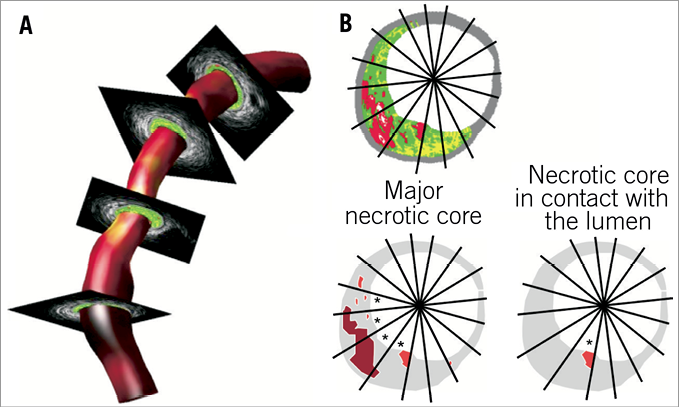
Figure 1. A) Example of a 3-D reconstruction of lumen and wall of a coronary artery based on the ANGUS technique combined with virtual histology data. The shear stress is mapped in colour code on the lumen of the 3-D reconstruction. B) Cross-section with virtual histology; red indicates the location of the major necrotic core. The lower panels explain which sections (*) are studied for shear stress in the vicinity of major necrotic core and the necrotic core in contact with the lumen.
3-D RECONSTRUCTION
To obtain the wall shear stress data in the coronary segments the 3-D geometry has to be reconstructed. This was done by the ANGUS technique described extensively elsewhere16 combining biplane angiographic and IVUS data. In brief: a biplane angiogram was recorded at 25 frames/sec using diluted contrast agent (Visipaque; GE Healthcare BV, Eindhoven, The Netherlands) vol/vol 2:1 with saline to allow simultaneous visualisation of the sheath-based IVUS catheter and lumen. From the x-ray recordings, an end-diastolic set of frames was selected optimally showing the catheter and the contrast-filled lumen and used to reconstruct the imaging core of the catheter, representing the catheter path, in 3-D. The vessel lumen was reconstructed by combining the 3-D reconstructed catheter path with the IVUS contours derived from the ECG gated pullback positioned perpendicular to the catheter path.
MAPPING
Because the ANGUS reconstructed geometry was derived from an ECG gated pullback with a sheath-based IVUS catheter and the IVUS-VH dataset was derived from a continuous pullback and retrospective ECG gating in the same vessel segment, mapping of the IVUS-VH data set on the ANGUS data set in 3-D space was necessary. Anatomical landmarks such as bifurcations and calcium spots were used to select the corresponding segments of both pullbacks. The axial positions of the IVUS-VH cross-sections on the ANGUS reconstruction were determined by re-sampling the axial positions between corresponding landmark frames in order to correct for differences in heart rate between both pullbacks. Rotational matching was based on comparing the distances from lumen and EEM to the lumen centre of mass at different circumferential positions of both reconstructions at the landmark frames. The rotational angle of each individual IVUS-VH cross-section was found by linear interpolation between the angles found at corresponding landmark frame positions.
COMPUTATIONAL FLUID DYNAMICS
Each 0.5 mm slice of the ANGUS 3-D lumen geometry was divided into 32 hexahedral elements and the shear stress distribution was calculated by computational fluid dynamics (SEPRAN; Sepra, Den Haag, The Netherlands). The mean inflow velocity (stationary flow) used to prescribe a parabolic inflow profile was based on a wall shear stress of 1.3 Pa, which was derived from flow measurements in diseased human coronary arteries8, the inlet diameter and a Newtonian blood viscosity of 3.5 mPas. No-slip lumen boundary conditions and a stress-free outflow were prescribed.
For each cross-section the median wall shear stress (WSSmedian) of the 16 sections around the circumference (22.5°) was calculated. Per cross-section it was determined whether the average shear stress at the region of an underlying major necrotic core or necrotic core in contact with the lumen was lower or higher than the WSSmedian. WSS at the location of the major necrotic core or necrotic core in contact with the lumen being lower than the WSSmedian were considered low shear stress regions. The percentage of the cross-sections obeying this criterion was reported.
STATISTICS
A wall thickness >0.5 mm is considered to be plaque17; only the cross-sections with average wall thickness >0.5 mm were selected for the analysis. In order to investigate the influence of the severity of the disease on the relationship between shear stress and location of major necrotic core/necrotic core in contact with the lumen, cross-sections were divided into two groups, based on the size of the plaque burden (<40%, >40%). Plaque burden <40% was considered as a surrogate marker for early atherosclerosis with minimal lumen narrowing and plaque burden >40% represented the more advanced stage of atherosclerosis18. Subsequently the frequency with which the shear stress at the major necrotic core site was lower or higher than the WSSmedian was reported for each group and the groups were compared. Also the frequency with which the shear stress at the location of the necrotic core in contact with the lumen was lower or higher than the WSSmedian was reported for both groups and compared. A similar analysis was performed based on a data split regarding the size of the total necrotic core being either smaller or larger than 10%14.
Comparisons among the groups of the frequency with which the major necrotic core or the necrotic core in contact with the lumen was located at shear stress lower or higher than the median were performed using a non-parametric Mann-Whitney U test. Comparisons of the frequencies against 50% were performed using the Binomial test (SPSS, 15.0.1; SPSS Inc., Chicago, IL, USA).
Results
GENERAL
Ten coronary arteries from 10 patients were successfully 3-D reconstructed with the ANGUS technique. Figure 1A shows an example of a 3-D reconstruction of a human coronary artery combined with virtual histology cross-sectional data. In total, 865 cross-sections with virtual histology were matched to the grayscale images of the ANGUS 3-D reconstructions.
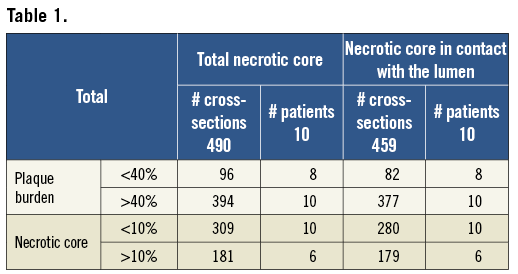
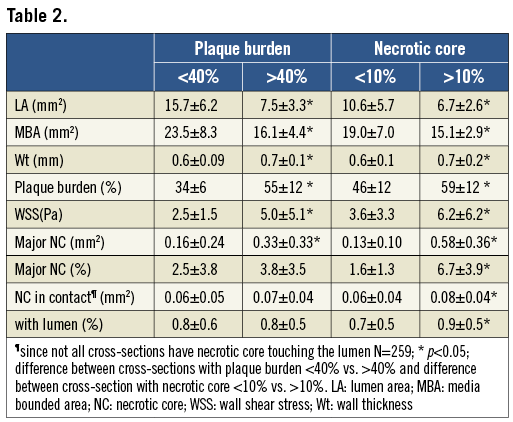
From these 865 cross-sections, 490 cross-sections had an average wall thickness >0.5 mm. All of these cross-sections had a necrotic core. From the 490 cross-sections with necrotic core present, almost all (n=459) also had necrotic core in contact with the lumen. The median number of cross-sections per patient included in the analysis was 25. Table 1 and Table 2 present respectively the number of cross-sections with a plaque burden <40% and >40%, and a necrotic core size <10% and >10%, and the characteristics of these cross-sections including the lumen area, media bounded area, wall thickness and plaque burden, major necrotic core and necrotic core in contact with the lumen. Cross-sections with a plaque burden <40% had on average a larger lumen area, media bounded area and smaller wall thickness and major necrotic core than cross-sections with plaque burden >40% (p<0.05, ANOVA). Comparing the cross-sections with a large necrotic core (>10%) to the ones with a small necrotic core (<10%), it could be observed that plaques with a large necrotic core had, as expected, the largest plaque burden, wall thickness, major necrotic core and necrotic core in contact with the lumen (p<0.05, ANOVA), but the media bounded area was significantly smaller for the cross-sections with large necrotic core (>10%).
MAJOR NECROTIC CORE VS. SHEAR STRESS
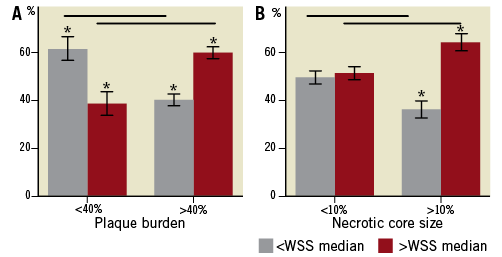
The average shear stress in all cross-sections was 4.5±4.7 Pa. Per cross-section the median shear stress (WSSmedian), was calculated and the shear stress at regions with underlying major necrotic core was compared to these values. The WSSmedian was on average 4.0±4.6 Pa. For 44% of the cross-sections the major necrotic core was located at a shear stress lower than WSSmedian, while 56% was located at a shear stress higher than WSSmedian.
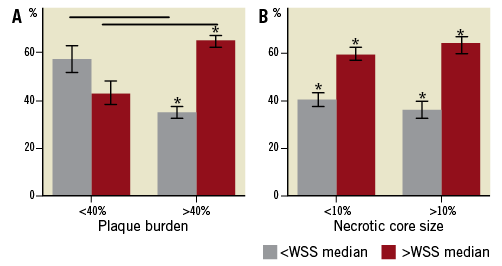
Plaque burden Subsequently, the cross-sections were subdivided according to the severity of the disease as can be determined by plaque burden (<40%, >40%). For cross-sections with early disease (plaque burden <40%), the necrotic core was most frequently located at the low WSS locations ( Necrotic core Thereafter the cross-sections were divided into two groups based on the size of the total necrotic core (<10%, >10%). Figure 2B shows the results. With increasing necrotic core size the percentage of cross-sections for which the major necrotic core was located at low shear stress regions decreased from 49% to 36% (p<0.05), while the percentage of cross-sections for which the major necrotic core was located at high shear stress regions increased from 51% to 64% (p<0.05). Figure 2. A) percentage of cross-sections for which necrotic core is located at low shear stress ( NECROTIC CORE IN CONTACT WITH THE LUMEN VS. SHEAR STRESS In general, for 61% of the cross-sections the necrotic core in contact with the lumen was exposed to shear stress higher than WSSmedian (p<0.05). Plaque burden For early disease (plaque burden <40%), the necrotic core in contact with the lumen was not preferentially located at high or low shear stress (p=NS). However, in cross-sections with advanced disease (plaque burden >40%) necrotic core in contact with the lumen was significantly more often exposed to high shear stress (>WSSmedian, 65%, p<0.05) and less often exposed to low shear stress ( Necrotic core Exposure of the necrotic core in contact with the lumen to high shear stress (60% of the cross-sections p<0.05) was independent from the total necrotic core size (Figure 3B). Figure 3. A) percentage of cross-sections for which necrotic core in contact with the lumen is exposed to low shear stress ( Discussion We showed the relationship between necrotic core based on IVUS-VH and shear stress derived from computational fluid dynamics in 3-D reconstructed coronary arteries. In early lesions (plaque burden <40%), the necrotic core was more exposed to lower shear stress than the median value contrasting the more advanced lesions, which were more exposed to high shear stress (higher than the median value). Necrotic core in contact with the lumen showed exposure to high shear stress, which was most pronounced for the advanced disease. GENERATION OF PLAQUES High cholesterol levels are considered as the major source of pathological intimal thickening of the vessel wall. In parallel, there is ample evidence that plaques are generated at low shear stress regions in the arterial system. A study in mice carotid arteries showed that plaques with a large necrotic core as assessed by histology were preferably generated at the low shear stress regions than at the oscillatory shear stress region downstream from an artificially-created luminal stenosis12. A similar observation was made by Chatzizisis et al5 who showed in a diabetic pig model that plaques with vulnerable characteristics were most often positively remodelled and generated at the low shear stress regions. Rodriguez-Granillo et al19 were the first to apply virtual histology in human coronary arteries to investigate the preferential locations of necrotic core close to bifurcating arteries. As bifurcating arteries have a specific shear stress pattern they showed that at the acknowledged low shear stress regions, downstream of the bifurcation, plaques with the most necrotic core were present. Combining this knowledge, we hypothesised that in human coronary arteries the early lipid-rich plaques were located at the low shear stress locations. In our study we considered the plaques with plaque burden <40% as early lesions. This is because it was shown that such plaques still have the capacity to remodel positively18, have hardly any lumen narrowing18 and are small in size (Table 2). Looking into the composition of the early plaques (with plaque burden <40%) we found that the major necrotic core was most often located at the low shear stress regions. However, in advanced coronary artery disease, in contrast with previous studies, we observed a different relationship: the major necrotic core was most frequently located at the higher shear stress regions. The latter can be understood as with plaque burden exceeding 40% lumen narrowing starts to occur. Without changes in the flow, lumen narrowing will immediately lead to local shear stress increase. This local increase in the shear stress will occur at the regions that were earlier low shear stress regions. In fact, necrotic cores generated at earlier low shear stress regions can now be located at high shear stress locations because of lumen narrowing. Thus it is plausible that necrotic core can be found at high shear stress regions, the percentage of which will increase with the advancement of disease. NECROTIC CORE IN CONTACT WITH THE LUMEN Until now minimal information has been available regarding the relationship between cap thickness and shear stress. Earlier studies have suggested that fibrous caps exposed to high shear stress might weaken8 or become thin20 and eventually rupture leading to ulcer formation7 and thus to cardiovascular events. The mechanisms through which high shear stress might affect plaque composition in the advanced stages of the disease are largely unknown. Various pathways were identified as possible candidates for high shear stress-induced cap thinning, for instance, nitric oxide mediated smooth muscle cell apoptosis or plasmin-induced metalloproteinase activity/production6. Further studies are needed to establish these relationships. Virtual histology is not able to identify the fibrous cap thickness, but if the necrotic core is in contact with the lumen it is assumed that at those locations the fibrous cap is thinner than 200 microns, which is the resolution of the ultrasound catheters. Our study showed that the locations that had necrotic core in contact with the lumen were exposed to high shear stress most frequently, which was most pronounced at advanced disease. These data underline that high shear stress is potentially involved in cap thinning because, at the locations where the cap is too thin to visualise with virtual histology, those locations were exposed to high shear stress most frequently. However, more extensive research including serial image acquisition needs to be performed to establish this relationship further. LIMITATIONS The current paper included a relatively small number of patients. Only 10 patients were available for this study, which resulted in 490 cross-sections available for analysis. Although the number was relatively small, significant differences were found. Information on the necrotic core was obtained using IVUS-VH. Quantitative information on necrotic core obtained by IVUS-VH has been shown to be in line with clinical presentation15,24 and had predictive value in the PROSPECT trial. Assessment of plaque composition based on intravascular techniques has its limitations and it would be ideal to rely on pathology. However, for longitudinal studies this is, for obvious reasons, impossible. We have to consider the accuracy with which the image registration was performed. We compared the IVUS images of two different catheter systems (Boston Scientific for the ANGUS system and Volcano for the IVUS-VH), so as to map the IVUS-VH on the 3-D reconstruction. We estimate that with the linear interpolation between the landmark frames the axial mapping is accurate within 0.5 mm and the circumferential mapping within 5°. As the cross-sections are finally pooled in two groups, it is unlikely that mismatch in image registration would have confounded the observed relationship between shear stress and plaque composition. Although we do not expect mismatch in image registration to be a major source of error, studies like these could benefit from simultaneous wall shear stress and plaque composition imaging. Currently, sheath-based catheters necessary for the ANGUS procedure are under development, which will allow studies of IVUS-VH and shear stress with the same catheter. For the WSS calculations, steady flow was used instead of the pulsatile behaviour of the flow. In a number of studies it was shown that the time-averaged low shear stress regions co-localised with the locations of the low shear stress21. Moreover, the individual variation in flow was not considered. However, since we used the local WSSmedian as reference, the data will be minimally affected by these variations, which only come into play when large non-linearities are expected, this being improbable with these geometries and flows. In addition, we considered the walls to be rigid, without cardiac motion. Although cardiac motion and distensibility can change the absolute shear stress values it is most likely they will not influence the shear stress distribution over short segments, implying that the low shear stress regions remain low and the high shear stress regions high22,23. Therefore it is unlikely that the outcome of this study is largely influenced by the before-mentioned assumptions. CLINICAL IMPLICATIONS Evidence is accumulating for the role of high shear stress in plaque destabilisation8, but until now it has not been established what percentage of plaques with necrotic core in contact with the lumen being exposed to high shear stress will result in a coronary event. To study the temporal changes of the fibrous cap due to high shear stress, serial measurements should be taken and patients should be followed for possible events at those locations. Conclusions These data imply that, with the advancement of disease, necrotic core/necrotic core in contact with the lumen is less often located at low shear stress regions, but exposed to high shear stress, which is probably the result of lumen narrowing during plaque growth. Conflict of interest statement The authors have no conflicts of interest to declare. Reviewer comment The investigators, using well established techniques, have reconstructed 10 epicardial coronary arteries by fusing IVUS with biplane coronary angiograms, then cleverly fused these data with estimates of plaque composition obtained from VH. Unfortunately, at this point, two serious flaws were introduced into the methodology. First of all, to find WSS by computational fluid dynamics (CFD) methods, coronary flow rates were estimated by assuming a WSS of 1.3 Pa at the inlet to each of the arteries. We can only presume that this was at the ostium of the RCA and just distal to the bifurcation for LAD and LCx, but it is not discernible in the manuscript. This unsupported assumption, which probably does not even approach validity for arteries as diseased as those under study, undermines all subsequent results and conclusions and renders the manuscript invalid. Secondly, a viscosity for all patients of 3.5 mPas is assumed, whereas this varies significantly depending on the haematocrit and lipoprotein content.