- atherosclerosis
- coronary artery disease
- intravascular ultrasound
- shear stress
- palpography
Abstract
Aims: Atherosclerotic plaques develop in low shear stress regions. In the more advanced phase of the disease, plaques are exposed to altered shear stress levels, which could influence plaque composition. We investigated changes in plaque composition in human coronary arteries over a 6-month period and how these changes are related to shear stress.
Methods and results: We took images of eight coronary arteries to obtain the 3D shape of the arteries. Lumen data were combined with computational fluid dynamics to obtain shear stress. Palpography was applied to measure strain at baseline and at 6-month follow-up. The change in strain from baseline to follow-up served as a marker for the change in plaque composition. We identified 17 plaques, and each plaque was divided into four regions: the upstream, throat, shoulder and downstream region. Shear stress and strain in the downstream region was significantly lower than in the other regions. There was no significant change in strain for the four different plaque regions. However, we observed that those plaque regions exposed to high shear stress showed a significant increase in strain.
Conclusions: Plaque regions exposed to high shear stress showed an increase in strain over time. This indicates that shear stress may modulate plaque composition in human coronary arteries.
Abbreviations
IBIS Integrated Biomarker and Imaging Study
IVUS intravascular ultrasound
ANGUS biplane ANGiography and intravascular UltraSound
Introduction
Blood flow induced shear stress plays an important role in vascular (patho)physiology through its impact on endothelial function. Low shear stress is associated with various pro-atherogenetic processes in the endothelium, including enhanced permeability to lipid-proteins and increased expression of various adhesion molecules1. Atherosclerotic plaques, therefore, preferentially develop in those regions of the arterial tree that are exposed to low shear stress. The role of shear stress in late atherosclerotic disease is less well established although it was hypothesised that shear stress might influences plaque composition in advanced phase of the disease2.
Many studies have investigated the relationship between shear stress and plaque morphology in diseased coronary arteries in vivo (for reviews, see references 2 and 3), some of them including serial data to study changes of plaque morphology over time4,5. Only a few investigations attempted to link blood flow induced shear stress to plaque composition, most of them performed in animal models6,7. To perform such studies in patients, we need a technique to determine plaque composition in vivo, and emerging technologies to do so are currently evaluated in a clinical setting8. One of those technologies is palpography, which is an intravascular ultrasound (IVUS) technique to measure the deformability –or strain– of plaques in human coronary arteries9,10. Both in vitro and in vivo studies have shown that the measured strain values can serve as a surrogate marker for plaque composition11.
In a previous study we applied palpography to measure strain over plaques in human coronary arteries in vivo12. After combining strain with shear stress, we found that plaque regions exposed to the highest shear stress showed the highest strain, indicating that softer tissue is present in those regions. The downstream regions of the plaques showed both low shear stress and low strain values, indicating the stiffer material is present there. In this study we report how these strain values change over a 6-month period, and if changes in strain are related to shear stress.
Materials and methods
Patients
The present investigation was a sub-study of the Integrated Biomarker and Imaging Study (IBIS), a single centre, prospective, non-randomised observational study13. Patients with stable angina, silent ischaemia or an acute coronary syndrome, referred for percutaneous coronary intervention, were eligible. The aim of the IBIS study was to assess non flow-limiting lesions using invasive and non-invasive imaging techniques in conjunction with biomarkers in a coronary artery, other than the artery that was the target for intervention. At 6-month follow-up, invasive imaging was repeated in the study vessel. Baseline and follow-up data were successfully obtained in eight arteries from seven patients. The institutional medical ethics committee approved the study protocol, and all patients gave written informed consent to participate in this study.
Baseline imaging
The baseline imaging procedure and data analysis have been described in detail previously12. Briefly, we combined biplane angiography and IVUS, a technique dubbed ANGUS14, to obtain the 3D reconstruction of the lumen and vessel wall of the coronary artery. An ECG-gated stepped pullback with a sheath-based rotating IVUS catheter (UltraCross 2.9 or CVIS Atlantis; Boston Scientific, Natick, MA, USA) was performed and the IVUS grey scale images were stacked on the 3D catheter path, which we obtained from the biplane angiographic recordings. The contours delineating the blood-intima interface and the lamina elastica externa were drawn in the IVUS images to determine lumen and media-bounded area. The wall thickness was defined by the distance between the contours of lumen and media-bounded area.
The 3D lumen reconstruction served to generate a finite element mesh. We combined the mesh with patient-derived flow and blood viscosity data to compute the shear stress distribution by computational fluid dynamics (SEPRAN; Sepra BV, The Hague, The Netherlands). Details regarding the computation of the shear stress distribution can be found elsewhere6.
Palpography data were acquired during a second continuous pullback with a commercially available IVUS catheter (20 MHz Avanar; Volcano Therapeutics, Volcano Corp., Rancho Cordova, CA, USA). The strain data from the palpography acquisition can be used as a surrogate marker of plaque composition9-11.
Since the 3D lumen data and the strain data were obtained with different IVUS catheters, the two data sets had to be registered carefully. We used side branches and calcified spots to match the two IVUS image stacks.
Follow-up imaging
Palpography was repeated in the study vessel at the 6-month follow-up procedure. Strain data were normalised by the average pressure drop, similar to the baseline procedure12. Anatomical landmarks were used to match the baseline and follow-up strain data13. The strain data at follow-up were subtracted from those at baseline to obtain the change in strain (∆strain). The ∆strain represents the change in the mechanical properties of a plaque region: if ∆strain is positive, the measured strain increases over time, and the plaque region can be assumed to have grown softer during the follow-up period. If the value ∆strain is negative, strain at follow-up is lower than at baseline, and the plaque region presumable got stiffer over time. The matching procedure allows us to assess the relationship between shear stress at baseline and change in strain over time.
Data analysis and statistics
The data analysis procedure for the baseline imaging is described in detail elsewhere12. Briefly, segments between side branches were selected. The wall thickness data was used to identify plaques. Locations where wall thickness was larger than 20% of the local diameter of the artery were labelled as plaque. At minimal lumen area at the plaque, various morphometric plaque parameters were determined: plaque burden (plaque burden = [vessel area – lumen area]/ vessel area * 100%), area stenosis (area stenosis = [lumen area at the reference cross section – lumen area]/lumen area at the reference cross section * 100%) and remodelling (remodelling = [vessel area – vessel at the reference cross section]/vessel area at the reference cross section * 100%). The reference cross section was defined as the cross section with the largest lumen area in the segment that contained the plaque.
Subsequently, the plaques were divided into regions: upstream, throat, downstream and lateral shoulders. The regions covered the complete plaque. The average shear stress at baseline and strain at baseline and follow-up values were determined for each plaque and in each region. To compare the data from all the plaques, we followed the procedure from our previous investigation12 and divided the baseline shear stress values from all the plaque regions into tertiles. The plaque regions were labelled as “low”, “medium”, or “high” depending on the average shear stress value. The data of all the plaques were pooled, and the average strain and ∆strain for each shear stress tertile was computed.
One-way ANOVA with post hoc testing was applied to compare mean values. Regression analyses were applied to study the relationship between shear stress and ∆strain per plaque. The ∆strain per shear stress tertile was compared to zero using a t-test. P-values smaller than 0.05 were considered to be statistically significant. All statistical analyses were carried out with SPSS, version 11.3 (SPSS Inc., Chicago, IL, USA).
Results
Baseline imaging
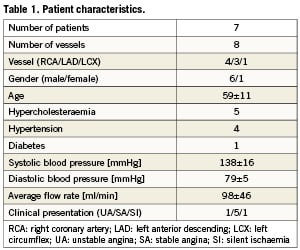
We identified 17 plaques in eight coronary arteries from seven patients. The patient characteristics are given in Table 1. The patients are a subpopulation from our previous study12 and the baseline morphometric, shear stress and strain data did not significantly differ from the previously reported results. The main data from baseline imaging in subpopulation in the current study are summarised below.
Average and maximum plaque thickness was 0.47±0.07 mm and 0.98±0.31 mm, respectively. Average plaque length was 5.8±2.1 mm. The plaques had an average plaque burden of 54±16%, an average area stenosis of 41±24%, and positive remodelling was observed (11±10%). The average plaque burden at the reference cross section was 14±6%.
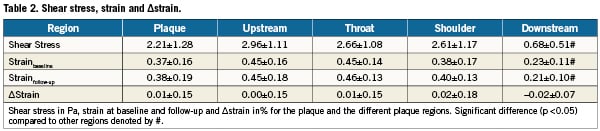
The average strain over the plaques was 0.37±0.16%. Both shear stress and strain were significantly (p<0.05) lower in the downstream region compared to the other regions (Table 2). Upstream, shoulders and throat were exposed to similar shear stress and strain levels. After dividing shear stress per plaque into tertiles, we found that the average strain values increased significantly (p<0.05) for increasing shear stress: for low, medium and high shear stress, the average strain was 0.23±0.10%, 0.40±0.15% and 0.60±0.18%, respectively.
Follow-up imaging
The average strain at follow-up over the plaque was 0.38±0.19%, resulting in an average ∆strain of 0.01±0.15%. The average strain values in the upstream, throat, shoulder and downstream region were 0.45±0.18% 0.46±0.18%, 0.40±0.13% and 0.21±0.10%, respectively. The strain value in the downstream region was significantly lower than in the other regions. The resulting ∆strain values were 0.00±0.15%, 0.01±0.15%, 0.02±0.18% and –0.02±0.07%. The ∆strain values did not differ significantly from each other or from zero (Table 2).
Shear stress versus ∆strain
The relationship between average shear stress at baseline and change in strain for each plaque separately was investigated using regression analysis. An illustration for one plaque is seen in Figure 1 in which we show the average shear stress at baseline and the average ∆strain for the plaque regions. The regression line shows a positive slope: regions exposed to low shear stress at baseline correspond to low ∆strain and ∆strain increases with increasing shear stress. From the 17 plaques, 12 showed a positive relationship between shear stress and ∆strain. The average slope for all the plaques was 0.05±0.09%/Pa (p=0.06).
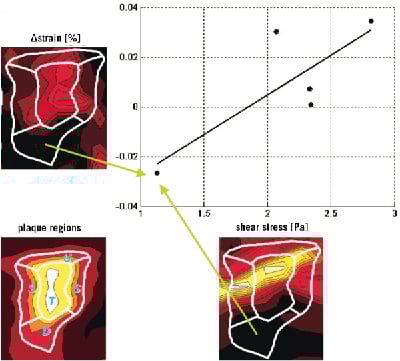
Figure 1. An example of the average shear stress versus ∆strain in the different regions covering a plaque. The plaque regions are illustrated in lower left panel, and the ∆strain and shear stress distribution that the plaque is exposed to is given in the top left and lower right panel, respectively. After averaging the data for each region, we observed that the downstream region is exposed to low shear stress and negative ∆strain values were measured at that location (green arrow). In the other regions, the measured ∆strain increased with the shear stress the regions were exposed to.
After dividing the shear stress into tertiles, we found that plaque regions in the lowest shear stress tertile were exposed to a shear stress of 0.48±0.22 Pa and ∆strain in the lowest shear stress tertile was –0.01±0.06%. Plaque regions in the medium shear stress tertile were exposed to an average shear stress of 1.52±0.37 Pa with an average ∆strain of -0.01±0.07% and plaque regions in the highest shear stress tertile were exposed to an average shear stress of 3.93±1.53 Pa with an average ∆strain of 0.04±0.08% (Figure 2). The ∆strain for the three shear stress tertiles were not statistically different from each other. The ∆strain in the highest shear stress tertile was significantly different from zero (p<0.05), indicating that the strain increased over time in the plaque regions exposed to the highest shear stress values.
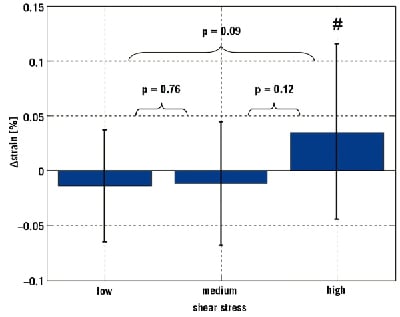
Figure 2. Average ∆strain at the three shear stress level. The number sign (#) denotes average ∆strain value is significantly different from zero at a p <0.05 level.
Discussion
The current study is the first to provide in vivo data of the local changes of strain over plaques in human coronary arteries over a 6-month period and how these changes are related to shear stress. The average strain value over a plaque remained constant, indicating that the overall composition of the plaques did not change. This is in agreement with previously reported results from the IBIS trial15: a similar patient group did not show a significant change in the number of high strain spots. The combination of the short follow-up period and the fact that most of the population was already subjected to medical treatment is probably responsible for this observation. We did not observe significant differences in the change in strain for the separate plaque regions. However, the majority of the plaques showed a positive correlation between shear stress and change in strain. When discarding the regional information and focusing on the effect of shear stress on strain, we did find a significant effect. Plaque regions exposed to low and medium shear stress values did not show any changes in strain over time, while plaque regions exposed to the highest shear stress showed asmall but significant increase in strain, indicating that those plaque regions got softer over time.
During the early phase of atherosclerotic disease, plaques are exposed to low shear stress. At a certain point during plaque build-up in the arterial wall, compensatory remodelling fails and the plaque will encroach into the lumen16, and certain plaque regions will be exposed to increased levels of shear stress. These changes in shear stress might trigger various endothelium-mediated mechanisms, which can influence plaque composition. A review of possible mechanisms was presented by Slager et al2, and a challenging hypothesis presented in that review deals with vulnerable plaques17: if the cap of a vulnerable plaque is exposed to increased shear stress levels, this may induce cap thinning through NO and plasmin related pathways, and thus contribute to enhanced plaque vulnerability. The results of our study are in line with this hypothesis: plaque regions exposed to elevated shear stress show an increase in strain over time and high shear stress might be involved in destabilising advanced atherosclerotic plaques. Which of these processes plays a role –and what the contribution of each of these pathways is– cannot be resolved based on the current study. The pathways have to be identified if we want to explore therapeutic interventions to counteract the effect of high shear stress on advanced plaques: animal experiments, e.g., in the mouse model from Cheng et al6, seem to be the appropriate way to achieve this.
Other clinical studies are in line with the current findings. Most of these studies use a surrogate –often geometrical– marker for shear stress. Lovett et al18 observed that plaque rupture in carotid arteries predominantly occurs in the upstream region –presumably exposed to high shear stress– of the plaque compared to the downstream region. Similar findings were reported by Fuji19, who used IVUS to detect plaque ruptures in coronary arteries. In a case study, Groen et al20 reported an association between high shear stress and the rupture location in the internal carotid artery. This observation was confirmed in the carotid artery in a patient study recently21. Fukumoto et al reported an association between elevated shear stress and location of plaque rupture of culprit lesions in human coronary arteries22. All of these observational studies imply that there is an association between elevated shear stress and plaque destabilisation. Combined with systemic23 and local markers of plaque vulnerability (e.g., cap thickness and lipid pool size24 and the presence of microcalcifications25) elevated shear stress might be a relevant factor to include in the assessment of risk of plaque rupture.
Chatzizisis et al7 investigated the progression of atherosclerotic plaques in coronary arteries of diabetic pigs. They observed significant plaque growth, and the largest plaques with a vulnerable phenotype developed in the segments that were exposed to the lowest baseline shear stress. This seems to be in conflict with the results from the present study, since we report an association between high shear stress and plaque vulnerability. However, the two studies represent different phases of the disease: they investigated how plaques develop in arteries with no initial disease and we studied human coronary arteries in more advanced atherosclerosis. The plaques in our study show lumen narrowing at baseline, resulting in elevated shear stress levels over these plaques. In this respect, the plaques in our study differ from those investigated in the pig study. Since the plaques represent different phases of the disease and are exposed to different shear stress distributions, the effect of shear stress on plaque composition is likely to be different.
Limitations
The current study suffers from certain limitations. First, the number of plaques in the current study is small. In the previous study, we argued that our patient population at baseline represents the total IBIS population12. We were able to have images of 68% of the coronary arteries for the follow-up procedure, a follow-up rate that is also reported for the complete IBIS trial. Unfortunately, only 55% of the plaques could be followed over time, since the region of interest could not be matched completely in all the arteries. More extensive studies, if possible with a longer follow-up period, are needed to further investigate the impact of shear stress on changes in plaque composition. Increasing the number of patients and plaques would also enable us to investigate several other interesting topics, including whether the amount of luminal narrowing influences the observed relationship between shear stress and ∆strain. Second, compared to the previously reported baseline study12, there was additional matching involved: the strain at baseline had to be matched to the strain at follow-up, leading to additional uncertainties in the resulting change of strain. We recently demonstrated that the uncertainties introduced during the matching procedure from the baseline data do not significantly influence the relationship between shear stress and markers of atherosclerosis26. The matching of the strain data from baseline and follow-up are the same order as the ones previously reported15, which implies that we do not expect the overall results to be influenced by them. Third, we used palpography as a measure for plaque composition. Although intensive in vitro and in vivo validation of this technique was performed, palpography does not measure plaque composition directly. Other emerging techniques, including spectroscopic27 and optical techniques28 might provide useful additional information to study the relationship between shear stress and plaque composition. Finally, although the overall results of the IBIS trial indicate that the average geometrical features of the coronary arteries in this study did not change over time15, it cannot be excluded that some plaques were subjected to sudden changes in lumen and plaque dimensions which might have changed the shear stress distribution over these plaques during the follow-up period.
Conclusions
We demonstrated that in human coronary arteries average changes in strain over the plaque and in the different plaque regions were minimal over a 6-month period. However, if we consider plaque regions exposed to the highest shear stress at baseline, we observed a significant increase in strain, indicating that these plaques regions got softer over time.
Conflict of interest statement
The authors have no conflict of interest to declare.