Abstract
Aims: Repetitive, fluctuating stress is an important biomechanical mechanism that underlies the rupture of atherosclerotic plaques. We developed a novel coronary angiography-based method for in vivo four-dimensional analysis of dynamic superficial wall stress (SWS) in coronary plaques and applied it for the first time in two clinical cases. Our aim was to investigate the potential relationship between dynamic stress concentration at baseline and plaque rupture during acute coronary syndrome (ACS) several months later.
Methods and results: Three-dimensional angiographic reconstructions of the interrogated arteries were performed at several phases of the cardiac cycle, followed by finite element analysis to obtain the dynamic SWS data. The peak stress at baseline was found at the distal and proximal lesion longitudinal shoulders, being 121.8 kPa and 98.0 kPa, respectively. Intriguingly, in both cases, the sites with the highest SWS concentration at baseline co-registered with the location of plaque rupture during ACS, respectively six and 18 months after the baseline angiographic assessment.
Conclusions: A novel angiography-based analysis method for four-dimensional evaluation of dynamic SWS was feasible for investigating plaque biomechanical behaviour in vivo. Initial experience suggests that this technique could be useful in exploring mechanisms of future plaque rupture.
Introduction
Coronary plaque rupture is often caused by a tear in a fibrous cap that is weakened by inflammation and unable to resist mechanical stress which causes biomechanical fatigue1-3. Angiography does not depict plaques or provide information on vulnerability, but the dynamic image sequences provide valuable additional information on the cyclic movement of lumen contours. This characterises plaque deformation performance that might differ between vulnerable lesions and mechanically stable segments. We therefore developed a novel approach for four-dimensional (4D) biomechanical analysis under realistic displacement loads, combining finite element analysis with serial angiographic reconstructions, and assessed the relationship between stress concentrations in the superficial vessel wall and later location of plaque rupture.
Methods
This proof-of-concept study used coronary angiography recordings of two patients who underwent angiography and who, several months later, developed acute coronary syndromes (ACS), assessed with repeat angiography and optical coherence tomography (OCT). Patients were retrospectively identified from a database of Fujita Health University Hospital, Toyoake, Japan. The local ethics committee approved this study; patients provided written informed consent.
CASE 1
A 50-year-old man with a mild-to-moderate mid-LAD lesion (Figure 1, Moving image 1) showed deterioration to a severe stenosis after six months (Moving image 2). OCT revealed thrombi, plaque ruptures and a partially healed rupture at the distal lesion border.
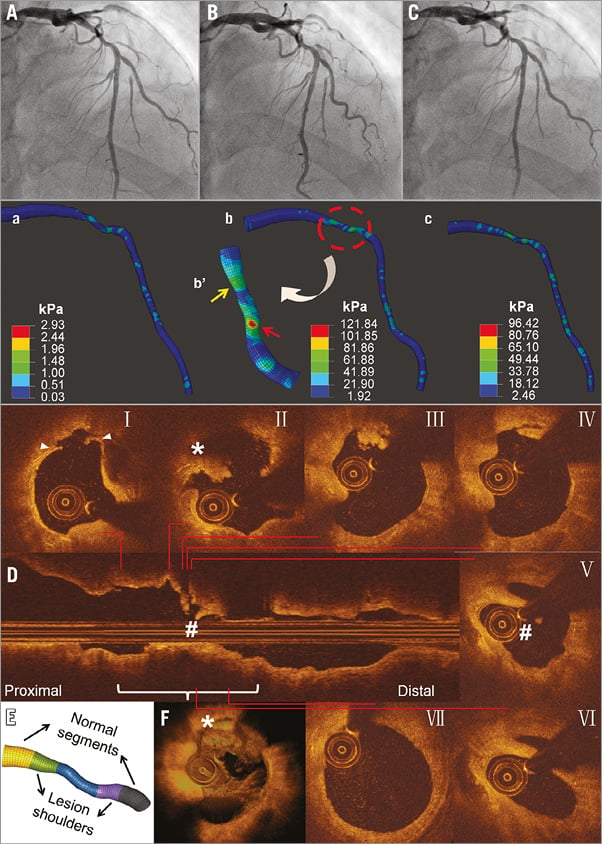
Figure 1. Angiography and SWS at baseline, and OCT imaging during ACS after six months (Case 1). Baseline angiography at different phases of the cardiac cycle (A-C) shows mild-to-moderate mid-LAD lesion (Moving image 1). SWS distributions at corresponding cardiac phases (a-c) reveal high values at mid-lesion and distal-lesion shoulder (Moving image 5) with more local SWS concentrations in the stenotic segment, particularly in distal lesion shoulder (arrow; flipped view b’). During ACS, transversal OCT images (I-VII) and longitudinal (D) and 3D OCT reconstruction (F) show thrombus and plaque rupture (I-IV), and partly healed ruptured plaque (V-VI). The spot with high SWS concentration at baseline (red arrow, b’) corresponds with rupture site (II). E) Definition of segments of interest.
CASE 2
A 69-year-old man with an intermediate mid-LCx lesion (Figure 2, Moving image 3) showed progression to a severe mid-LCx lesion 18 months later (Moving image 4). OCT showed thrombi.
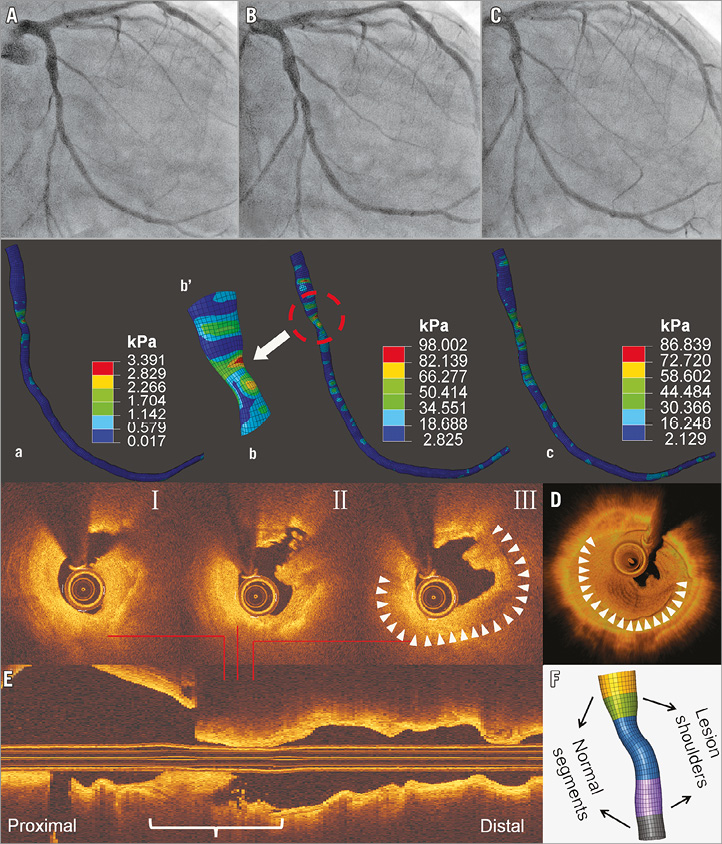
Figure 2. Angiography and SWS at baseline, and OCT imaging during ACS after 18 months (Case 2). Baseline angiography shows a mild-to-moderate mid-LCx lesion (A-C). SWS distributions at corresponding phases of the cardiac cycle (a-c) reveal high SWS at mid-lesion and proximal lesion shoulder (Moving image 6), with more local SWS concentrations in stenotic segment - mainly in proximal lesion shoulder (arrow; zoomed view b’). During ACS, OCT (I-III) and 3D (D) and longitudinal OCT reconstructions (E) reveal lumen irregularity, thrombus, and plaque rupture. The spot with the highest SWS concentration at baseline corresponds with rupture site (I-III). F) Definition of segments of interest.
Three-dimensional (3D) lumen geometries at different cardiac phases were reconstructed with QAngio XA 3D RE (Research Edition) (Medis Specials bv, Leiden, the Netherlands)4 and were used to perform finite element analysis (Supplementary Appendix 1). Historical data5 were utilised for material characteristics. Dynamic (4D) superficial wall stress (SWS) was calculated with Abaqus (V6.13, SIMULIA™; Dassault Systèmes® Simulia Corp., Johnston, RI, USA). The von Mises stress, that takes into account all stresses in three principal axes, was used to report SWS.
Results
Angiographic reconstructions were performed at mid-diastole, end-diastole, and end-systole. In case 1, the reconstructed lesion segment showed the following cyclic changes from end-diastole to end-systole: segment length 104.3 mm-101.3 mm; minimal lumen area 2.45 mm2-2.15 mm2; and percent diameter stenosis 52%-55%. In case 2, corresponding changes were: 112.1 mm-106.1 mm; 3.32 mm2-2.94 mm2; and 50%-52%. The peak and time-averaged SWS were significantly higher in lesion segments than in non-culprit vessels (Supplementary Table 1). SWS measurements in non-culprit vessels were similar to those in reference segments.
In case 1, SWS concentrations were highest at mid-lesion and distal lesion shoulder (Figure 1, Moving image 5). Peak SWS (121.8 kPa) was found during end-systole (distal lesion shoulder). During the entire cardiac cycle, the distal lesion shoulder showed the highest time-averaged SWS (18.7 kPa), followed by mid-lesion (15.7 kPa). In case 2 (Figure 2, Moving image 6), more stress concentrations were observed at the proximal lesion shoulder: highest peak and time-averaged SWS were 98.0 kPa and 23.5 kPa. In both cases, spots with the highest SWS at baseline co-registered with sites of subsequent rupture. Furthermore, locations of strain concentration in lesion segments were consistent with subsequent plaque rupture sites (Supplementary Figure 1). Further results are presented in Supplementary Appendix 2.
Discussion
This novel approach for the analysis of spatial and temporal variations in coronary anatomy by use of the finite element method can analyse dynamic SWS in vivo. In two clinical cases, sites with high SWS concentrations at baseline co-registered with sites of later plaque rupture.
Repetitive and fluctuating stress leads to material fatigue, and the balance between plaque structural stress and local strength of the superficial vessel wall determines where plaque rupture occurs. Some patient-specific computational methods have been proposed to compute plaque structural stress6-8. These approaches require plaque scanning and comprehensive data on the material properties of all plaque components9 and apply only static analyses of plaque structural stress, resulting in unrealistic representations of time-varying (cyclic) stress distribution.
Our present approach requires neither plaque segmentation nor data on complex plaque material properties or dynamic blood pressure changes. The rationale is as follows: the complex biomechanical and physiological interactions involving plaque material property, cyclic blood pressure, vessel stretching, bending, and twisting determine altogether the lumen change during cardiac contraction10. By subtracting changes in lumen dimensions over time and applying this in the finite element analysis (using the displacement loading method instead of the conventional mechanical force loading method5,11), our approach indirectly incorporates these complex biomechanical and physiological interactions in the analysis. This results in a practical approach to compute stress on the superficial arterial wall layer that, if present, includes the fibrous cap. We measured higher stress during systole at sites with abrupt changes in lumen geometry and (presumably) material properties. The results cannot be extended into the plaque core; nevertheless, they may be most relevant to assess stress distribution on fibrous caps12. Future research may address the natural history of coronary disease and the effects of novel drugs, bioresorbable scaffolds or stents on biomechanical vessel wall stability13,14. See Supplementary Appendix 3 for limitations.
Conclusions
A novel angiography-based analysis method for 4D evaluation of dynamic SWS was feasible for investigating the plaque biomechanical behaviour in vivo. Initial experience suggests that it could be useful for exploring mechanisms of future plaque rupture.
| Impact on daily practice This novel approach for 4D biomechanical analysis of spatial and temporal variations in the coronary anatomy allows the assessment of dynamic superficial wall stress in vivo. It might be useful for investigating mechanisms of plaque rupture. |
Acknowledgements
S. Tu acknowledges support by The Program for Professor of Special Appointment (Eastern Scholar) at Shanghai Institutions of Higher Learning (No. TP2015014) and the Shanghai Pujiang Program (No. 15PJ1404200).
Funding
This work was supported by the National Key Research and Development Program of China (No. 2016YFC0100500) and the National Natural Science Foundation of China (No. 31500797 and 81570456).
Conflict of interest statement
C. von Birgelen has received lecture fees from AstraZeneca; his institution has received research grants, provided by AstraZeneca, Biotronik, Boston Scientific, and Medtronic. Y. Li is an employee of Medis. N. Holm has received speaker fees from St. Jude Medical, Biotronik and Terumo, and institutional research grants from St. Jude Medical, Terumo, Boston Scientific, Medtronic, Biotronik, Medis and Cordis. J. Reiber is the CEO of Medis. S. Tu has received a research grant from Medis. The other authors have no conflicts of interest to declare.
Supplementary data
Supplementary Appendix 1. Methods.
Supplementary Appendix 2. Additional results.
Supplementary Appendix 3. Limitations.
Supplementary Table 1. Peak and time-averaged superficial wall stress (SWS) in culprit lesion and non-culprit vessel segments.
Supplementary Figure 1. Strain distribution of both cases at corresponding phases of peak stress at baseline.
Moving image 1. Coronary angiogram of the LAD lesion at baseline (Case 1).
Moving image 2. Coronary angiogram of the LAD lesion at the time of ACS episode (Case 1).
Moving image 3. Coronary angiogram of the LCx lesion at baseline (Case 2).
Moving image 4. Coronary angiogram of the LCx lesion at the time of ACS episode (Case 2).
Moving image 5. Dynamic superficial wall stress of the LAD lesion during cardiac contractions (Case 1).
Moving image 6. Dynamic superficial wall stress of the LCx lesion during cardiac contractions (Case 2).
Supplementary data
To read the full content of this article, please download the PDF.
Coronary angiogram of the LAD lesion at baseline (Case 1).
Coronary angiogram of the LAD lesion at the time of ACS episode (Case 1).
Coronary angiogram of the LCx lesion at baseline (Case 2).
Coronary angiogram of the LCx lesion at the time of ACS episode (Case 2).
Dynamic superficial wall stress of the LAD lesion during cardiac contractions (Case 1).
Dynamic superficial wall stress of the LCx lesion during cardiac contractions (Case 2).