Abstract
Background: The lipid-to-cap ratio (LCR) and thin-cap fibroatheroma (TCFA) derived from optical coherence tomography (OCT) are indicative of plaque vulnerability.
Aims: We aimed to explore the association of a novel method to estimate radial wall strain (RWS) from angiography with plaque composition and features of vulnerability assessed by OCT.
Methods: Anonymised data from patients with intermediate stenosis who underwent coronary angiography (CAG) and OCT were analysed in a core laboratory. Angiography-derived RWSmax was computed as the maximum deformation of lumen diameter throughout the cardiac cycle, expressed as a percentage of the largest lumen diameter. The LCR and TCFA were automatically determined on OCT images by a recently validated algorithm based on artificial intelligence.
Results: OCT and CAG images from 114 patients (124 vessels) were analysed. The average time for the analysis of RWSmax was 57 (39-82) seconds. The RWSmax in the interrogated plaques was 12% (10-15%) and correlated positively with the LCR (r=0.584; p<0.001) and lipidic plaque burden (r=0.411; p<0.001), and negatively with fibrous cap thickness (r= −0.439; p<0.001). An RWSmax >12% was an angiographic predictor for an LCR>0.33 (area under the curve [AUC]=0.86, 95% confidence interval [CI]: 0.78-0.91; p<0.001) and TCFA (AUC=0.72, 95% CI: 0.63-0.80; p<0.001). Lesions with RWSmax >12% had a higher prevalence of TCFA (22.0% versus 1.5%; p<0.001), thinner fibrous cap thickness (71 μm versus 101 μm; p<0.001), larger lipidic plaque burden (23.3% versus 15.4%; p<0.001), and higher maximum LCR (0.41 versus 0.18; p<0.001) compared to lesions with RWSmax ≤12%.
Conclusions: Angiography-derived RWS was significantly correlated with plaque composition and known OCT features of plaque vulnerability in patients with intermediate coronary stenosis.
Introduction
Notwithstanding the relentless development of alternative diagnostic tools and techniques, coronary angiography (CAG) remains the cornerstone for the diagnosis of coronary artery disease (CAD). All other diagnostic modalities aim to identify patients who should be referred for CAG or undergo additional intracoronary imaging and physiological evaluation to further refine the CAG findings. CAG detects the presence of atherosclerotic plaque based on the imprint left on the vessel contour, but it offers limited information about prognostically important plaque composition and features of vulnerability12.
Coronary strain, defined as the deformation caused on the vessel wall by the circumferential tensile stress derived from the pulsatile arterial pressure, is directly dependent on the tissue stiffness and hence on the plaque composition3456. Plaque components associated with vulnerability, like the presence of lipids or macrophages, result in high strain values, whilst plaque components stabilising the plaque, like fibrous tissue or calcium, result in low strain values3567. Therefore, the presence of high-strain spots in the coronary arteries might estimate the plaque propensity to cause an acute coronary syndrome8. Under these premises, a reduction of high-strain spots after medical treatment has been considered as a surrogate for reduction of the lipidic plaque burden (LPB) and stabilisation of the plaque91011. Coronary strain can be calculated by means of elastography and palpography, both methods based on intravascular ultrasound (IVUS)34568. Coronary angiography can, however, estimate superficial wall strain and stress (SWS)1213, which consists of 4 different vectors, one of them being radial wall strain (RWS)14, but this approach requires a substantially complex and time-consuming methodology, including the analysis of 2 angiographic views without vessel overlap, which is not always possible.
Based on our findings from a previous finite element analysis study15, a novel method was proposed to directly calculate RWS from a single angiographic projection. Aided by artificial intelligence (AI), RWS can provide a simplified and cost-effective tool to assess the biomechanical characteristics of the underlying plaque. We have recently shown that an optical coherence tomography (OCT)-derived lipid-to-cap ratio (LCR)>0.33, as an index of plaque vulnerability, could identify patients at high risk of adverse cardiovascular events caused by non-culprit plaque at the index procedure16. Encouraged by these promising findings, we are now evaluating the association of RWS with plaque composition, the LCR and other vulnerability indices by OCT.
Methods
Study design and patient population
Post hoc analysis of imaging data from a previously published single-centre study17 included all patients undergoing coronary angiography, fractional flow reserve (FFR) and OCT examination of non-culprit stenoses at Wakayama Medical University Hospital (Wakayama, Japan). Intracoronary nitroglycerine was systematically given to patients prior to angiography. Patients were excluded if balloon predilatation was performed prior to OCT imaging. For inclusion, the index lesions had to meet the following angiographic criteria: 1) lie in one of the 3 main coronary arteries; 2) intermediate stenosis; 3) a reference lumen diameter ≥2 mm. Index lesions were excluded from the analysis if: 1) tandem lesions, diffuse stenoses or in-stent restenosis in the interrogated vessels were present; 2) there was insufficient angiographic image quality, including full contrast filling less than 1 cardiac cycle, excessive overlap, foreshortening, or severe distortion; 3) OCT did not cover the entire lesion; 4) myocardial bridge was detected in the interrogated vessel; 5) vessel spasm or injury during OCT imaging was present; 6) there was insufficient OCT image quality including poor lumen visibility or severe artefacts; or 7) substantial thrombosis was identified by OCT.
Anonymised angiographic and OCT images were analysed at an independent core laboratory (CardHemo, Med-X Research Institute, Shanghai Jiao Tong University, Shanghai, China) by experienced analysts. The investigators analysing the angiography were blinded to the OCT results and vice versa.
The institutional review board of Wakayama Medical University approved the post hoc analysis of the data for this study and informed consent was waived. The study was conducted in accordance with the Declaration of Helsinki and the principles of Good Clinical Practice for human research.
CAG and OCT image acquisition
Angiographic images were obtained at 15 frames/sec on monoplane or biplane X-ray angiogram (Allura Xper FD10; Philips).
OCT images were acquired with frequency-domain OCT systems (ILUMIEN or OPTIS; Abbott) at a frame rate of 100 or 180 frames/sec, respectively, using a non-occlusive technique.
RWS and angiographic analysis
Analysis of angiography-based RWS and quantitative coronary angiography (QCA) was performed with AngioPlus Core software version 3.0 (Pulse Medical), following standard operating procedures (Supplementary Appendix 1). The analyst selected the angiographic projection at end-diastole with minimal overlap and foreshortening for lesion analysis. Then, the software automatically selected 3 other frames with the least motion artefact at different periods of the cardiac cycle coregistered with electrocardiogram (ECG): early-systole, end-systole and mid-diastole. The lumen contours of the interrogated vessels were automatically delineated on these selected frames by means of AI and coregistered with the lumen contours at the other corresponding frames, thus generating a map of lumen diameters along the interrogated segments throughout the cardiac cycle; i.e., the lumen diameters of different cardiac phases were matched at every longitudinal position of the interrogated vessel (Central illustration A). RWS was calculated as the relative diameter deformation over the cardiac cycle for each position:
RWS=(largest diameter − smallest diameter)/largest diameter
Lesion RWS (dimensionless) was defined as the maximum RWS (RWSmax) along the interrogated lesion.
Colocalisation between angiographic RWSmax and OCT-derived maximum LCR
CAG and OCT images were coregistered using the methodology that has been previously reported and validated 18. Briefly, the lumen dimensions at different positions and their relative distances from each automatically detected side branch were extracted as input for a non-rigid point matching algorithm, which was able to correct for the non-linear longitudinal movement of the OCT image catheter caused by cardiac motion. This method showed a coregistration accuracy of 96%, with a median geographic matching error of 0.32 mm (interquartile range [IQR]: 0.00-0.56 mm) in our previous study using the same dataset 18 (Central illustration B). After the coregistration, each longitudinal position of the OCT cross section was matched to an angiographic centreline point. Each plaque was divided into 3 segments along the longitudinal axis according to OCT images: throat segment, including the MLA position and the stenotic segments extending 1.5 mm proximal and 1.5 mm distal to the MLA; and proximal and distal stenotic segments (Central illustration B), defined as the upstream and downstream regions of the throat segment, up to the boundary between the plaque and the normal segment. Finally, the RWS and LCR within the same coregistered segment were separately and independently evaluated on CAG and OCT images (Central illustration B).
OCT analysis
Lumen morphology and plaque characterisation were automatically analysed from OCT images using AI-assisted software, OctPlus version 2.0 (Pulse Medical), as previously described 19. Briefly, the lumen contours of the coregistered OCT cross sections were automatically delineated and the contour of the internal elastic lamina (IEL) was then identified or extrapolated from adjacent cross sections and prior knowledge of the shape of the media layer. The plaque composition for each OCT cross section was then automatically analysed and delineated in the region encompassed between the IEL and the lumen contour, using AI. Plaque burden was defined as the surface of the IEL minus the lumen surface per cross section. The proportions of lipids, fibrous tissue and calcium within the plaque were then calculated per cross section and expressed as volumes from the 3D reconstruction 19.
The following parameters of plaque vulnerability were automatically derived from the quantitative plaque characterisation in each cross section: fibrous cap thickness (FCT); lipid angle, defined as the angle encompassed by the lipid arc, measured from the gravitational centre of the lumen; LPB, defined as the proportion of lipidic plaque surface related to the IEL surface; and LCR, defined as LPB divided by FCT16 (Central illustration C). The plaque LCR was defined as the maximum LCR along the interrogated plaque. Plaques with an FCT <65 μm and lipid angle >180° were defined as thin-cap fibroatheroma (TCFA), according to previously reported criteria2. In addition, other validated and prognostically relevant OCT features of plaque vulnerability were measured, including FCT <65 μm, minimum lumen area (MLA) <3.5 mm2, lipid arc >180° and plaque burden >70%12.
With the same software, the so-called optical flow ratio (OFR) was obtained to quantify the physiological significance of coronary stenosis. We have previously shown that the OFR correlates closely with wire-based FFR172021.
Statistical analysis
Descriptive statistics for continuous variables were expressed as mean±SD, if normally distributed, or as median (IQR), if not. Categorical variables were reported as number (percentage). Clinical characteristics were analysed on a per-patient basis, while plaque descriptors were reported on a per-vessel basis. Normal distribution was tested with the Shapiro-Wilk test. Correlation was evaluated using the Pearson correlation, if the variables were normally distributed, otherwise by means of the Spearman correlation. The chi-square test was used for distribution difference between the RWSmax and maximum LCR. Diagnostic performance was evaluated using the area under the curve (AUC) by receiver operating characteristic (ROC) analysis. The Youden index was used as the criterion to determine the best cut-off value of the RWSmax for the prediction of the LCR>0.3316 and TCFA. A sensitivity analysis, which divided the present study population into a derivation cohort and a validation cohort, was performed to test the consistency of the cut-off value of the RWSmax for predicting an LCR>0.33 when comparing with the result from the entire population. Inter- and intra-observer variability was assessed by means of the intraclass correlation coefficient for the absolute value (ICCa). All statistical calculations were performed with MedCalc Statistical Software version 19.2.6 (MedCalc Software bv). A 2-sided p-value <0.05 was considered statistically significant.
Results
Baseline clinical and lesion characteristics
Altogether, 277 patients were enrolled in the original study17, but 41 patients were excluded due to balloon predilatation prior to OCT acquisition. Therefore, images from 236 patients (298 vessels) were screened at the core laboratory. After application of the predefined inclusion and exclusion criteria, 114 patients (124 vessels) were analysed (Figure 1).
Baseline demographic and plaque characteristics are shown in Table 1 and Table 2. In the study population, 49 (43.0%) patients had prior myocardial infarction (MI), and 66 (57.9%) patients had prior percutaneous coronary intervention (PCI) in another vessel. The RWSmax in the index plaques showed a median value of 12% (IQR: 10-15%). Absolute lumen diameter change over the cardiac cycle was 0.25 (0.21-0.33) mm. Fourteen out of 124 plaques (11.3%) met TCFA criteria, and 57 plaques (46.0%) had LCR>0.33. The average time for analysis of the RWSmax after selecting the angiographic image run was 57 (39-82) seconds.
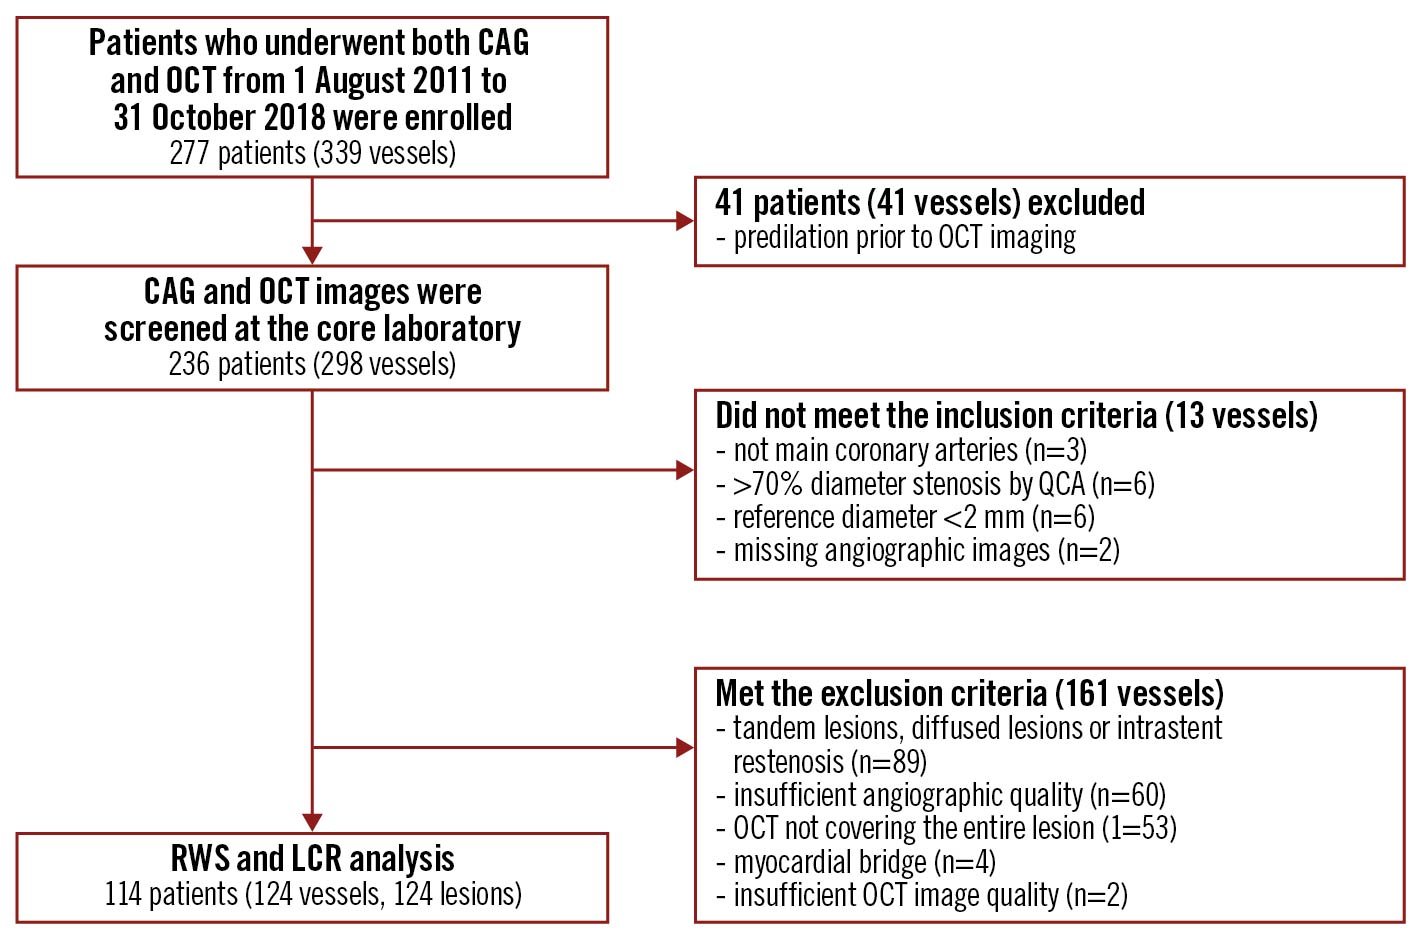
Figure 1. Study flow chart. CAG: coronary angiography; LCR: lipid-to-cap ratio; OCT: optical coherence tomography; QCA: quantitative coronary angiography; RWS: radial wall strain
Table 1. Baseline demographic characteristics.
| Patients (N=114) | |
|---|---|
| Patient characteristics | |
| Age*, years | 69±10 |
| Men, n (%) | 86 (75.4) |
| Diabetes mellitus, n (%) | 39 (34.2) |
| Hypertension, n (%) | 89 (78.1) |
| Hyperlipidaemia, n (%) | 82 (71.9) |
| Smoking, n (%) | 28 (24.6) |
| Family history of CAD, n (%) | 25 (21.9) |
| Previous MI, n (%) | 49 (43.0) |
| Previous PCI, n (%) | 66 (57.9) |
| Previous CABG, n (%) | 0 (0) |
| Clinical presentation | |
| Silent ischaemia, n (%) | 55 (48.2) |
| Stable angina, n (%) | 37 (32.5) |
| Unstable angina, n (%) | 12 (10.5) |
| NSTEMI, n (%) | 1 (0.9) |
| Others, n (%) | 9 (7.9) |
| *Expressed as mean and standard deviation. CABG: coronary artery bypass grafting; CAD: coronary artery disease; MI: myocardial infarction; NSTEMI: non-ST-segment elevation myocardial infarction; PCI: percutaneous coronary intervention | |
Table 2. Baseline plaque characteristics.
| Lesions (N=124) | |
|---|---|
| Vessel distribution | |
| LAD, n (%) | 72 (58.1) |
| RCA, n (%) | 18 (14.5) |
| LCx, n (%) | 34 (27.4) |
| QCA parameters | |
| Lesion length†, mm | 10.9 (7.5-13.5) |
| Diameter stenosis*, % | 35±12 |
| Reference diameter†, mm | 2.5 (1.8-3.5) |
| Minimal diameter†, mm | 1.7 (1.5-2.1) |
| RWS related | |
| Absolute lumen diameter change†, mm | 0.25 (0.21-0.33) |
| RWSmax†, % | 12 (10-15) |
| Proximal segment† | 11 (10-15) |
| Throat segment† | 14 (10-15) |
| Distal segment† | 11 (10-15) |
| OCT-related parameters | |
| Maximum lipid angle†, ° | 149 (116-197) |
| Minimum fibrous cap thickness†, µm | 90 (71-112) |
| Minimum lumen area†, mm2 | 2.05 (1.47-2.71) |
| Plaque burden*, % | 58.0±6.4 |
| Lipidic plaque burden†, % | 19.9 (14.3-24.8) |
| Fibrous plaque burden†, % | 29.3 (24.2-35.1) |
| Calcium burden†, % | 2.0 (0.7-5.3) |
| Maximum LCR† | 0.31 (0.17-0.43) |
| TCFA, n (%) | 14 (11.3) |
| *Expressed as mean and standard deviation. †Expressed as median and interquartile range. LAD: left anterior descending; LCR: lipid-to-cap ratio; LCx: left circumflex artery; OCT: optical coherence tomography; RCA: right coronary artery; RWS: radial wall strain; TCFA: thin-cap fibroatheroma | |
Correlation between RWmax, plaque composition and parameters of vulnerability
Figure 2 shows a representative example with RWSmax and plaque parameters. RWSmax moderately correlated with the LCR (r=0.584; p<0.001), LPB (r=0.411; p<0.001) and maximum lipid arc (r=0.276; p=0.002). A negative correlation was found between the RWSmax and FCT (r= -0.439; p<0.001) and fibrous plaque burden (r= -0.306; p<0.001). Conversely, no significant correlation was found between the RWSmax and calcium burden (r= -0.031; p=0.731) (Supplementary Figure 1). For lesions with different physiological characteristics (classified according to the OFR), the RWSmax and OCT variables showed similar correlations as in the total sample (Supplementary Table 1).
Lesions with an LCR>0.33 have a higher RWSmax (14% [13-16] versus 10% [9-12]; p<0.001) and larger absolute lumen diameter change (0.31 mm [0.25-0.37] versus 0.22 mm [0.19-0.26]; p<0.001), compared to lesions with an LCR ≤0.33 (Supplementary Table 2). These lesions also have a thinner fibrous cap thickness (71 μm [57-90] versus 104 μm [90-146]; p<0.001) and larger maximum lipid angle (187° [150-227] versus 122° [92-158]; p<0.001).
Conversely, lesions with an LCR ≤0.33 had more fibrous plaque (32.0% [25.4-36.6] versus 26.0% [23.0-31.0]; p<0.001) (Supplementary Table 2). Notably, in the physiologically non-significant lesions (defined by an OFR ≥0.80), an RWSmax >12%, LCR>0.33, and TCFA represented 37.5%, 40.6%, and 12.5% of this cohort, respectively (Supplementary Table 3).
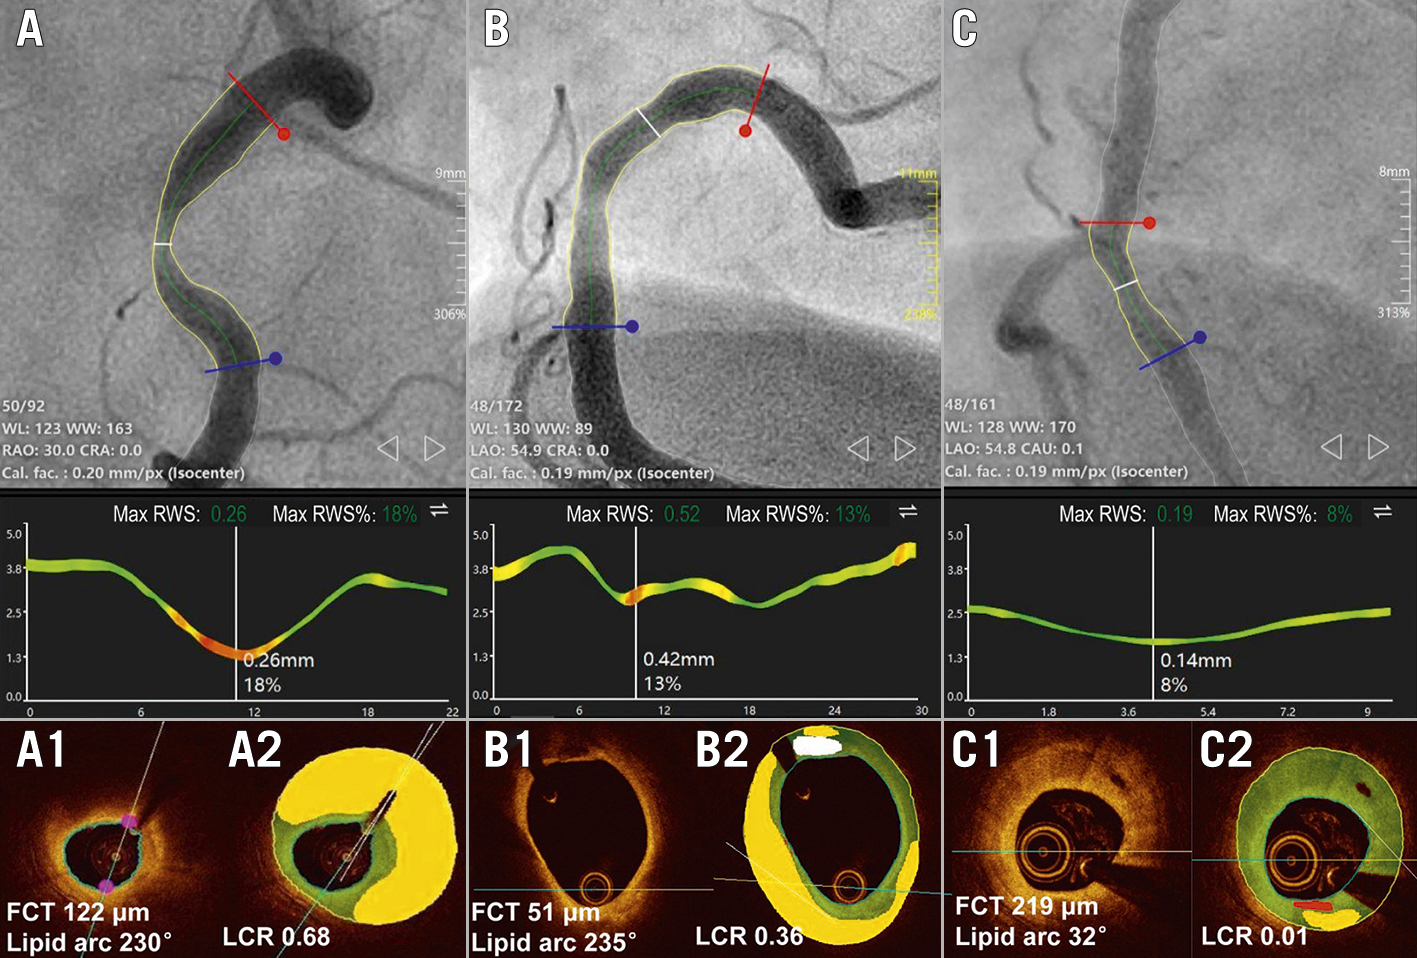
Figure 2. Representative examples of RWSmax and OCT-defined plaque characteristics. Coronary angiography showed 3 moderate lesions in the 3 RCA vessels (A, B, and C) with the corresponding RWSmax analyses and OCT plaque characterisation shown below, where the areas of lipid plaque, fibrotic tissue, calcified plaque and macrophages were presented in yellow, green, white and red, respectively. The white lines in the middle panels show the position with the RWSmax. The RWSmax derived from angiographic images was the highest for A (18%), followed by B (13%) and C (8%). OCT showed that there was a large lipid plaque but not defined as TCFA for A, while the LCR was 0.68 (A1-A2). B had TCFA but the LCR was lower than A, due to a smaller lipidic burden (B1-B2). C had the lowest LCR due to dominating fibrous plaque composition (C1-C2). FCT: fibrous cap thickness; LCR: lipid-to-cap ratio; RCA: right coronary artery; RWS: radial wall strain; TCFA: thin-cap fibroatheroma
Plaque morphology, vulnerability and computational physiology
When stratified by RWSmax, the MLA, lesion length and percent diameter stenosis (%DS) were comparable in the lesions with and without RWSmax >12%. However, lesions with RWSmax >12% had a higher prevalence of TCFA (22.0% versus 1.5%; p<0.001), thinner fibrous cap thickness (71 μm vs 101 μm; p<0.001), larger lipidic plaque burden (23.3% vs 15.4%; p<0.001), a higher maximum LCR (0.41 vs 0.18; p<0.001) and lower OFR (0.77 vs 0.83; p=0.004) compared to lesions with RWSmax ≤12% (Table 3). Lesions with an RWSmax ≤12% had more fibrous plaque.
Table 3. Comparison of plaque parameters of index lesions with different RWSmax.
| RWSmax >12% (n=59) | RWSmax ≤12% (n=65) | p-value | |
|---|---|---|---|
| Absolute lumen diameter change*, mm | 0.32 (0.25-0.37) | 0.21 (0.19-0.26) | <0.001 |
| Plaque burden*, % | 60.0 (55.4-65.0) | 56.3 (52.0-60.8) | 0.002 |
| Lipidic plaque burden*, % | 23.3 (19.4-27.4) | 15.4 (11.0-20.3) | <0.001 |
| Fibrous plaque burden*, % | 28.0 (23.6-31.5) | 31.4 (24.9-36.2) | 0.020 |
| Calcified plaque burden*, % | 2.0 (0.7-4.4) | 2.1 (0.5-6.0) | 0.779 |
| Minimum lumen area*, mm2 | 2.0 (1.3-2.5) | 2.1 (1.7-3.1) | 0.050 |
| Minimum fibrous cap thickness*, μm | 71 (58-92) | 101 (89-150) | <0.001 |
| Maximum lipid arc*, ° | 179 (134-210) | 128 (92-167) | <0.001 |
| TCFA, n (%) | 13 (22.0) | 1 (1.5) | <0.001 |
| LCR* | 0.41 (0.35-0.53) | 0.18 (0.13-0.26) | <0.001 |
| LCR >0.33, n (%) | 49 (83.2) | 8 (12.3) | <0.001 |
| OFR* | 0.77 (0.71-0.83) | 0.83 (0.76-0.87) | 0.004 |
| Lesion length*, mm | 11.4 (8.6-13.6) | 10.4 (7.4-13.1) | 0.329 |
| Diameter stenosis*, % | 36 (30-46) | 33 (26-43) | 0.120 |
| Reference diameter*, mm | 2.9 (2.4-3.1) | 2.9 (2.4-3.2) | 0.818 |
| Minimum lumen diameter*, mm | 1.7 (1.4-2.0) | 1.8 (1.6-2.1) | 0.020 |
| *Expressed as median and interquartile range. LCR: lipid-to-cap ratio; OFR: optical flow ratio; RWS: radial wall strain; TCFA: thin-cap fibroatheroma | |||
Colocalisation between RWSmax and maximum LCR
In 98 (79%) lesions, there was perfect colocalisation of segments with the RWSmax and maximum OCT-derived LCR (Supplementary Table 4). Specifically, the maximum LCR localised in the proximal segment in 36%, the throat in 43% and in the distal segment in 21%, as compared to an RWSmax in 31, 46 and 23% of the same segments (p=0.638), respectively.
Diagnostic performance of RWSmax for detecting features of plaque vulnerability
The optimal strain cut-off value for the prediction of an LCR>0.33 (AUC=0.86, 95% confidence interval [CI]: 0.78-0.91) and TCFA (AUC=0.72, 95% CI: 0.63-0.80) was an RWSmax >12%. The AUC in identifying plaques with simultaneous presence of FCT<65 μm, maximum lipid arc >180º and MLA <3.5 mm2 was 0.82 (95% CI: 0.74-0.88; p<0.001) (Figure 3). The diagnostic performance of the RWSmax with these cut-off values is shown in Supplementary Table 5. When including only non-flow limiting coronary lesions with an OFR ≥0.80 in the analysis, an RWSmax >12% also had a good accuracy in predicting an LCR>0.33 (AUC=0.80, 95% CI: 0.68-0.89) (Supplementary Figure 2). In sensitivity analysis, the best cut-off value of the RWSmax for predicting an LCR>0.33 was also found at 12%, exactly the same as the best cut-off value when using the entire study population (Supplementary Figure 3). The performance of using this cut-off value in the validation cohort showed similar performance of the RWSmax in predicting an LCR>0.33 (Supplementary Table 6).
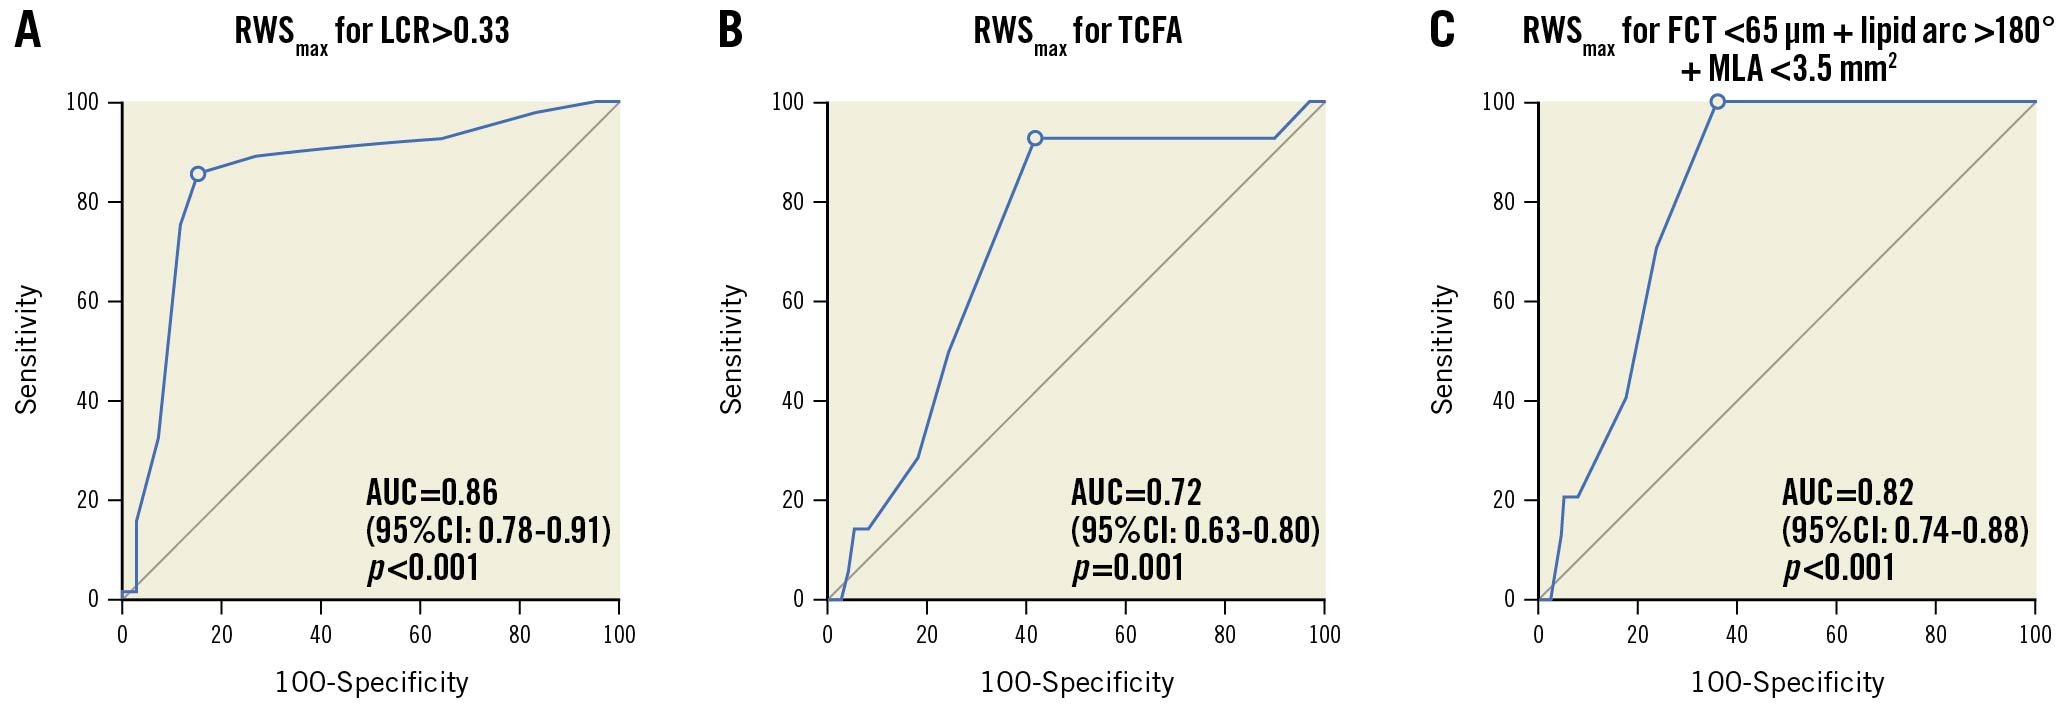
Figure 3. ROC curve analysis and predictive value of RWSmax for OCT-derived plaque parameters. AUC: area under the curve; CI: confidence interval; FCT: fibrous cap thickness; LCR: lipid-to-cap ratio; MLA: minimum lumen area: ROC: receiver operating characteristics; RWS: radial wall strain; TCFA: thin-cap fibroatheroma
Reproducibility of RWSmax
The inter- and intra-observer ICCa values of the RWSmax were 0.856 (95% CI: 0.720-0.929) and 0.926 (95% CI: 0.895-0.948), respectively.
Discussion
The main findings of this study are: 1) RWS can be estimated by means of coronary angiography when analysing the dynamic changes in diameter over the cardiac cycle and aided by artificial intelligence for the delineation of the luminal contour. 2) Plaque strain derived from CAG correlated significantly with validated features of plaque vulnerability, whilst it correlated negatively with the fibrous plaque. 3) When dividing the lesion into proximal, throat, and distal segments, the RWSmax colocalised well with the maximum LCR in the same segment. 4) In the absence of physiologically significant stenosis, roughly 1/3 of the intermediate lesions had a high RWSmax or high LCR.
Coronary strain has been calculated by IVUS-based methods hitherto, namely elastography and palpography, the latter being the elastography of the most adluminal layers of the vessel wall34568. Elasto-palpography was initially developed before the advent of virtual histology, OCT or spectroscopy and aimed to detect lipid-rich plaques that were known to be harbingers of acute coronary syndromes22. The biomechanical concept was successful, as high strain correlated with plaque elements linked to vulnerability, like lipids or macrophages, whilst low strain correlated with components linked to plaque stabilisation, like fibrous tissue or calcium3567. The presence of high-strain spots was associated with an increased incidence of acute coronary syndromes8 and a reduction of high-strain spots has been considered as a surrogate for plaque stabilisation91011. Nonetheless, the advent of other invasive techniques for detailed plaque characterisation has relegated elasto-palpography to a marginal role, with, currently, very limited use. In addition, cardiac motion artefacts remain a significant limitation to IVUS-based strain calculations, jeopardising its accuracy. Coronary strain derived from finite element analysis circumvents the above-mentioned limitations but is somehow limited by long and laborious analytical procedures. Our previously reported approach based on OCT shows a good correlation between lumen dimensional change with both plaque stress and lipid plaque area, providing the first-in-human indication that angiography-derived RWS allows the assessment of the biomechanical characteristics of the underlying plaque15. Of note, our method is supported by AI which allows an automation of many cumbersome and repetitive tasks, thus turning complex approaches that were once considered prohibitive into clinically usable methods1823. The current study is paradigmatic of the power of AI to transform medical diagnosis. The analysis of the dynamic changes in coronary luminal diameters over the cardiac cycle would require the analysis of too many angiographic frames to be performed manually, but the task becomes reliable when undertaken by an AI algorithm. The first proof-of-concept study should be validating the correspondence between angio-based RWSmax and features of plaque vulnerability. In the present study, AI was also applied for automated plaque characterisation in OCT cross sections. For OCT segments with high light attenuation precluding the unambiguous delineation of vascular structures, the media contour could be extrapolated from our deep learning algorithm by incorporating the information from adjacent OCT cross sectional images and the prior knowledge about the shape of media layer18. Recently, Gerbaud et al24 also reported increased accuracy in the quantification of plaque burden on OCT by combining adaptive attenuation compensation and exponentiation for contrast enhancement. The results of this first pilot study are highly encouraging: a high RWSmax correlates well with features of vulnerability, whilst a low RWSmax correlates well with features of stability, like fibrous tissue or FCT. Our findings are biologically plausible and in line with previous IVUS investigations of coronary strain34568. In addition, exact concordance in colocalised RWSmax and maximum LCR within each lesion was observed in 79% of cases. These findings confirm that “softer” spots with thin fibrous cap and high lipid content are deformable. However, RWS is a biomechanical parameter concurrently determined by the interaction between plaque composition and the local biomechanical environment, including heart contraction and blood pressure changes, thus resulting in modest correlations with imaging features such as lipid plaque burden and thin fibrous cap. Similar results were obtained in studies exploring correlations between other biomechanical factors (e.g., plaque structural stress) and OCT- or IVUS-derived vulnerable features681525. In addition, the angiographic images were exported with a reduced image size (512×512 pixels) for analysis, resulting in an image resolution of 0.2 mm/pixel. Of all the lesions, 11 (9%) had a high RWSmax of >12% and an absolute lumen diameter change greater than 0.4 mm, that is, a difference of more than 2 pixels. Of note, all modern X-ray angiograms have an image size ≥1,024×1,024 pixels. If the original image size could be used for RWS analysis, the spot with high RWS would have ≥4 pixels change in lumen diameter during the cardiac cycle.
The opportunity to estimate plaque wall strain from a simple diagnostic coronary angiogram reveals hidden information which can be extracted from this ubiquitous examination for the diagnosis and management of CAD. QCA, computational physiology262728 and SWS121314 have provided additional angiographic content, with a potential impact on clinical outcomes. The recent COMBINE OCT-FFR study demonstrated that non-flow limiting coronary plaques with TCFA had unfavourable clinical outcomes compared to non-TCFA lesions29. The present study also found that in the absence of physiologically significant lesions, roughly 1/3 of the intermediate lesions had an RWSmax >12% or LCR>0.33. Although preventative stenting of vulnerable plaques remains controversial, vulnerability assessments appear to confer incremental prognostic value in the presence of coronary lesions with preserved FFR29. Accordingly, improved prognosis of vulnerable and non-flow limiting plaques could be achieved by individualised plaque passivation following intensive medication, irrespective of functional significance. Of note, both RWS and single-view quantitative flow ratio (QFR), namely μQFR30, have been incorporated into the same AngioPlus software. RWS computation can be performed immediately after the μQFR analysis (Supplementary Appendix 1). It remains to be demonstrated in a prospective study to which extent the combination of RWS and QFR can improve risk stratification for mild lesions with vulnerability features but preserved haemodynamics. Conversely, the high negative predictive value of RWS in identifying TCFA would further support the use of RWS in enhancing the safety of PCI deferral in the presence of a preserved QFR. These are currently appealing hypotheses worth exploring, but specific evidence must be generated in upcoming clinical studies.
Study limitations
This was a retrospective single-centre study, with all the limitations inherent to this design. Although strict inclusion and exclusion criteria were applied for analysis, selection bias cannot be ruled out, especially with respect to upstream clinical decisions to perform intracoronary imaging, or not. Likewise, the generalisability of the results to more severe lesions, especially in the presence of stress-induced or even resting translesional pressure gradients, needs to be addressed in future studies. In addition, due to the retrospective nature of the current study, 42% of the vessels were excluded, mainly because of previously implanted stents or unsatisfactory angiography quality. Future prospective studies testing the value of the RWSmax in all-comer patient populations are warranted.
This was a pilot study to explore the relation between plaque composition, vulnerability and RWSmax as previously reported by IVUS studies34568. No head-to-head comparison with strain calculated by means of elasto-palpography (i.e., IVUS) was performed in the current study, but reliable measurement of elasto-palpography from IVUS requires the absence of longitudinal movement between the IVUS probe and the imaging cross section, which is technically challenging due to cardiac motion.
In the present study, we found no association between a low RWSmax and calcium. This could be explained by low (3.5%) calcium content in the studied plaque, disabling any opportunity to detect a potential association. The precise interaction between calcium presence and location and RWSmax may require further analysis. A large calcific plate occupying 1 quadrant within a large lipidic pool, will result in higher strain values than a small periluminal calcific ring, constraining any dynamic change in lumen diameters to negligible values. The association between calcium and strain might be more dependent on the distribution than on the amount of mineral deposited. This hypothesis will deserve specific appraisal in future dedicated larger-size studies. Of note, the correlation between the RWSmax and the presence of macrophages was not evaluated in the current study, considering the suboptimal precision of the deep learning algorithm in identifying areas infiltrated with macrophages18.
Although RWSmax has distinct advantages, the method also has some intrinsic shortcomings. The performance of RWSmax will inevitably be impacted by changes in the analysed angle (during vessel motion and twist), the angiographic projection and quality of the angiographic images. Prospective studies to investigate which angiographic image acquisition settings are needed to optimise the results of RWS analysis are warranted. It is possible that the changes in luminal diameter will only be partially detected in eccentric plaque. Finally, RWSmax does not assess lumen deformation due to vessel elongation and torsion.
Conclusions
Angiography-derived RWSmax was significantly correlated with plaque composition and known OCT features of plaque vulnerability in patients with intermediate coronary stenosis. RWSmax appears to be a cost-efficient tool to evaluate the mechanical properties of non-culprit plaque during diagnostic angiography.
Impact on daily practice
This novel method to derive radial wall strain from a single projection of coronary angiography was correlated with plaque composition and markers of plaque vulnerability by OCT. Plaque strain made available during routine angiography may complement angiography-based physiological assessments in order to make clinically relevant decisions in the cath lab, while optimising costs and time requirements needed for the implementation of more complex techniques.
Funding
S. Tu would like to acknowledge the support of the Natural Science Foundation of China (Nos. 82020108015 and 81871460). W. Wijns would like to acknowledge support from the Science Foundation Ireland Research Professorship Award (15/RP/2765).L. Chen would like to acknowledge support from the Fund for Top Hospital and Specialty Excellence of Fujian Province.
Conflict of interest statement
S. Tu reports research grants and consultancy from Pulse Medical, during the conduct of the study. The other authors have no conflicts of interest to declare relevant to the contents of this paper.
Supplementary data
To read the full content of this article, please download the PDF.