Abstract
Aims: Plaque rupture and subsequent thrombosis is known to be the most important pathology leading to acute coronary syndrome (ACS). We investigated by optical coherence tomography (OCT) whether in ACS there is an association of the location of the culprit plaque in the coronary tree with plaque rupture and/or thin cap fibroatheroma (TCFA).
Methods and results: We included 74 patients presenting with ACS that underwent OCT study of the culprit lesion. The distance of the culprit lesion from the ostium was measured angiographically, and the presence of rupture and/or TCFA was assessed by OCT. Sixty-seven patients were analysed. Forty-five ruptured plaques were identified by OCT (67.1%). The distance from the ostium was lower for culprit ruptured plaques versus culprit non-ruptured plaques (p<0.01), particularly in the left anterior descending (LAD) and the left circumflex (LCx) arteries. The majority of culprit ruptured plaques (68.9%) was located in the proximal 30 mm of the coronary arteries. A distance from the ostium of ≤30.54 mm predicted plaque rupture with 71.1% sensitivity and 68.2% specificity. Culprit lesions in the proximal 30 mm are associated with rupture (p<0.05), TCFA (p<0.05), and lower minimal cap thickness (p<0.05).
Conclusions: Culprit ruptured plaques in ACS seem to be predominately located in the proximal segments of the coronary arteries.
Introduction
Although systemic inflammation is activated in acute coronary syndrome (ACS1), angiographic studies have demonstrated that there is a pattern of clustering of acute thrombosis in the proximal segments of coronary arteries2. Coronary plaque rupture and subsequent thrombosis has been implicated as the major, but not the unique cause of ACS3. Furthermore, plaque rupture does not always lead to ACS. Pathologic and intravascular ultrasound (IVUS) studies have provided insight into the spatial distribution of ruptured coronary plaques4,5. However, the location of culprit ruptured plaques in ACS has not been thoroughly investigated, as previous studies have inconsistent results6-8.
Optical coherence tomography (OCT) is a high resolution invasive imaging method, which has the greatest potential for in vivo identification of plaque rupture and thrombosis in the setting of ACS9-11. OCT can also identify with great accuracy thin-cap fibroatheromas (TCFA)12, which have been considered the precursor of plaque rupture13. Therefore, we investigated by OCT whether in patients with ACS, there is an association of the location of the culprit plaque in the coronary tree with plaque rupture and/or TCFA.
Methods
The study population consisted of 74 prospectively enrolled patients admitted to our hospital with ACS from December 2007 to November 2010. ACS was defined as ST-elevation myocardial infarction, or non-ST-elevation myocardial infarction or unstable angina14,15. Patients with ST-elevation myocardial infarction were transferred to the cathlab immediately upon arrival at the hospital and underwent OCT study before performance of primary percutaneous coronary intervention, while in patients with unstable angina or non-ST-elevation myocardial infarction, coronary angiography and OCT study were performed within 24 hours after symptom onset. Patients with cardiogenic shock, renal insufficiency with baseline serum creatinine ≥1.8 mg/dl, or prior invasive treatment of the culprit vessel were excluded from the study. Written informed consent was obtained from all patients before inclusion in the study and the study was approved by the institutional ethics committee.
The culprit lesion of the angiogram was clearly identified by a combination of electrocardiogram (ECG), wall motion abnormalities seen in cardiac ultrasound, and coronary angiogram. Patients in whom the culprit lesion could not be clearly identified, were excluded from the study. The lesion of interest was well delineated in ≥2 views, and measurements of the distance of the culprit lesion from the ostium were performed using standardised angiographic projections2. After completion of diagnostic coronary angiography, thrombectomy was performed with an aspiration catheter (Export®; Medtronic, Minneapolis, MN, USA) on patients with TIMI flow grade 0 in the culprit vessel. The aspiration of thrombus was completed when flow was restored. Thereafter, OCT image acquisition was performed in the culprit lesion, before any balloon dilatation. Demographic and clinical data were collected prospectively. Analysis of OCT images was blinded from the angiographic data.
ANGIOGRAPHIC ANALYSIS
Quantitative measurements of the distance to the lesion were performed off-line after the procedure. Standardised angiographic projections were chosen for the measurement of each arterial segment within the infarct-related artery to minimise foreshortening, as previously described2,16. Distance to the lesion was defined as the distance from the ostium of the involved coronary segment to the point of the minimal luminal diameter within the culprit lesion. The thrombosis site was defined as the point of the minimal luminal diameter within the culprit lesion2. TIMI flow grade was assessed in a grade from 0 to III as previously described17.
OCT IMAGE ACQUISITION
The OCT study was initially performed using the LightLab OCT wire (St. Jude Medical, St. Paul, MN, USA). The M3 LightLab system (St. Jude Medical) provides images at a radial resolution of 15 μm. The image-wire was positioned in the target vessel, distally to the culprit lesion and automatically pulled back at 3 mm/sec. We simultaneously infused manually, contrast medium (Iodixanol 320; Visipaque®; GE Health Care, Cork, Ireland) from the guiding catheter for 3-6 seconds, with an infusion rate of approximately 1-3 ml/sec, allowing for displacement of the blood from the artery during the acquisition period18,19.
When the frequency domain analysis was available, OCT image acquisition was performed using the C7-XR™ OCT Intravascular Imaging System (St. Jude Medical) and the corresponding intravascular OCT catheter (C7 Dragonly™; (St. Jude Medical). The 2.7 Fr C7 catheter can be delivered as a mini-rail rapid exchange catheter over a coronary guidewire through an angioplasty guide catheter. The C7 catheter was positioned so that its imaging lens was distal to the lesion. After catheter placement, contrast medium was manually injected through the guide catheter at a rate of 3-4 ml/sec for 3-5 seconds. The C7 system automatically pulled back the imaging catheter optics at a rate of 20 mm/sec20. In both systems, the operator could repeat the injection in case of poor imaging quality. Images were acquired from the target segment involving the lesion, and the proximal and distal reference sites, and stored digitally for off-line analysis.
OCT IMAGE ANALYSIS
Acquired images were analysed by two independent investigators using previously validated criteria for OCT plaque characterisation12,21. Frames with poor image quality were excluded from the analysis. Lipid content was estimated in a semi-quantitative manner by measuring the arc of the lipid pool (quadrants). Measurement of the minimal fibrous cap thickness was performed at the thinnest part overlying a lipid pool, and the average of three measurements was recorded22. TCFA was defined as a plaque with lipid content in >1 quadrant and fibrous cap thickness measuring less than 65 μm21. Presence of thrombus, rupture and calcification was also recorded. Plaque rupture was defined as the consistent presence of fibrous cap discontinuity in ≥2 frames. Intracoronary thrombus was identified as a mass that protruded into the vessel lumen from the surface of the vessel wall. Lumen cross-sectional area (CSA) was measured at the minimal lumen site and at a distal reference site, and area stenosis was calculated as: (distal reference lumen CSA - minimum lumen CSA)/reference lumen CSA.
STATISTICAL ANALYSIS
All statistical analysis was performed using SPSS Statistics version 19.0 (SPPS Inc., Chicago, IL, USA). Data are expressed as mean±SD for continuous variables and as percentages for categorical variables. Differences between groups were assessed with the χ2 test or Fisher’s exact test for categorical variables, and for continuous variables with the Student’s t-test for normally distributed variables or the Mann-Whitney test for non-normally distributed variables such as distance from ostium. A receiver operating characteristic curve analysis was performed in order to identify a cutoff value of distance to lesion for predicting plaque rupture. A p-value <0.05 was considered to indicate statistical significance.
Results
BASELINE CHARACTERISTICS OF THE PATIENTS
A total of 74 patients were included. Seven out of 74 (7.1%) were excluded from the study due to poor image quality or inability to cross the culprit lesion. The remaining 67 patients were used for analysis in the present study. There were 10 patients with unstable angina (14.9%), 15 patients with NSTEMI (22.4%), and 42 patients with STEMI (62.7%). Baseline clinical characteristics of the patients are summarised in Table 1.
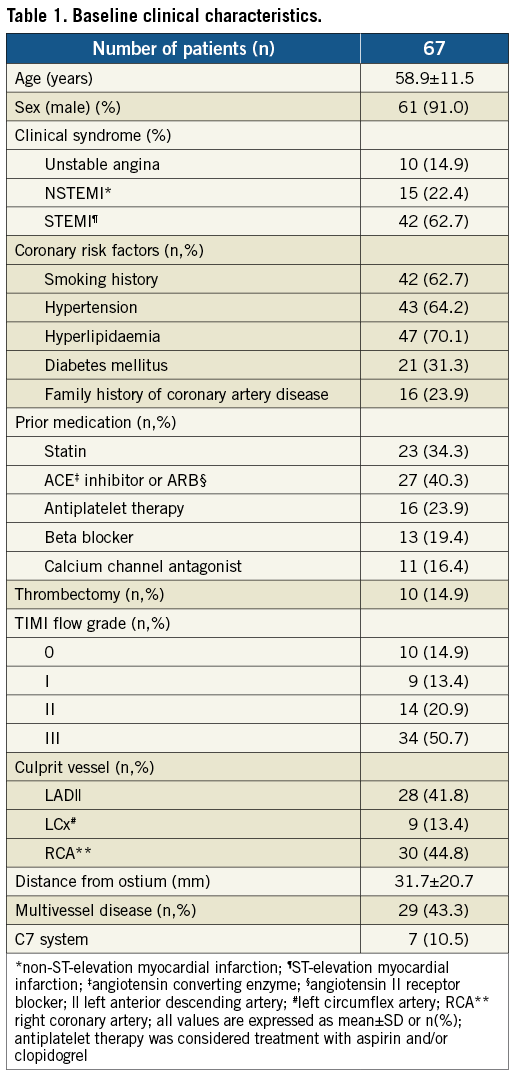
ANGIOGRAPHIC RESULTS
The angiographic characteristics of the patients are summarised in Table 1. Mean distance of culprit lesion from the ostium was 31.7±20.7 for all vessels, 26.6±13.8 for the left anterior descending (LAD), 33.1±28.4 for the left circumflex (LCx), and 35.9±23.1 for the right coronary artery (RCA) (p=0.23 for comparison between vessels). A cumulative frequency distribution curve that demonstrates the cumulative frequency of culprit lesions based on the distance from the ostium in all vessels is presented in Figure 1.
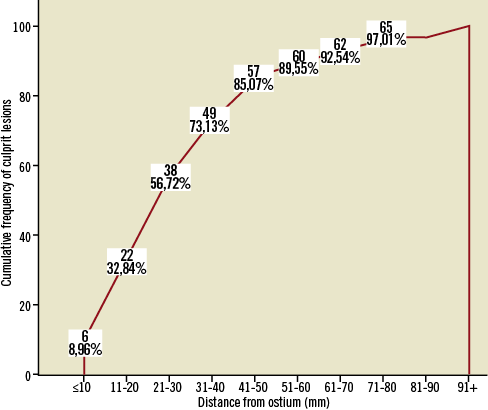
Figure 1. Cumulative frequency distribution curve that demonstrates the cumulative frequency of culprit lesions based on the distance from the ostium in all vessels.
OCT IMAGE ANALYSIS
All culprit plaques (n=67) were visualised without complications or adverse events during the procedure. Seven of the patients (10.5%) were evaluated with the C7 system.
Analysis of OCT images revealed 45 ruptured plaques (67.1%), 17 in the LAD (60.7%), six in the LCx (66.7%), and 22 in the RCA (73.3%; p=0.59). Mean fibrous cap thickness was 58±27 μm in all patients. The vast majority of the patients (n=62, 92.5%) had >1 lipid quadrants in the culprit lesion. Forty-five TCFA were identified by OCT, 16 in the LAD (57.1%), six in the LCx (66.7%), and 23 in the RCA (76.7%; p=0.29). Cap thickness was lower in patients with TCFA (42±14μm) versus patients without TCFA (89±17μm, p<0.001). Luminal thrombus was found in the majority of patients (n=47, 70.1%).
The distance of the culprit lesion from the ostium was lower for ruptured plaques compared to non-ruptured plaques (27.0±19.3 mm versus 41.1±20.6 mm, p<0.01). This difference in distance from the ostium between ruptured and non-ruptured plaques was significant for the LAD (22.2±11.5 mm versus 33.5±14.7 mm, p<0.05) and for the LCx (16.8±15.7 mm versus 65.6±15.1 mm, p<0.05), but not for the RCA, where the difference did not reach statistical significance (33.6±23.1 mm versus 42.4±23.4 mm, p=0.22). Frequency distribution of ruptured and non-ruptured plaques is presented in Figure 2. The majority of ruptured plaques (n=31, 68.9%) was clustered within the first 30 mm from the ostium, while in the LAD 12 out of 17 ruptured plaques (70.5%) were located in the proximal 30 mm and 16 out of 17 ruptured plaques (94.1%) in the proximal 40 mm.
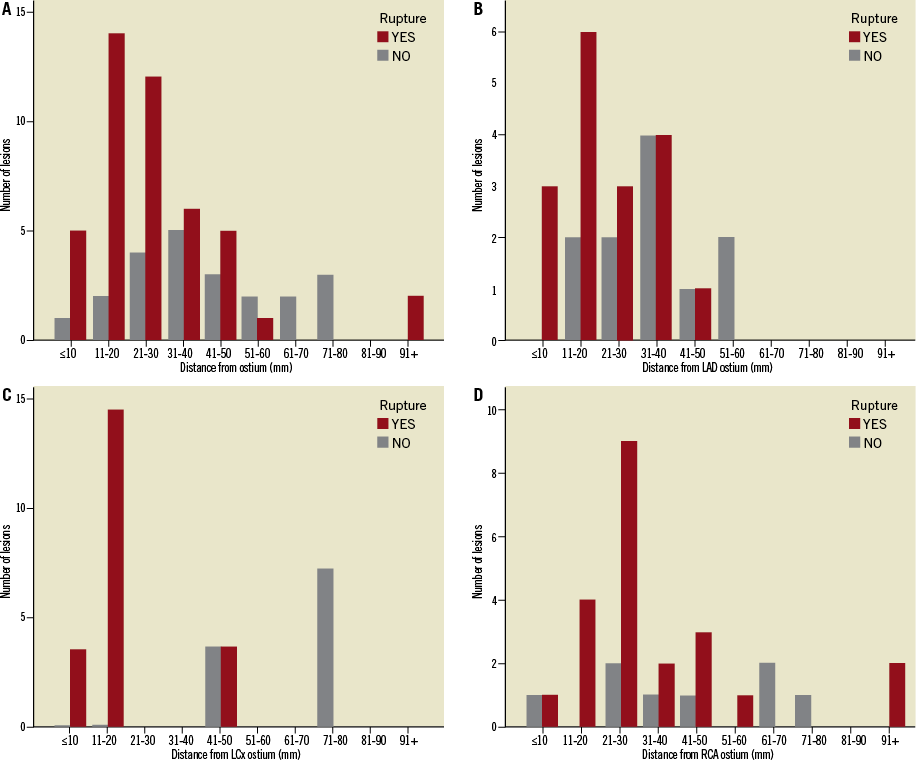
Figure 2. Frequency distribution of culprit ruptured and non-ruptured plaques: A) in all vessels; (B) in the left anterior descending artery (LAD); (C) in the left circumflex (LCx); and (D) in the right coronary artery (RCA). There is a pattern of clustering of culprit ruptured plaques in the proximal segments, as 68.9% of all culprit ruptured plaques and 70.5% of culprit ruptured plaques in the LAD are located in the proximal 30 mm. Conversely, culprit plaques without rupture are evenly distributed throughout the intervals.
Culprit lesions containing a TCFA had a trend towards lower distance from the ostium, compared to plaques without a TCFA (28.9±20.3 mm versus 37.3±20.9 mm, p=0.08). In the vessel sub-analysis this difference did not reach statistical significance in any vessel (LAD: 23.8±11.8 mm versus 30.4±15.7 mm, p=0.23; LCx: 22.41±20.14 mm versus 34.5±19.9 mm, p=0.12; RCA: 34.2±24.0 mm versus 41.8±20.4 mm, p=0.25). Frequency distribution of TCFA and non-TCFA is presented in Figure 3. Thirty out of the 45 TCFA (66.7%) are located within the first 30 mm from the ostium, while in the LAD 80% of culprit lesion TCFA (n=12) were located in the proximal 30 mm from the LAD ostium.
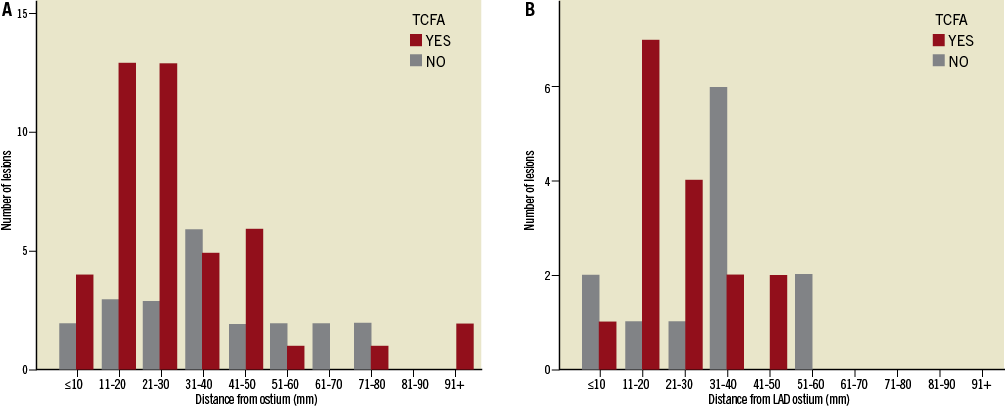
Figure 3. Frequency distribution of culprit lesion thin cap fibroatheromas (TCFA): A) in all vessels; and (B) in the left anterior descending artery (LAD). TCFA are predominantly located in proximal segments, as 30 out of the 45 TCFA (66.7%) are located within the first 30 mm from the ostium, while in the LAD 80.0% of culprit lesion TCFA (n=12) were located in the proximal 30 mm from the LAD ostium. Conversely, non-TCFA seem to be evenly distributed across the length of coronary arteries.
Sensitivity-specificity analysis revealed that distance from ostium allows one to classify patients into patients with rupture and patients without rupture (area under the curve [AUC]=0.719, p<0.01). Moreover, a value ≤30.54 mm is optimal in identifying patients with culprit ruptured plaques (sensitivity=71.1%, specificity=68.2%; Figure 4).
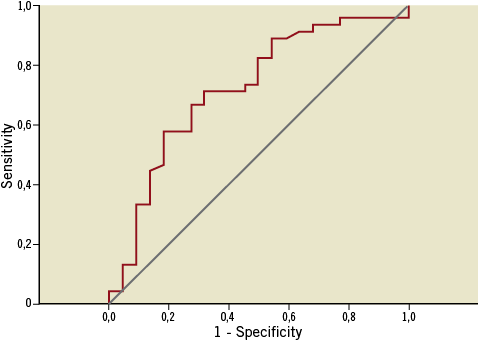
Figure 4. Receiver operating characteristic curve of distance from the ostium for the prediction of culprit plaque rupture in patients with acute coronary syndromes (AUC=0.719, p<0.01). The optimal discriminating value was 30.54 mm (sensitivity=71.1%, specificity=68.2%).
Based on the value from the receiver-operator characteristic curve analysis, we classified the patients into two groups using a cutoff of 30 mm for the distance of the culprit lesion from the ostium: culprit lesions located within the first 30 mm were defined as proximal and culprit lesions located in a distance >30 mm were defined as distal. Differences in the OCT findings between the two groups are presented in Table 2. Four proximal lesions (10.5%) were examined with the C7 system versus three of the distal lesions (10.3%; p>0.99). There were no significant differences between the two groups in the clinical syndrome (proximal lesions: unstable angina 15.8% [n=6], NSTEMI 28.9% [n=11], STEMI 55.3% [n=21]; distal lesions: unstable angina 13.8% [n=4], NSTEMI 13.8% [n=4], STEMI 72.4% [n=21]; p=0.29). Patients with proximal culprit lesions had a greater incidence of rupture (p<0.05) and TCFA (p<0.05), and have lower minimal cap thickness (p<0.05). No differences were detected in the degree of area stenosis by OCT. Representative cases of proximal and distal lesions are presented in Figure 5 and Figure 6, respectively.
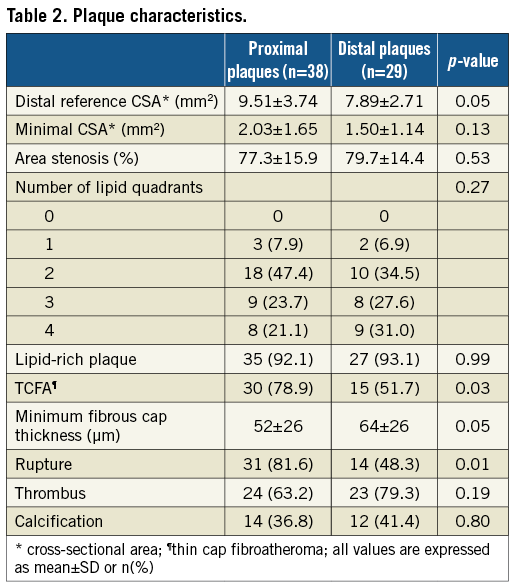
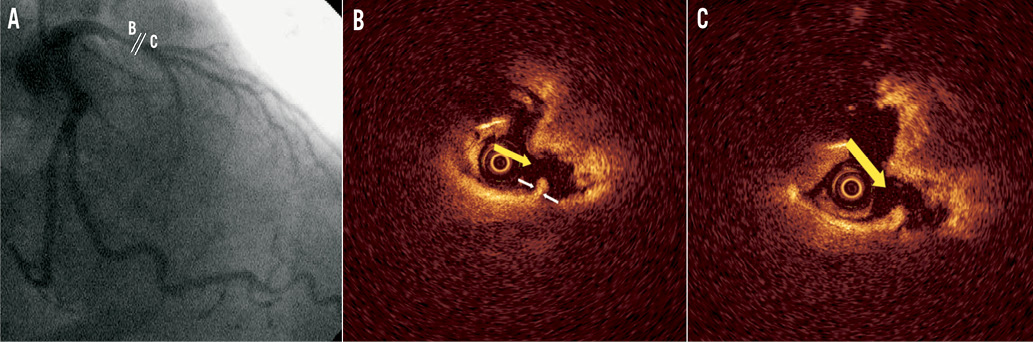
Figure 5. Representative optical coherence tomography (OCT) images of a proximal culprit lesion in a patient with ST-elevation myocardial infarction. A) Coronary angiogram of the culprit lesion in the left anterior descending artery (distance of minimal lumen site from ostium 20.1 mm); B) and C) cross-sectional images demonstrating plaque rupture (yellow arrow) with white thrombus. Minimal cap thickness (white arrows) was 60 μm.
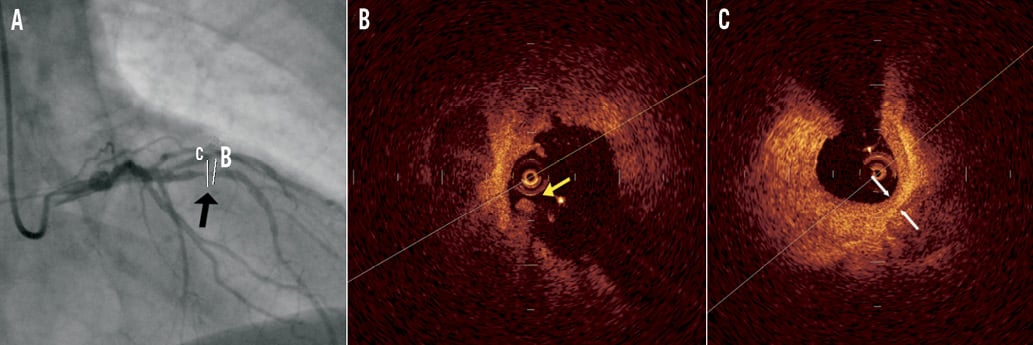
Figure 6. Representative optical coherence tomography (OCT) images of a distal culprit lesion in a patient with ST-elevation myocardial infarction. A) Coronary angiogram of the culprit lesion in the left anterior descending artery (distance of minimal lumen site from ostium 34.1 mm); B) mixed plaque (lipid-rich with calcifications) with fragments of thrombus (yellow arrow) in the lumen; C) minimal lumen site with mixed plaque and minimal cap thickness 120 μm (white arrows).
Discussion
The main findings of this study are: 1) in patients with ACS, culprit ruptured plaques are not uniformly distributed in the coronary tree, but tend to cluster in proximal segments; and 2) culprit plaques in ACS located in the proximal 30 mm are more likely to contain a TCFA.
In our study, culprit lesions that were studied by OCT were predominantly located in proximal segments of coronary arteries demonstrating a pattern of spatial distribution similar to that identified by Wang et al angiographically2. It has been speculated, however, that this pattern is not a consequence of a predisposition of proximal lesions to rupture, but rather a result of the increased prevalence of atheromatic lesions per se in proximal segments23. In this field of debate, the present study demonstrated that certain morphological characteristics are present more often in proximal culprit lesions compared to distal culprit lesions of patients with ACS.
OCT technology can provide accurate measurements of the fibrous cap thickness and increased sensitivity for the identification of plaque ruptures9,12,22. In the current study we showed by OCT that culprit plaques in ACS located proximally do not differ in the degree of stenosis, but are associated with specific morphologies. In particular, a more proximal location of the culprit plaques is associated with plaque rupture, and plaques located in the proximal 30 mm of the coronary tree are more frequently associated with TCFA. These observations are in agreement with previous post mortem studies that have shown clustering of ruptured plaques and TCFA in the proximal segments of the coronary arteries4,24. Differences in plaque morphology as a result of the distance from the ostium have also been assessed in an intravascular ultrasound with radiofrequency analysis study in patients with stable angina and ACS, showing increased fibrous content and decreased lipid content in plaques located in distal segments25. In our study, we failed to observe a difference in the amount of lipid content in association with the distance from the ostium, probably because we only analysed culprit lesions in ACS, which are associated with increased lipid content21,25.
Previous in vivo studies, using intravascular ultrasound (IVUS) and OCT have also investigated the localisation of plaque ruptures across the coronary tree6,7. In a large study of both culprit and non-culprit lesions of patients with stable angina or ACS, ruptured plaques found by IVUS were located proximally in the LAD, in the proximal and middle segments of RCA, while in the LCx the distribution was homogeneous7. In our study, the findings were similar, with the exception of the LCx in which ruptured plaques were located proximally. This difference can be partially explained by the different inclusion criteria, as we only investigated the culprit lesions in ACS, and partially by the increased resolution of OCT compared to IVUS for the identification of ruptured plaques9. In another study with OCT including culprit and non-culprit lesions of patients with chronic stable angina and ACS, similar ruptured plaque distribution in the LAD was found, despite the inclusion of a limited number of patients with ACS6.
Our findings can be explained by the different extent of shear stress acting on the plaque in proximal and in distal locations. Proximal location is associated with greater lumen diameter, and presence of multiple side branches with large diameters that can alter the local haemodynamics and create regions of low and high shear stress26,27. Low shear stress has been associated with the development of plaques with decreased fibrous content, increased lipid content, and increased inflammatory cell activation, features that are associated with plaque instability13,28. Indeed, in our study significant differences were observed in the LAD and in the LCx, where the proximal segment had more side branches compared to the RCA, where no significant differences were observed.
Study limitations
Aspiration thrombectomy was performed in a small percentage (n=10, 14.9%) of patients prior to OCT examination for better visualisation, thus minimising the effect of intracoronary thrombus on imaging analysis. Thrombectomy could possibly have caused plaque modification. Despite the use of thrombectomy, thrombus was detected by OCT in 70.1% of the patients. This thrombus could have led to the underestimation of the incidence of rupture. Nonetheless, OCT is the method with the highest sensitivity and specificity for identification of rupture9. Furthermore, the percentage of thrombus in proximal lesions was rather low (63%). However, this is reasonable considering the inclusion of patients with unstable angina, the delay in imaging in non-ST-elevation ACS possibly associated with resolution of thrombus due to intense antithrombotic treatment, the use of thrombectomy in certain patients, and the possibility of distal embolisation of thrombus fragments that would be missed during culprit lesion assessment alone.
Conclusions
Culprit ruptured plaques in acute coronary syndromes are not uniformly distributed throughout the coronary tree, but seem to be predominately located in the proximal segments of the coronary arteries. The morphology of culprit plaques seems to differ throughout the coronary arteries.
Conflict of interest statement
The authors have no conflicts of interest to declare.