Abstract
Aims: In vivo validation of coronary optical coherence tomography (OCT) against histology and the effects of plaque burden (PB) on plaque classification remain unreported. We aimed to investigate this in a porcine model with human-like coronary atherosclerosis.
Methods and results: Five female Yucatan D374Y-PCSK9 transgenic hypercholesterolaemic minipigs were implanted with a coronary shear-modifying stent to induce advanced atherosclerosis. OCT frames (n=201) were obtained 34 weeks after implantation. Coronary arteries were perfusion-fixed, serially sectioned and co-registered with OCT using a validated algorithm. Lesions were adjudicated using the Virmani classification and PB assessed from histology. OCT had a high sensitivity, but modest specificity (92.9% and 74.6%), for identifying fibrous cap atheroma (FCA). The reduced specificity for OCT was due to misclassification of plaques with histologically defined pathological intimal thickening (PIT) as FCA (46.1% of the frames with histological PIT were misclassified). PIT lesions misclassified as FCA by OCT had a statistically higher PB than in other OCT frames (median 32.0% versus 13.4%; p<0.0001). Misclassification of PIT lesions by OCT occurred when PB exceeded approximately 20%.
Conclusions: Compared with histology, in vivo OCT classification of FCA had high sensitivity but reduced specificity due to misclassification of PITs with high PB.
Abbreviations
FCA: fibrous cap atheroma
IVUS: intravascular ultrasound
LAD: left anterior descending artery
LCx: left circumflex artery
OCT: optical coherence tomography
PIT: pathological intimal thickening
SMS: shear-modifying stent
STEMI: ST-segment elevation myocardial infarction
TCFA: thin-cap fibroatheroma
ThFCA: thick fibrous cap atheroma
Introduction
Intracoronary optical coherence tomography (OCT) is increasingly used to classify coronary atherosclerotic lesions and guide interventional procedures, due to its higher spatial resolution compared to intravascular ultrasound (IVUS)1,2. A challenge when using OCT is the limited penetration of light into the vessel wall3 and the heterogeneity of plaque constituents that have high signal, which can affect image interpretation and lesion classification1. Previous studies have compared ex vivo OCT imaging of cadaveric human coronary arteries with histology4-11. To our knowledge, studies comparing in vivo OCT classification of coronary plaques to histology have not been reported. In the present study, we sought to compare identification of advanced coronary plaque morphologies by in vivo OCT with co-registered histology in hypercholesterolaemic minipigs with human-like advanced coronary atherosclerosis.
Methods
All animal experiments were performed in accordance with the ethical and welfare regulations of the University of Aarhus and approved by the Danish Animal Experiments Inspectorate. Detailed descriptions of the animals and experimental protocols have been described previously by Pedrigi et al12. Briefly, five female D374Y-PCSK9 transgenic minipigs on a Yucatan background were fed a cholate-free high fat high cholesterol (HFHC) diet for one to four months prior to instrumentation with a shear-modifying stent (SMS). SMS were made by custom modification of 3.0 mm stainless steel coronary stents covered with expandable polytetrafluoro-ethylene with a circular ring placed in the middle of the stent to restrict expansion of the central region during deployment, thus creating a focal stenosis after implantation that caused flow disturbances primarily downstream of the stent13. The SMS was implanted into either the left anterior descending (LAD; N=1) or left circumflex artery (LCx; N=4). Coronary angiograms and intravascular frequency domain optical coherence tomography (FD-OCT) images were acquired immediately before and after SMS implantation, as well as at 19- and 34-week follow-up (one pig died after follow-up at 19 weeks, so only four pigs were evaluated at the additional follow-up time of 34 weeks). Coronary angiograms were acquired in orthogonal views during injection of iodinated contrast (iohexol 140 mgI/mL; GE Healthcare, Oslo, Norway) with ventilation briefly paused using a clinical grade digital fluoroscopy suite (Allura Xper FD10; Philips, Amsterdam, the Netherlands). Intracoronary OCT was performed in both the LAD and LCx of all pigs at a speed of 20 mm/s during pump injection of iohexol (4-8 mL/s) using the ILUMIEN™ system and Dragonfly™ imaging catheters (St. Jude Medical, St. Paul, MN, USA). Prior to each pullback, the OCT catheter was imaged in orthogonal views during injection of iodinated contrast to enable reconstruction of the catheter path, which could be combined with the OCT frames to obtain a 3D reconstruction of the instrumented artery. After the final catheterisation procedure, the pigs were sacrificed and the coronary arteries were perfusion-fixed at 100 mmHg for one hour followed by immersion fixation for 24 hours using 4% formaldehyde in phosphate buffered saline to allow histological evaluation of the instrumented artery.
EVALUATING PLAQUE TYPE IN OCT FRAMES AND HISTOLOGY SECTIONS
All frames of the OCT pullback (acquired at 200 µm intervals) within the instrumented vessel of each pig were segmented and evaluated for the presence of fibrous cap atheroma (FCA) by three investigators (N. Pareek, I. Kilic, and R. de Silva) who were blinded to the histological data. These analyses were performed offline using standard software (St. Jude Medical). FCA within OCT frames was characterised using standard criteria4. Specifically, FCA was defined as a plaque containing lipid (signal-poor region, with poorly delineated borders, signal drop-off, and little or no signal backscattering) that was covered by a fibrous cap. The lipid needed to subtend an arc greater than 90° and the fibrous cap was classified as the thinnest portion of tissue layer overlying a signal-poor region4. For each FCA, the fibrous cap thickness was measured to allow delineation of thin-cap fibroatheroma (TCFA; classified as having a cap thickness ≤85 µm) from thick fibrous cap atheroma (ThFCA)10. In histology, the cap needed to be ≤65 µm14. A normal vessel was classified as having a trilaminar architecture without intimal thickening.
To validate the characterisation of FCA within the OCT frames, histological analysis was performed on ~2.5 mm vessel segments immediately upstream and downstream of the implanted stent, where flow disturbances were greatest and plaque development most advanced. Those vessel segments downstream of the stent exhibited the most extensive advanced plaque development. Tissue blocks containing the coronary artery and underlying myocardium were sectioned at a thickness of 3 µm and serially collected to allow assessment of up to ten stains (the sections for each stain were evaluated at 60 µm intervals) over a distance of ~2.5 mm in the tissue blocks adjacent to the stent. Three stains were used to evaluate plaque type: haematoxylin and eosin (H&E), muramidase (macrophages), and picrosirius red (collagen). Digitised images of the stained histology sections were acquired using an Olympus BX50 light microscope with a ColorView 2 camera (both Olympus Corporation, Tokyo, Japan). Plaque type and morphology were classified according to the Virmani classification by expert histopathologists (C. Poulsen and E. Falk) who were blinded to the OCT data. Plaques were classified as TCFA, FCA, pathological intimal thickening (PIT), early lesions (xanthoma and intimal thickening), or normal vessel wall. In addition, TCFA, FCA, and PIT were considered advanced plaques. Accurate co-registration of the histology sections to the OCT frames was performed using custom MATLAB software (MathWorks, Natick, MA, USA) which used the attached myocardium, vessel bifurcations, and the implanted stent as circumferential and longitudinal fiducial markers, thus accounting for rotational artefacts and shrinkage. A full description of the methodology for 3D spatial co-registration of in vivo OCT and histology, including an error propagation analysis, have been reported previously12. Because plaque type was evaluated in histology sections with a higher longitudinal frequency (60 µm interval between histological sections, which equated to ~105 µm in vivo) than OCT frames (200 µm interval), the closest histology section to a given OCT frame was used to validate the plaque type classification within that frame.
To examine differences in plaque size between OCT frames correctly identified not containing an FCA (based on examination of co-registered histology) versus those falsely identified as having an FCA, we computed plaque burden (PB) within the co-registered histological sections as the percentage of plaque area to external elastic membrane area15. PB could not be computed from the OCT frames due to the limited penetration depth of this imaging modality.
STATISTICAL ANALYSIS
The ability to identify accurately FCA within OCT frames was evaluated by comparison to co-registered histology sections, which is considered the gold standard. The performance of this classification was quantified by sensitivity, specificity, positive likelihood ratio, negative likelihood ratio, and diagnostic odds ratio. Statistical comparisons were performed with a one-way ANOVA and p<0.05 was considered statistically significant. All analyses were carried out using MATLAB.
Results
The implanted SMS induced the development of advanced coronary plaques in all pigs. A total of 201 OCT frames from within the diseased vessel segments proximal to the inlet and outlet of the stent over all pigs were segmented and evaluated for the presence of FCA. Histological analysis was performed on these vessel segments, wherein histological sections were evaluated at 60 µm intervals for plaque type using the Virmani classification system14 and accurately co-registered to the OCT frames to assess the accuracy of OCT-based FCA identification (Figure 1-Figure 4). OCT had a high sensitivity but modest specificity of 92.9% and 74.6%, respectively, for classifying FCA. The sensitivity and specificity associated with each type of FCA demonstrated 28.6% and 96.4% for TCFA compared to 66.7% and 73.9% for ThFCA (Table 1). The low sensitivity associated with TCFA and ThFCA resulted from an inability to determine the fibrous cap thickness accurately, whereas the lower specificity in all FCA (composed primarily of ThFCA) resulted from misclassification of lesions with histologically defined PIT; 46.1% of OCT frames with histologically defined PIT were misclassified as FCA. Histologically defined PIT lesions misclassified as FCA by OCT had a statistically higher percentage PB of 32.0% (20.3%, 58.2%) (median and [25th, 75th] percentiles) compared to 13.4% (10.5%, 14.9%) within OCT frames in which lesions were not misclassified as FCA (p<0.0001). This misclassification of PIT lesions by OCT occurred more frequently when PB exceeded approximately 20% (Figure 5).
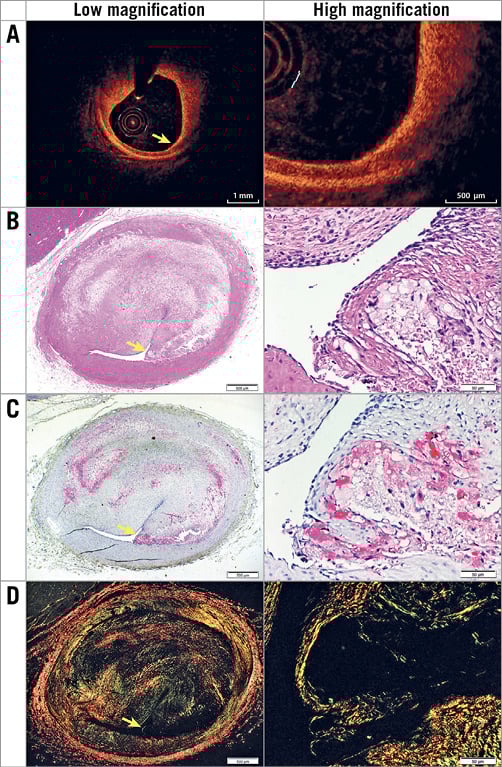
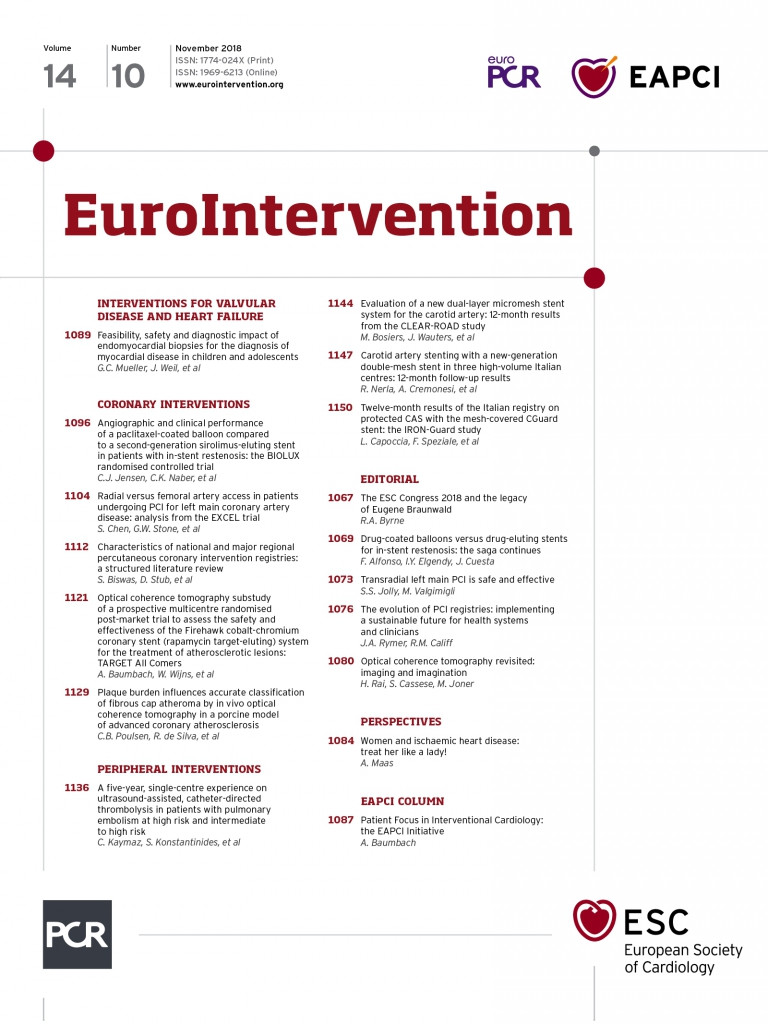
Figure 1. Representative images of a histologically defined TCFA with a PB of 65.6%. The TCFA is shown by OCT at low and high magnification (A) with corresponding histology including H&E (basic; 2x and 20x) (B), muramidase (macrophages; 2x and 20x) (C) and picrosirius red (collagen; 2x and 20x) (D). Yellow arrows indicate the fibrous cap.
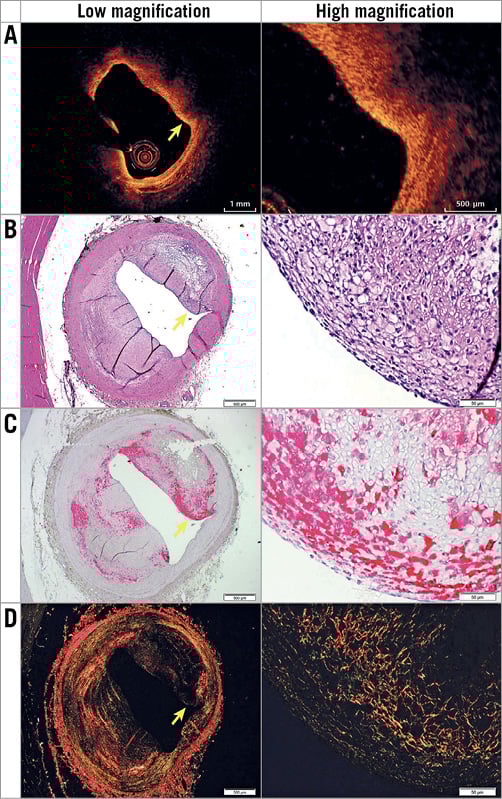
Figure 2. Representative images of histologically defined ThFCA with a PB of 51.7% in OCT (A) and histology, which includes H&E (basic; 2x and 2x) (B), muramidase (macrophages; 2x and 20x) (C), and picrosirius red (collagen; 2x and 20x) (D) stainings. Yellow arrows indicate the fibrous cap.
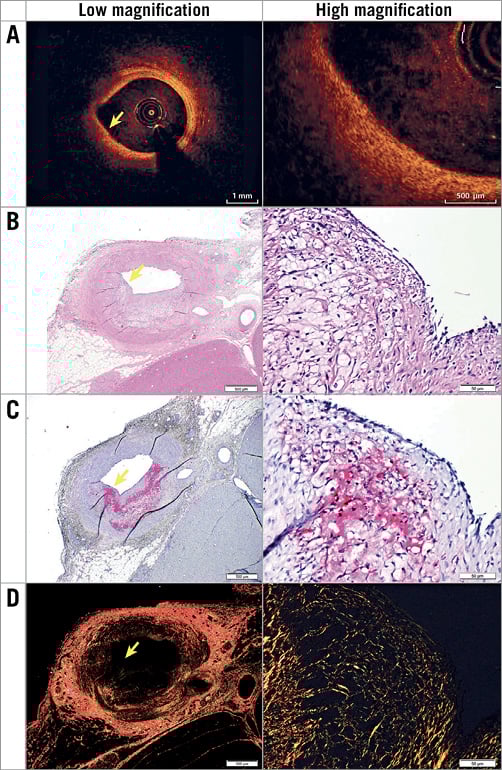
Figure 3. Representative images of histologically defined PIT with a large PB of 26.5% that was misclassified as FCA by OCT (A). Histology included the following stains: H&E (basic; 2x and 20x) (B), muramidase (macrophages; 2x and 20x) (C), and picrosirius red (collagen; 2x and 20x) (D). Yellow arrows indicate part of the plaque that from OCT could be assessed as a fibrous cap.
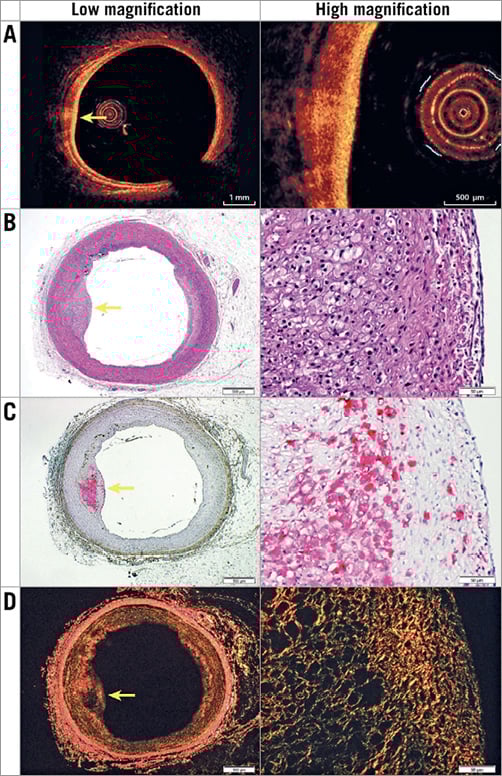
Figure 4. Representative images of histologically defined PIT with a small PB of 16.2% in OCT (A) and histology that was correctly ignored in OCT (i.e., not classified FCA). Histology included the following stains: H&E (basic; 2x and 20x) (B), muramidase (macrophages; 2x and 20x) (C), and picrosirius red (collagen; 2x and 20x) (D). Yellow arrows indicate the centre of the plaque.
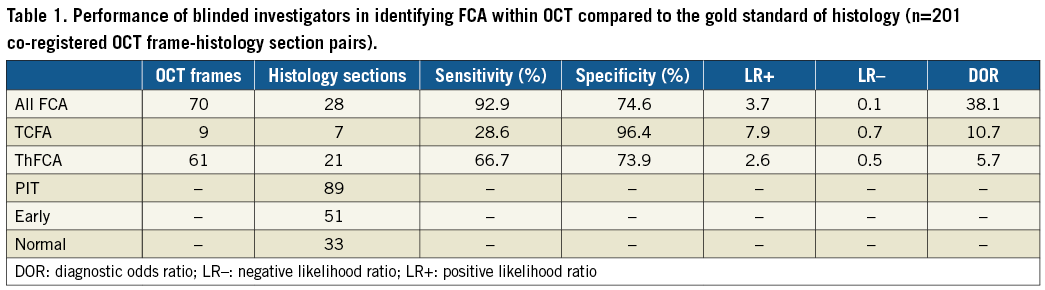
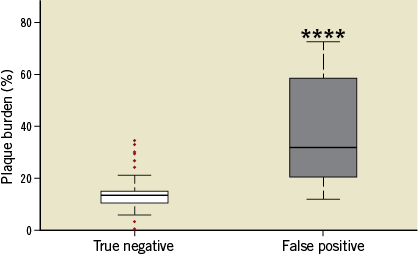
Figure 5. Box plot showing median, interquartile range, and whiskers, which indicate the minimum and maximum data points not considered outliers. Outliers (indicated by red dots) are 1.5 times the interquartile range added to the third quartile or subtracted from the first quartile, which is approximately 2.7 standard deviations from the mean for normally distributed data. Plaque burden (%) of histologically defined PIT either correctly ignored in OCT (true negative) or classified as FCA (false positive) is shown. ****indicates p<0.0001.
Discussion
In the present study, we present the first report of direct comparison of in vivo OCT-classified coronary plaque morphology with co-registered histology. We found that OCT was able to classify FCA with a high sensitivity. However, plaques with histopathologic features of PIT and histologic PB exceeding 20% were often misclassified as FCA by OCT, resulting in a modest specificity of in vivo OCT for classifying FCA. In this pilot study, the sensitivity for discriminating TCFA was low.
Using standard criteria definitions4, the sensitivity and specificity for detecting TCFA by ex vivo OCT has been reported to range between 72 and 100% from imaging studies of cadaveric human coronary arteries with paired histology10,11,16. Though the specificity for identification of TCFA in the current study falls within the reported range, the sensitivity was low at 28.6%. This may be attributable to the small number of TCFA lesions in the current study; the error was associated with co-registration of the in vivo OCT frames and corresponding histological sections, particularly given the heterogeneity of plaque type that was observed when it was delineated on a section-to-section basis at 60 µm intervals. Furthermore, changes in the dimensions of the plaque resulting from histological processing, such as perfusion fixation and shrinkage of the tissue, affected the appearance of the lesions and increased the error in measurements of cap thickness, causing discrepancies between plaque classification by in vivo imaging and histology, particularly when a common set of diagnostic criteria was applied to both modalities10,12.
A pooled analysis combining both TCFAs and ThFCAs was performed to evaluate the ability of in vivo OCT to classify FCA plaque morphologies in general. The sensitivity of in vivo OCT was comparable to previous ex vivo OCT imaging studies17, though the specificity was modest17. The latter was due to misclassification of lesions within the OCT frames as FCA, which actually had histological features of PIT. This was particularly problematic in lesions with higher PB. The light sources used in the various OCT systems have reported tissue depth penetration between 1 and 3.5 mm3,17. Our findings accord with recent publications from other groups. Phipps et al9 showed that, irrespective of the atherosclerotic lesion composition, an important cause of FCA misclassification by ex vivo OCT was foam cell accumulation close to the luminal surface and consequent reduced backscatter of light due to their lipid content, which is consistent with our findings (Figure 1-Figure 4). In line with these observations, Lutter et al18 reported that plaque constituents classified by OCT did not correlate well with histological features. Our study extends these findings by showing that PB is an important determinant of misclassification of FCA plaque morphologies by in vivo OCT. This may be improved by using multimodality intracoronary imaging systems which combine OCT and intravascular ultrasound, with the latter enabling evaluation of PB by virtue of better depth penetration19.
When comparing animal and human studies, important differences should be noted. The coronary lesions encountered in porcine models have developed over months, not decades as in humans20. Though the lesions assessed in the present study showed features of advanced atherosclerosis, including necrotic core formation, calcium depositions and neovascularisation, they appeared more cellular than human lesions20,21, with foam cells frequently appearing close to the luminal surface in both PIT and FCA lesions (Figure 1-Figure 4), which may have influenced the results9.
Study limitations
Two limitations of this study should be considered. First, a small cohort of five pigs was studied and human-like FCA developed in only three of five animals, including TCFA in two of five animals. Secondly, the animals were only followed for 34 weeks; a longer follow-up period may have resulted in the development of more advanced lesions. However, even with this sample size, the high-resolution analysis provided sufficient power to allow identification of statistically significant associations between OCT-derived vessel wall/plaque features and histology12.
Conclusions
We present, to the best of our knowledge, the first comparison between in vivo OCT classification of coronary FCA compared with co-registered histology. We found that in vivo OCT has a high sensitivity but only a modest specificity for classification of FCA. While these data require confirmation in a larger sample, they may provide important considerations for the clinical interpretation of in vivo OCT images of coronary atherosclerotic plaques.
| Impact on daily practice Optical coherence tomography (OCT) is increasingly used for the evaluation of coronary atherosclerosis. This study suggests that OCT misclassifies advanced fibrous cap atheroma, particularly when plaque burden is high, and suggests that plaque burden should be considered when interpreting OCT images. |
Acknowledgements
We thank Zahra Nasr, Lisa Maria Røge, and Dorte Qualmann for technical assistance.
Funding
This work was supported by the Cardiovascular Research Unit, Royal Brompton and Harefield NHS Foundation Trust (RdS); BHF Program Grant (RG11/13/29055); Helga and Peter Kornings Fund and Aarhus University.
Conflict of interest statement
N. Holm has received institutional research grants and speaker fees from St. Jude Medical and Terumo. The other authors have no conflicts of interest to declare.