Abstract
Aims: There is limited in vivo evidence regarding the temporal evolution of non-culprit coronary plaque morphology. We aimed to evaluate changes in non-culprit plaque morphology over time by optical coherence tomography (OCT).
Methods and results: Seventy-two (72) patients with 257 non-culprit segments with serial OCT studies were analysed. Non-culprit 5 mm-long coronary segments from the same imaged region were matched between baseline and follow-up. OCT plaque characterisation including automated attenuation analysis was performed, and changes over a median follow-up of 6.2 months were evaluated. On segment level, lumen area decreased from baseline to follow-up, whereas fibrous cap thickness increased. Similarly, plaque attenuation indices at follow-up were significantly decreased. Minimal cap thickness per patient did not change. In 68.5% of segments, plaque morphology did not change. Favourable change was observed in 18.4% of segments and unfavourable in 12.9%. There were no robust clinical predictors of change in plaque morphology. Attenuation analysis supported the qualitative characterisation, showing significantly different attenuation between different plaque types.
Conclusions: In non-culprit coronary segments of patients with coronary artery disease under standard medical therapy, segment-level but not patient-level minimum fibrous cap thickness increases over time, with observations of both favourable and unfavourable changes in individual segments.
Abbreviations
CAD: coronary artery disease
IPA: index of plaque attenuation
MLA: minimal lumen area
NSTEMI: non-ST-elevation myocardial infarction
OCT: optical coherence tomography
OR: odds ratio
RCI: relative calcium index
RLCI: relative lipid core index
ROI: region of interest
TCFA: thin-cap fibroatheroma
VH-IVUS: virtual histology intravascular ultrasound
Introduction
Post-mortem evidence suggests that plaque morphology is implicated in plaque destabilisation1. However, prospective studies have only demonstrated a modest prognostic significance of plaque morphology for future events2. In order to enhance this prognostic capability, in vivo morphological characteristics associated with plaque progression should be further defined and morphological changes over time documented. Optical coherence tomography (OCT) allows a comprehensive morphological plaque characterisation3, further corroborated by automated plaque characterisation4.
We aimed to evaluate changes in plaque morphology of non-culprit lesions over time by OCT using a qualitative and a quantitative approach, and identify predictive factors.
Methods
STUDY PROTOCOL
The OCT database of the Erasmus MC was screened for patients undergoing serial OCT of the same single vessel within three months. Indications for repeat catheterisation included new symptoms, staged procedures or study patients. Patients in whom the same non-culprit native segment was visualised at both time points were included. The pullbacks were matched using landmarks and synchronised by an automated algorithm. OCT analysis was then performed in the matched vessel region, and changes were recorded. Analysis was performed on patient level (vessel level; all matched segments from a single vessel) and on segment level (the imaged region was divided in equal subsegments of 5 mm). Additionally, quantitative plaque characterisation by automated attenuation analysis was performed. Demographic and clinical data were collected retrospectively. Informed consent was acquired from all patients and the study complied with the Declaration of Helsinki.
STUDY POPULATION
All patients >18 years old with serial OCT examination of the same vessel for clinical or research purposes at the Erasmus MC between 1 January 2009 and 31 August 2014, and with >3 months interval between the two examinations were screened. Patients in whom the same non-culprit native coronary segment ≥5 mm in length and located >5 mm beyond the edge segment of an implanted device was identified in both pullbacks were finally included. Exclusion criteria were invasive treatment of a non-culprit lesion between baseline and follow-up, poor image quality, and saphenous vein graft lesions.
OCT IMAGE ACQUISITION
OCT was performed according to our catheterisation laboratory practice using the C7 OPTIS™ imaging system and Dragonfly™ catheter (LightLab/St. Jude, St. Paul, MN, USA), or the Lunawave® system with the FastView® catheter (Terumo Corp., Tokyo, Japan)5.
OCT ANALYSIS
REGION OF INTEREST (ROI) AND SEGMENT MATCHING
Matching was performed using dedicated software (QCU-CMS; LKEB, Leiden, the Netherlands). Baseline and follow-up pullbacks were simultaneously reviewed for identification of a matched native coronary segment. Segment identification was based on anatomic (side branches) or device-specific (stent edges) landmarks. As longitudinal catheter motion does not allow precise co-registration by a single landmark and length information6, multiple landmarks were selected, including stent edges and side branches to improve precision, and segment co-registration was performed. This allowed synchronised scrolling, used to identify frame numbers corresponding to the same segment in the two pullbacks, thus comprising the ROI. For segment-level analysis, the baseline ROI was divided into subsegments of an arbitrary length of 5 mm, allowing minimisation of potential co-registration errors by decreasing the segment-to-landmark ratio. The segments were matched after identification of corresponding frames by synchronised scrolling.
LUMEN MEASUREMENTS
Lumen measurements were performed every 1 mm, and mean and minimal lumen area were calculated for patient and segment level.
PLAQUE ANALYSIS
Plaque morphology was assessed for patient and segment level at 1 mm intervals within the ROI, using commonly accepted definitions7. Lipid core and calcium were recorded and their arc (in º) was measured. Measurements included mean and maximum lipid core and calcium arc, and also relative volumetric indices of lipid core and calcium content.
The relative lipid core index (RLCI) was calculated as:
RLCI=(mean lipid core arc×lipid core length)/(360×analysed length).
Similarly, the relative calcium index (RCI) was calculated as:
RCI=(mean calcium arc×calcium length)/(360×analysed length).
The cap overlying lipid core was measured over its entire surface by a semi-automated algorithm, with subsequent manual corrections if necessary8. The minimum and average cap thicknesses per patient and per segment were then calculated7.
INTER-STUDY VARIABILITY
As analysis of matched segments might contain bias of global measurements6, inter-study variability was calculated9. In 10 random patients, five at baseline and five at follow-up, a second pullback of the same vessel at the same interval was analysed. Matching was performed as described above, and OCT analysis was performed. Bias and 95% limits of agreement for OCT metrics were calculated, and only differences from baseline to follow-up beyond the limits of agreement were considered relevant. Intra- and inter-observer variability was assessed in the same segments9.
HIERARCHICAL PLAQUE CHARACTERISATION
Plaque characterisation was performed for patient and segment level using a hierarchical definition (Figure 1).
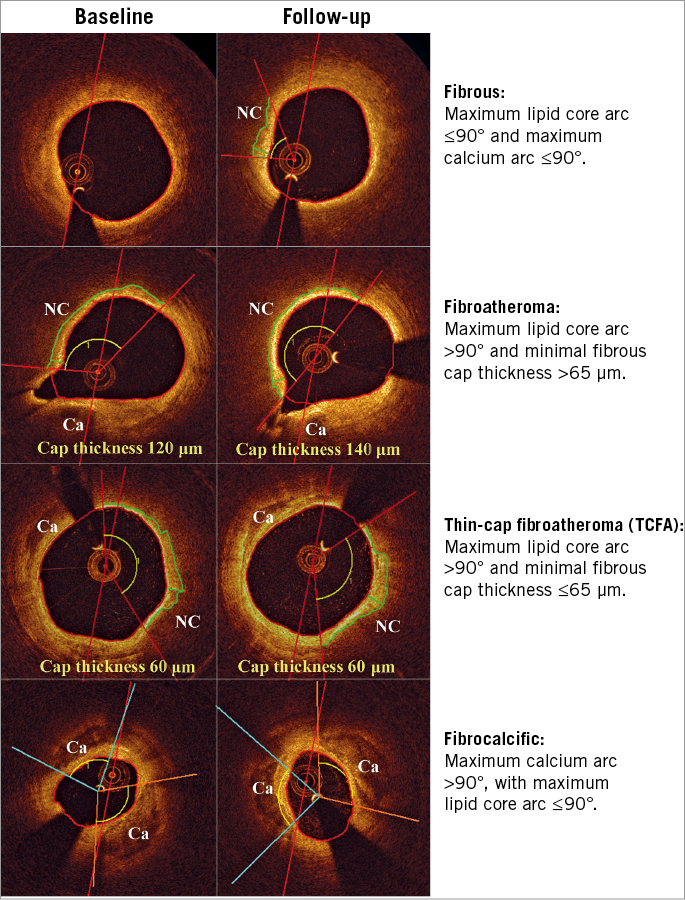
Figure 1. Hierarchical plaque classification. Representative examples of fibrous plaque, fibroatheroma, thin-cap fibroatheroma and fibrocalcific plaque. Red lines denote lipid core localisation, and green lines cap segmentation. Ca: calcium; NC: lipid core
ATTENUATION ANALYSIS
We applied quantitative plaque characterisation by attenuation analysis4. The attenuation coefficient is a robust tissue optical parameter, increased in lipid core and tissue macrophages, compared to calcium and fibrous tissue10. Values of attenuation coefficient for the entire perimeter of each cross-section for the entire studied segment were graphically plotted in a longitudinal attenuation vessel map. This display depicts the maximum attenuation between lumen and intima-media border11. Thereby the index of plaque attenuation (IPA) is derived. IPA is a global attenuation metric calculated as the fraction of pixels in the attenuation map with an attenuation coefficient greater than a certain threshold x, multiplied by 1,000:
![]()
where the numerator includes pixels with attenuation greater than a certain threshold x. For this study, IPA6 and IPA11 were calculated. IPA6 has been associated with fibroatheroma and IPA11 is a better discriminator of thin-cap fibroatheroma (TCFA)4.
STATISTICAL ANALYSIS
All analyses were performed with SPSS, Version 20.0 (IBM Corp., Armonk, NY, USA). Continuous variables are presented as mean±SD or median (interquartile range [IQR]), while categorical variables are presented as count (percentage). Mixed model regression for repeated measurements assessed differences in quantitative characteristics between baseline and follow-up (reported as estimates [95% confidence intervals]), and predictors of changes. Mixed logistic regression for repeated measurements assessed differences in qualitative characteristics and predictors of favourable and unfavourable change in plaque morphology. For segment-level analyses, due to the segment clustering within patients, a random intercept adjusted for within-patient correlations. All p-values are two-sided with a value <0.05 indicating significance.
Results
One-hundred and nineteen patients were screened. Thirty-four were excluded due to inadequate length, four due to different branch visualisation, six due to venous graft, two due to poor image quality, and one due to intervention in the studied segment between the two studies. Overall, 72 patients were included.
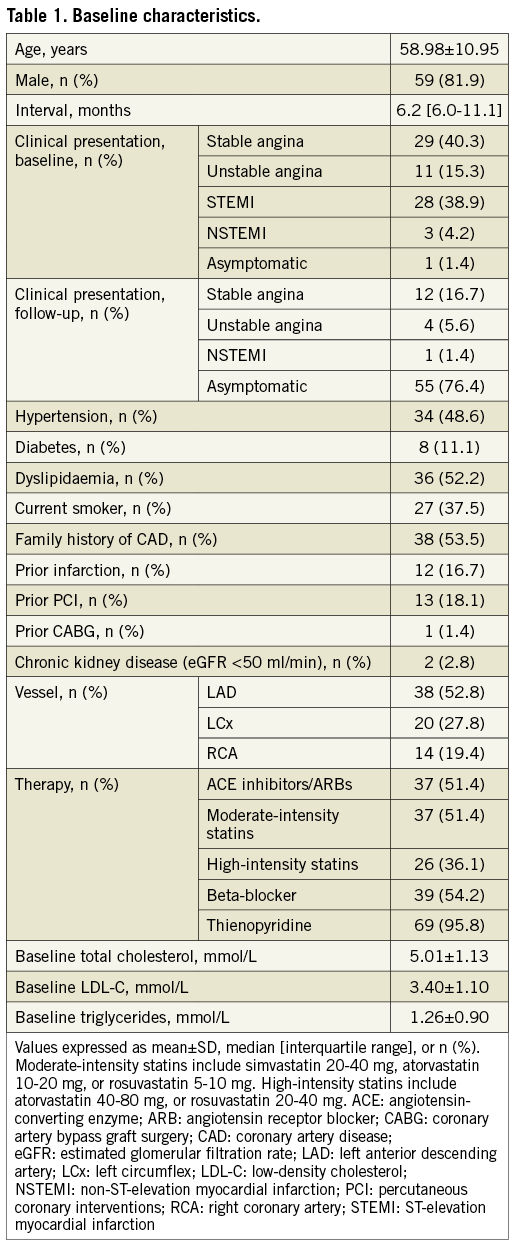
Baseline clinical characteristics are reported in Table 1. The median follow-up was 6.2 months (IQR 6.0-11.1 months). The follow-up interval did not differ significantly in patients undergoing repeat catheterisation either for follow-up purposes or for recurrent symptoms (median 6 months [IQR 6-9 months] versus 8 months [6-18 months], p=0.08). A mean vessel length of 17.83±9.22 mm and 17.65±9.00 mm was analysed for baseline and follow-up, respectively.
INTER-STUDY VARIABILITY OF OCT MEASUREMENTS
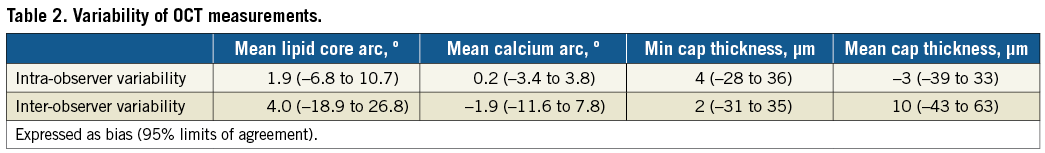
Inter-study variability was low overall. Based on the analysis, thresholds indicating relevant change were set at ±0.5 mm² for minimum lumen area (bias: –0.11 mm² [95% limits of agreement: –0.45 to 0.23 mm²]), ±1 mm² for mean lumen area (–0.21 mm² [–1.03 to 0.61 mm²]), ±20º for lipid core arc (mean: 0.1º [–18.2 to 18.4º]; max: 1.6º [–10.5 to 13.6º]), ±7% for RLCI (1.0 [–5.4 to 7.5]), ±10º for calcium arc (mean: –0.3º [–4.7 to 4.1º]; max: –2.2º [–18.4 to 14.0º]), ±5% for RCI (0.5 [–1.5 to 2.5]), and ±40 μm for cap thickness (minimum: 8 μm [–34 to 50 μm]; mean: –5 μm [–39 to 29 μm]). Table 2 summarises intra- and inter-observer variability.
CHANGES IN OCT MORPHOLOGICAL CHARACTERISTICS
PATIENT-LEVEL ANALYSIS
Mean lumen area decreased at follow-up (7.87±3.68 mm2 versus 8.22±3.63 mm2 at baseline; p=0.049). However, no changes were observed in patient-level plaque morphology. Average but not minimal cap thickness increased over time, while IPA11 but not IPA6 had a borderline decrease (p=0.049). Relevant changes in lumen dimensions, calcium arc and cap thickness were observed in a few patients (30-35%); however, >50% had relevant differences in maximum lipid core arc, with one third presenting with lipid core increase (Table 3).
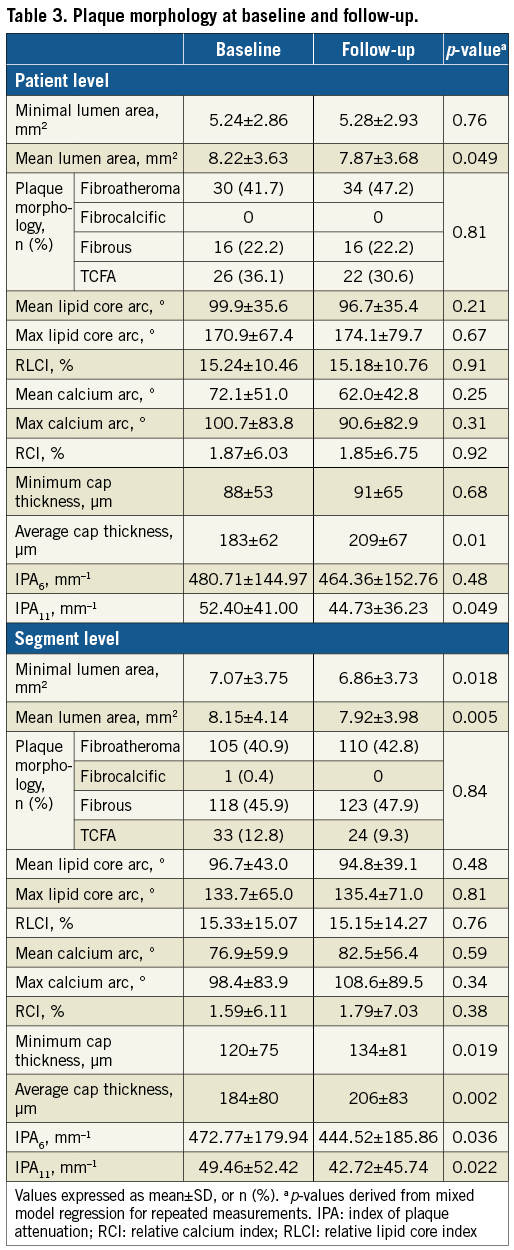
SEGMENT-LEVEL ANALYSIS
Overall, 257 non-culprit segments were assessed. Both minimal and mean lumen area were significantly decreased at follow-up (p=0.018 and p=0.005, respectively). There were no significant differences in lipid core or calcium metrics between the two intervals. However, both minimum and average cap thickness were increased at follow-up compared to baseline (p=0.019 and p=0.002, respectively). Additionally, IPA6 and IPA11 at follow-up were significantly decreased (p=0.036 and p=0.022, respectively). Relevant changes of lumen dimensions and calcium arc were observed in a few segments (<40%), whereas >50% had relevant changes in cap thickness and maximum lipid core arc (Table 3).
CHANGES IN HIERARCHICAL PLAQUE MORPHOLOGY
The changes are summarised in Table 3, Table 4, Figure 2, and Figure 3.
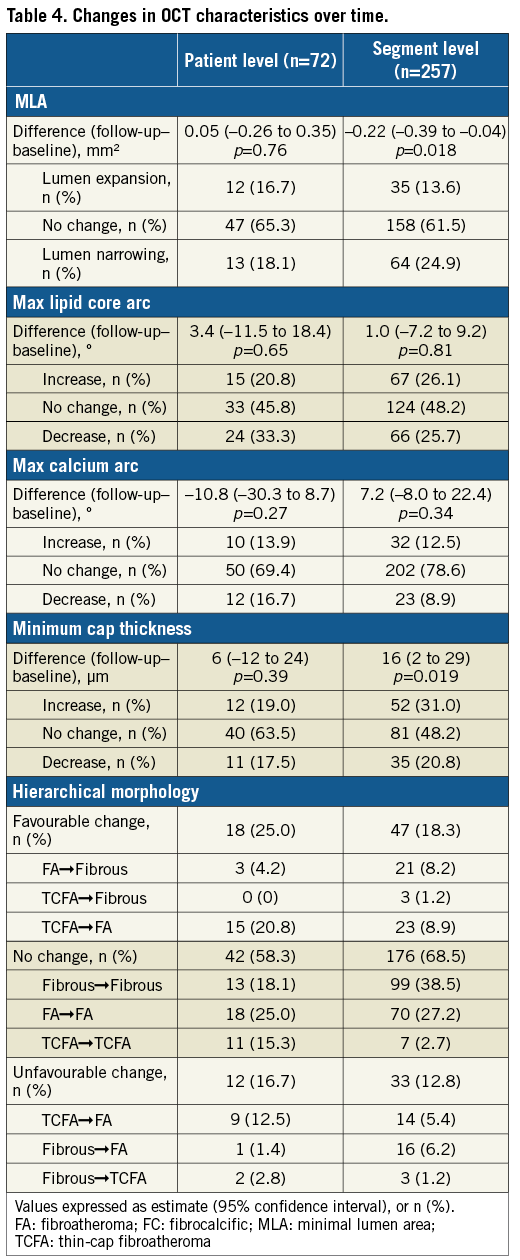
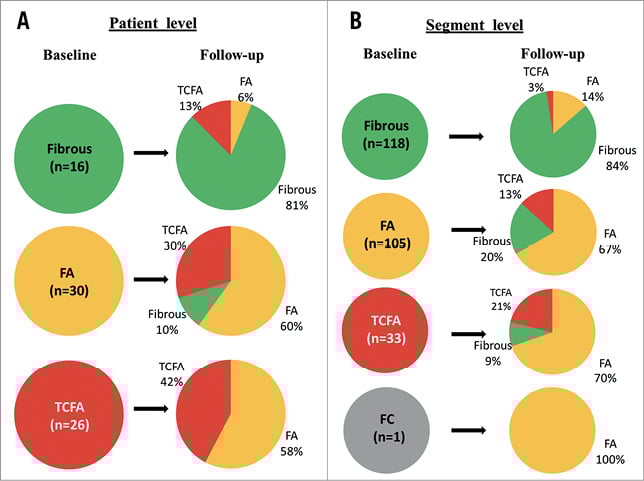
Figure 2. Changes in hierarchical plaque morphology. A) Patient level. B) Segment level. FA: fibroatheroma; FC: fibrocalcific; TCFA: thin-cap fibroatheroma
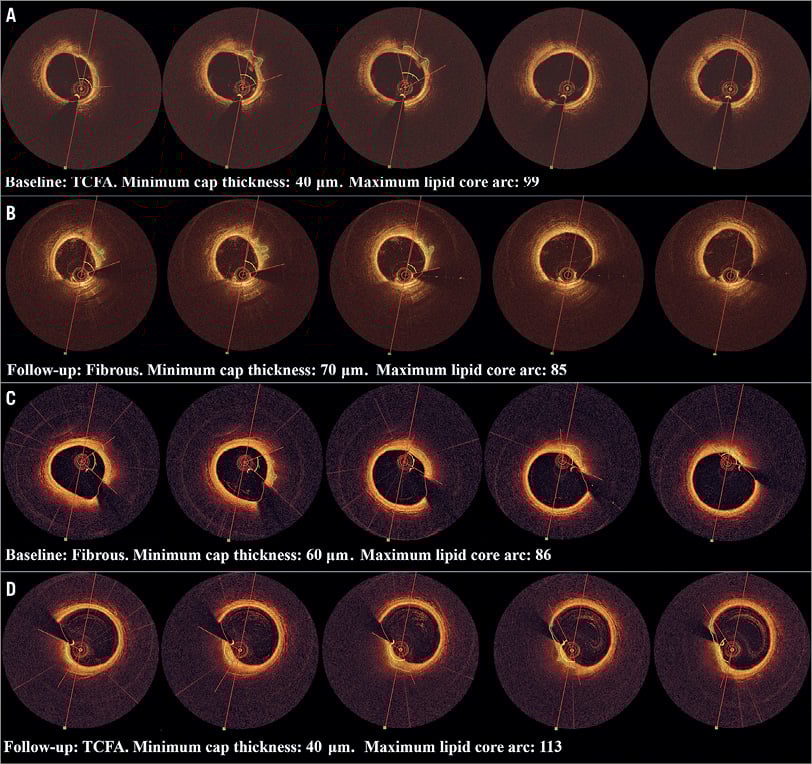
Figure 3. Examples of segment-level change. A) & B) From TCFA to fibrous. C) & D) From fibrous to TCFA.
PATIENT-LEVEL ANALYSIS
In most patients (58.3%), plaque morphology did not change. In 25%, plaque morphology had a favourable change (i.e., from TCFA to fibroatheroma, or from fibroatheroma/TCFA to fibrous), with an unfavourable change (i.e., from fibrous to fibroatheroma/TCFA, or from fibroatheroma to TCFA) in 16.7%. Most fibrous plaques showed no morphological changes (81%). Interestingly, 58% of TCFAs were converted to fibroatheroma, while 30% of fibroatheromas gave rise to new TCFAs.
SEGMENT-LEVEL ANALYSIS
No changes were observed in 68.5% of segments. Favourable change was observed in 18.4%, and unfavourable in 12.9%. Similarly to patient-level analysis, >80% of fibrous plaques had no morphological changes, while most TCFAs were converted to fibroatheromas, with new TCFAs emerging from 13% of baseline fibroatheromas. Consequently, the overall percentage of lesions with a specific morphology did not change over time (Table 4).
PREDICTORS OF CHANGE IN PLAQUE CHARACTERISTICS
Prediction of change in MLA, maximum lipid core arc, maximum calcium arc, and minimum cap thickness from clinical factors and angiographic variables was examined for all variables of Table 1, but it was poor. Time interval was associated with a decrease in MLA (b=–0.04 [–0.01 to –0.07]; p=0.004), whereas family history of CAD was associated with an increase (b=0.40 [0.04 to 0.75]; p=0.029). From angiographic variables, LCx lesions had a higher MLA increase compared to RCA lesions (b=0.57 [0.02 to 1.12]; p=0.043), while location distal to the stented segment was associated with a decrease in maximum lipid core arc compared to proximally located lesions (b=–20.27 [–38.06 to –2.48]; p=0.026). Baseline morphology was also not predictive of changes in these variables.
Predictors of favourable or unfavourable change in plaque morphology were examined, with the only significant negative predictor of favourable change being family history of CAD (OR: 0.383 [0.188-0.781]; p=0.009). Lesion location in the LAD or LCx predicted less frequent favourable change and more frequent unfavourable change compared to the RCA, albeit not reaching significance.
ATTENUATION ANALYSIS AND PLAQUE MORPHOLOGY
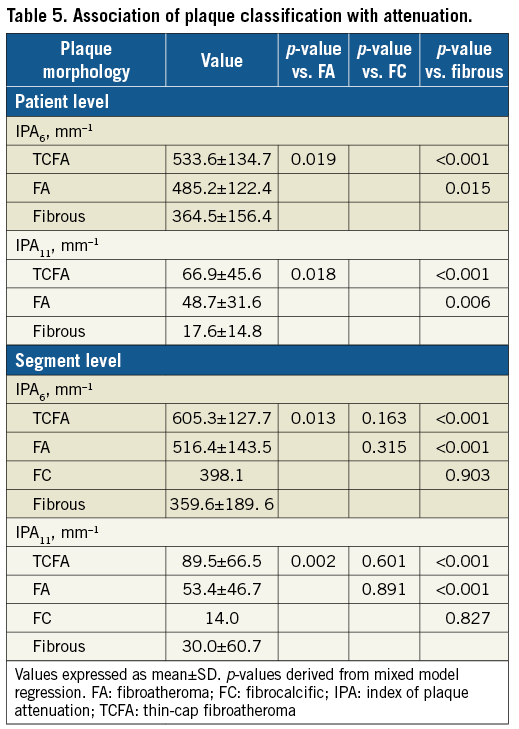
Attenuation patient- and segment-level analyses per plaque type are presented in Table 5. In both analyses, IPA6 and IPA11 differed significantly between plaque types, with values of both attenuation coefficients higher for TCFA compared to fibroatheroma or fibrous, and higher for fibroatheroma compared to fibrous (all p-values <0.05). Both indices had a strong positive correlation with lipid core metrics and a strong negative correlation with cap thickness (p<0.001), also after adjustment for the time interval.
EXAMPLE OF CLINICALLY RELEVANT MORPHOLOGICAL CHANGE
There was only one patient with a new clinical syndrome attributed to lesion progression (Figure 4). This patient who had undergone stent implantation in the RCA due to NSTEMI presented with stable angina 20 months later due to progression of a moderate mid LAD lesion. OCT revealed progressive lumen narrowing in a fibroatheroma, distal to a segment with several sites of plaque rupture. Interestingly, in the same patient there was lipid core reduction and lumen expansion in a proximal lesion.
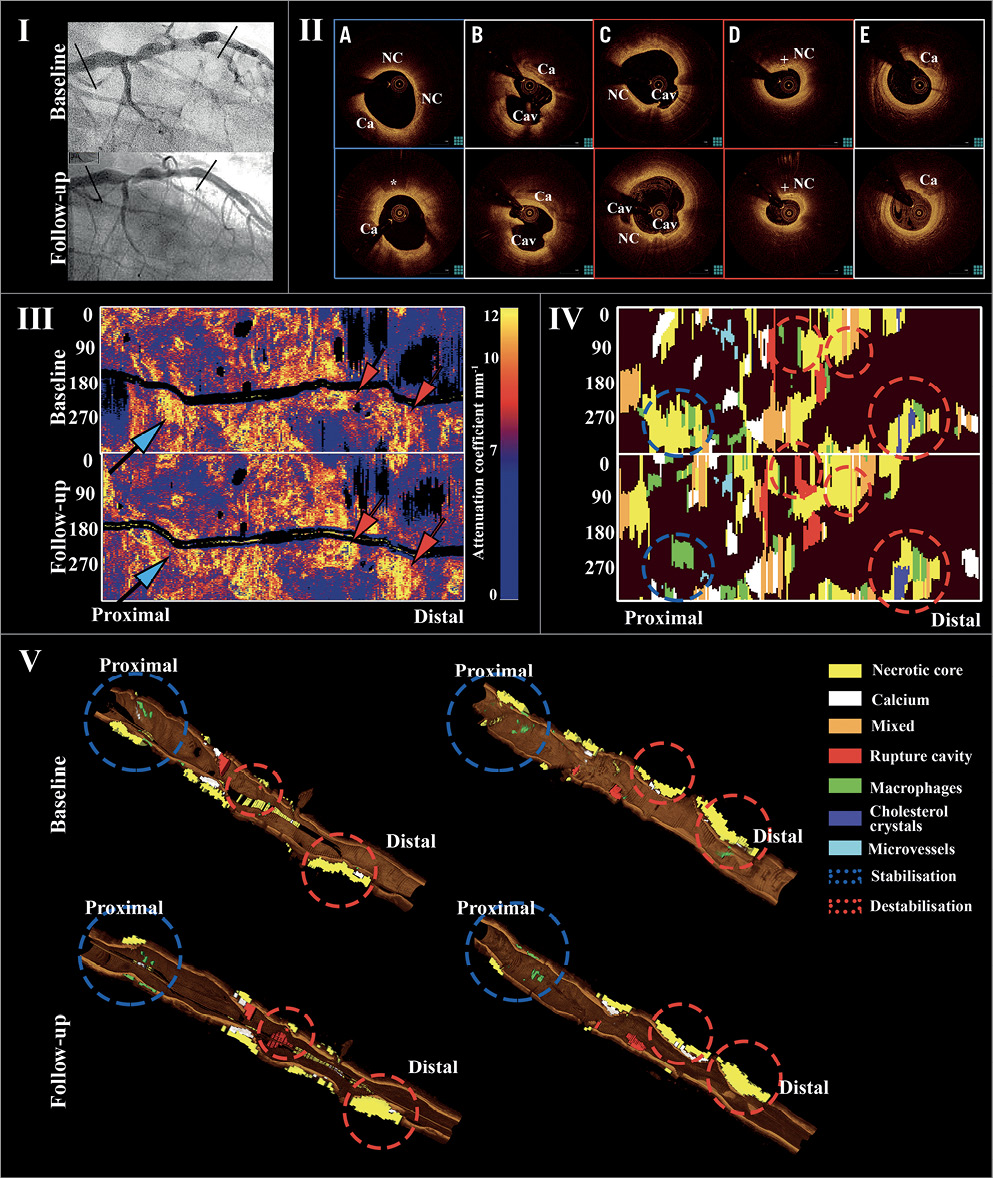
Figure 4. Example of clinically evident non-culprit lesion progression. I. Angiogram of LAD in a person presenting with new anginal symptoms 20 months after PCI of LCx for unstable angina. II. Cross-sectional OCT showing progressive narrowing at a fibroatheroma distally (D). Mid segment, two plaque rupture sites at baseline, with development of third rupture site at follow-up (B & C). Proximally, fibroatheroma with lipid core regression at follow-up (A). E) Distal segment with small calcification and no significant morphological or luminal differences. *macrophages. + cholesterol crystals. Ca: calcium; Cav: cavity; NC: lipid core. III. Attenuation spread-out maps showing the longitudinal distribution of maximum attenuation coefficient values along the studied segment at baseline and follow-up. One site proximally had a reduction (blue arrow), and two mid and distal sites an increase (red arrow). IV. Plaque spread-out maps with colour-coded tissues demonstrating lipid core reduction proximally (blue circles), a new rupture at the mid segment and lipid core increase distally (red circles). V. Three-dimensional views demonstrating these morphological changes (QAngioOCT 3D; Medis Specials bv, Leiden, the Netherlands).
Discussion
In the current study, we performed comprehensive patient-level and segment-level OCT analyses of non-culprit plaque morphology, for evaluating dynamic changes of atherosclerosis under standard medical treatment. To our knowledge, this is the first study to have used systematic OCT analysis over multiple coronary segments with meticulous matching, for assessing morphological changes over time. Quantitative attenuation analysis further corroborated findings from conventional plaque characterisation. Our main findings were that, in patients with CAD: 1) change in non-culprit plaque morphology over time occurs frequently, namely in 42% of patients and 31% of segments; 2) there are large differences between individual patients and segments with both favourable and unfavourable changes; 3) the frequent morphological changes are unapparent when averaged in the cohort; 4) a modest fibrous cap thickening is observed in individual segments, leading to increase of patient-level average cap thickness, but not of the minimal cap thickness; 5) these changes are rarely accompanied by clinical manifestations; and 6) prediction of these changes from clinical factors and based on initial morphology is poor.
CHANGES OF NON-CULPRIT PLAQUE MORPHOLOGY OVER TIME
Although pathologic studies have demonstrated a pivotal role for plaque morphology in ACS pathogenesis1, the processes underlying changes in plaque morphology in vivo are poorly understood. A previous OCT study with single-frame analysis demonstrated lesion progression and regression over 12 months at a similar incidence of ~30%, and no significant change in ~40%. Interestingly, plaque stabilisation with reduction of TCFA incidence was observed regardless of luminal changes12. In our study, at a median of six months, plaque phenotype changed in 42% of patients and 31% of non-culprit segments, which was more commonly observed in TCFAs and fibroatheromas. Although fibrous plaques did not change as often, due to their high prevalence the absolute number of fibrous plaques with unfavourable change was higher than the corresponding number of fibroatheromas, showing that all plaque types are prone to favourable or unfavourable changes.
CHANGE IN FIBROUS CAP THICKNESS
Fibrous cap thickness is a major determinant of plaque vulnerability1. In our study, minimum and average segment-level cap thickness increased from baseline to follow-up by 15-20 μm. Similarly, an increase in cap thickness over short segments has been demonstrated after statin administration13. The increase in segment-level minimum cap thickness in our study led to an increase in patient-level average cap thickness, but not patient-level minimum cap thickness. Thus, the focal instability per patient as expressed by patient-level cap thickness remained the same, despite a favourable effect on average on the sum of the plaques. Accordingly, a non-negligible percentage of segments (21%) had fibrous cap thinning. This suggests that, although statin treatment might promote plaque stabilisation on a population level and even on a coronary tree level, this effect is not observed in all patients and in all individual segments, with observations of cap thinning in specific patients or segments despite intensive systematic therapy. This might call for additional or alternative (eventually local) therapeutic concepts and a tailored approach.
CLINICAL RELEVANCE
Previous studies have demonstrated an association of non-culprit plaque morphology by virtual histology intravascular ultrasound (VH-IVUS) with future adverse coronary events2. Yet, this association was only modest, considering the low incidence of adverse events and a high prevalence of VH-TCFA (40-60%), and could be largely explained by limitations of VH-IVUS in detection of lipid core and thin fibrous cap14,15. Our study underscores another important limitation of intracoronary imaging in identifying high-risk plaques. Even with high-resolution imaging, such as OCT15, we demonstrated that plaque morphology on its own is subject to dynamic changes that might occur without clinical manifestations, and therefore its potential use as a prognostic tool is questionable. Even in our observation of clinically relevant progression due to progressive luminal narrowing, plaque regression was observed in another segment, supporting the hypothesis that morphological plaque changes are highly localised and observed on plaque level rather than patient level. Moreover, these morphological changes were poorly predicted by patient-level or lesion-level factors, implying a limited ability to predict lesion behaviour, possibly due to the effect of local haemodynamics on plaque morphology, with low wall shear stress being associated with reduction of luminal dimensions and development of high-risk plaque morphology16.
AUTOMATED PLAQUE CHARACTERISATION
Increased attenuation has been associated with lipid core and macrophages10. Attenuation analysis was in line with conventional OCT plaque characterisation showing increasing values of attenuation indices from fibrous to fibroatheroma to TCFA, corroborating our findings. Additionally, both segment-level IPA6 and IPA11 decreased over time, paralleling the increase in fibrous cap thickness. This finding together with the strong correlations of these indices with increased lipid core and reduced cap thickness suggests that this analysis could be employed for monitoring changes in plaque morphology over time.
Limitations
This is a small retrospective single-centre registry, and thus prone to the limitations of all retrospective, non-randomised studies. In order to account for the small sample, a comprehensive systematic analysis of plaque morphology was performed and further corroborated by quantitative analysis. Furthermore, using meticulously matched subsegments allowed us to study morphological changes in numerous segments and detect within-patient differences, not detectable by patient-level analysis. As an imaging registry, minor differences in patient characteristics compared to all patients undergoing catheterisation might exist5. As OCT lacks tissue penetration, it cannot elucidate mechanisms of luminal loss, which studies with a combination of intravascular ultrasound and OCT might reveal. Moreover, the absence of a pre-specified medical regimen does not allow generalisation of our findings. Although PCI could have modified non-culprit plaque morphology, excluding 5 mm stent edges minimises this possibility, while the finding of favourable or unfavourable change was the same in stented and non-stented arteries. Due to the limited patient sample size and the short follow-up, our study was underpowered for identifying an association between morphological changes and clinical events. Although the short follow-up hampers the long-term evaluation of the dynamics of plaque morphology, it demonstrates that changes are frequently observed over short time periods13,16.
Conclusions
In non-culprit coronary segments of patients with CAD under standard medical therapy, fibrous cap thickness increases over time, resulting in an increase of patient-level average cap thickness, whereas patient-level minimal cap thickness does not change. Moreover, morphological changes over time in individual segments, both favourable and unfavourable, are frequent and highly heterogeneous.
| Impact on daily practice Our findings add to the current understanding of progression of non-culprit segment atherosclerosis in vivo under standard medical therapy. The finding of dynamic changes occurring even in different segments of the same patient underscores the limitations of current imaging methods in detection of high-risk plaques15, and a need for identification of additional markers of plaque instability17. Consequently, this calls for new or hybrid imaging modalities, that can better discriminate in vivo progression-prone plaques associated with increased risk for future events. |
Funding
The Thoraxcenter has received research grants from St. Jude Medical and Terumo Europe.
Conflict of interest statement
B.C. Zhang received financial support from China Postdoctoral Science Foundation Research Funds (Grant: 2013M540468), The Natural Science Foundation of Jiangsu Province (Grant: BK20141137), National Natural Science Foundation of China (Grant: 81670393), China Scholarship Council Fellowship (Grant: 201308310403), Jiangsu Provincial Medical Youth Talent (Grant No: QNRC2016779), and The Science and Technology Department of Xuzhou City (Grant No: KC16SY158). A. Karanasos and J. van der Sijde received research support from St. Jude Medical outside the submitted work. R.J. van Geuns received speaker’s fees from Abbott Vascular. The Erasmus MC has a patent licensing agreement with Terumo Corporation and G. van Soest may receive royalties as part of this agreement. The other authors have no conflicts of interest to declare.