Abstract
Aims: Local wall shear stress (WSS) plays an important role in the onset of atherosclerotic plaque formation; however, it does not fully explain plaque progression and destabilisation. We aimed to investigate for the first time the influence of multidirectional WSS features on plaque progression and plaque composition changes in human coronary arteries.
Methods and results: Coronary artery imaging using biplane angiography and virtual histology intravascular ultrasound (VH-IVUS) was performed in twenty patients with coronary artery disease at baseline and after six-month follow-up. Three-dimensional surfaces of the coronary arteries were generated using the coronary imaging and, together with patient-specific flow measurements, different WSS features (multidirectional and conventional time-averaged WSS [TAWSS]) were determined at baseline using computational fluid dynamics (CFD). The changes in plaque component area over the six-month period were determined from VH-IVUS. Changes in plaque composition rather than plaque size were primarily associated with the (multidirectional) WSS at baseline. Interestingly, regions simultaneously exposed to low TAWSS and low multidirectional WSS showed the greatest plaque progression (p<0.001).
Conclusions: In this patient study, several multidirectional WSS features were found to contribute significantly to coronary plaque progression and changes in plaque composition.
Introduction
Atherosclerotic plaques develop in regions exposed to low and oscillatory blood flow-induced wall shear stress (WSS)1,2. Low WSS creates a pro-atherogenic environment and is therefore involved in plaque initiation by stimulating the endothelial expression of pro-inflammatory genes and proteins3. Furthermore, WSS is recognised for its role in plaque growth and changes in plaque composition towards a high-risk vulnerable plaque4,5,6.
However, the magnitude of WSS is insufficient to predict plaque growth or plaque compositional changes fully7. Multidirectional WSS is a measure for change in the direction of the shear stress during the cardiac cycle. Therefore, Peiffer et al suggested that multidirectional WSS may also be important in lesion development8. From the biological point of view, multidirectional WSS affects endothelial cell morphology and function. Upon exposure to laminar flow, the endothelial cells align with the favourable main flow/WSS direction, which is related to the induction of atheroprotective signalling pathways. In contrast, multidirectional WSS can cause cell inability to align, which in turn is associated with induction of inflammatory pathways9,10.
Transverse WSS (transWSS), a new multidirectional WSS metric, may be important in atherosclerosis development. TransWSS is the WSS magnitude perpendicular to the main flow direction8. Regions with high transWSS co-localised with lipid deposition in rabbits8, but its effect on plaque progression and plaque composition changes is unknown. The same holds true for the normalised transWSS (cross-flow index [CFI]11 and other well-known multidirectional WSS metrics, oscillatory shear index [OSI] and relative residence time [RRT]12).
To the best of our knowledge this is the first study to investigate the clinical relevance of transWSS and other multidirectional WSS metrics on progression and destabilisation of atherosclerosis in human coronary arteries in a longitudinal study.
Methods
SUBJECTS
From December 2007 to January 2009, twenty patients presented to the catheterisation laboratory at Emory University Hospital with either an abnormal non-invasive stress test or stable angina syndrome. An invasive physiological evaluation of a non-obstructive lesion was performed. All patients received optimal medical therapy including 80 mg atorvastatin daily. The inclusion and exclusion criteria were described previously6. After six months, a repeat catheterisation was performed to assess changes in plaque morphology. In each patient the most proximal part of the left anterior descending (LAD) artery was investigated. The study complied with the Declaration of Helsinki and was approved by the Emory University Institutional Review Board. Each patient provided written informed consent.
IMAGING ACQUISITION AND RECONSTRUCTION
The left coronary arteries were visualised using biplane angiography (Philips Medical Systems, Andover, MA, USA). From these images, back projection image analysis (QAngio XA 3D RE; Medis, Leiden, the Netherlands) was used to determine the catheter path. Doppler-derived velocity measurements were performed in the left main coronary artery using the ComboWire® (Volcano Corporation, Rancho Cordova, CA, USA). To obtain detailed lumen and vessel wall composition information, virtual histology intravascular imaging (VH-IVUS) was performed using a phased-array 20 MHz Eagle Eye® Gold catheter (Volcano Corporation) (Figure 1A). The pullback speed was 0.5 mm·s–1; ECG gating was performed at the peak of the r-wave. The VH-IVUS pullback length was at least 60 mm and contained at least two side branches, which were later used as landmarks for the three-dimensional (3D) geometry reconstruction. In some cases, a shorter region was imaged and in several cases 3D reconstruction of the full 60 mm was not possible due to severe vessel overlapping in the angiography images. Based on fusion information from the different imaging modalities, the left coronary artery was 3D reconstructed, including the left main coronary artery and major side branches13.
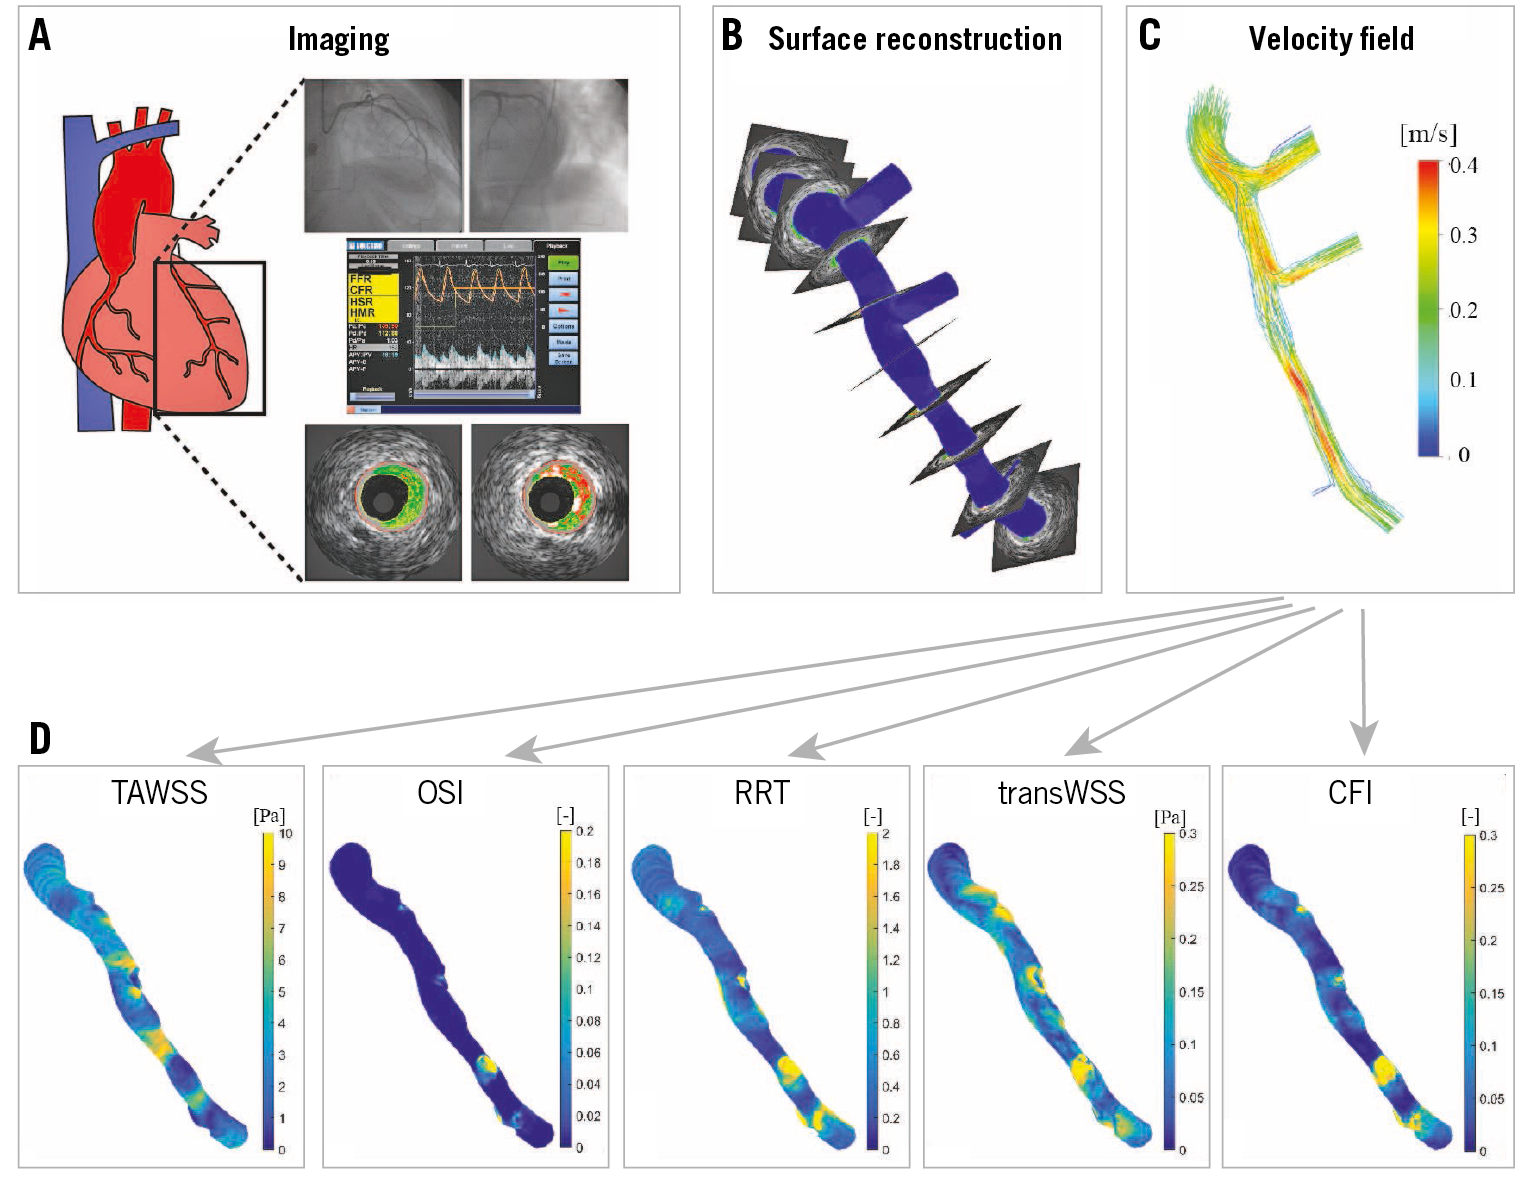
Figure 1. Schematic overview of the methods. A) Biplane angiography, Doppler-derived velocity measurements and virtual histology intravascular ultrasound (VH-IVUS). B) Lumen surface 3D reconstruction was obtained by stacking the VH-IVUS based lumen contours perpendicular to the biplane angiography-derived 3D centreline. Local velocities (C) and multidirectional WSS metrics (time-averaged wall shear stress [TAWSS], oscillatory shear index [OSI], relative residence time [RRT], cross-flow index [CFI] and transverse wall shear stress [transWSS]) (D) were determined using computational fluid dynamics.
COMPUTATIONAL FLUID DYNAMICS AND ANALYSIS
Computational fluid dynamics (CFD) was applied to perform transient WSS calculations (ANSYS Fluent 15; ANSYS, Inc., Canonsburg, PA, USA) in this 3D reconstruction (Figure 1B-Figure 1D),14. As flow input, 80% of the instantaneous peak velocity measured by the ComboWire was chosen arbitrarily (as a rounded midpoint between 50 and 100%). The flow was imposed as a plug profile at the inlet to represent the aorta plug-like velocity. All the other outlets were assumed to be pressure-free. In addition to the time-averaged WSS (TAWSS), the OSI, RRT, transWSS and CFI were also calculated (Supplementary Table 1). The differences in these parameters are shown in Supplementary Figure 1.
The acquired VH-IVUS images were exported from the VH-analysis software (echoPlaque 4.0; INDEC Medical Systems, Inc., Los Altos, CA, USA) and imported into a custom MATLAB subroutine to determine the composition and plaque area. The RGB pixel values, which are distinct across the four VH-IVUS identified plaque components (fibrous tissue [FT], fibro-fatty tissue [FF], necrotic core [NC], and dense calcium [DC]), were identified per cross-section.
The registration of baseline and follow-up IVUS was performed by a single expert investigator (P. Eshtehardi), who used a standardised protocol to identify landmarks (side branches and large calcific regions)15. Furthermore, the spacing between the IVUS images is nearly equivalent (0.5 mm) which made matching between baseline and follow-up images even more straightforward. The circumferential co-registration between baseline and follow-up was done with an automated framework which yielded excellent results16. The multidirectional shear stress metrics and plaque changes over time were quantified over 45° 3-mm regions (Figure 2) for further analysis13. A detailed description of the CFD and the analysis is presented in Supplementary Appendix 1-Supplementary Appendix 4.

Figure 2. Schematic representation of data analysis. A) Virtual histology intravascular ultrasound image at baseline and a matched image at follow-up. The white lines indicate the cross-sectional averaging in eight sectors (45°). B) 3 mm longitudinal averaging of the eight sectors leads to regions used in the final analysis.
STATISTICAL ANALYSIS
Based on previous studies, the TAWSS data were divided into three groups: low (0-1 Pa), intermediate (1-2.5 Pa), and high (>2.5 Pa)6. Thresholds for pathological levels of transWSS or CFI have never been explored in human coronary arteries. Therefore, we divided these metrics into three equally distributed groups (tertiles). This was also done for the RRT and OSI. A linear mixed-effects (LME) model was used to investigate the association between the WSS metric(s) (fixed effect) and plaque composition (dependent variable). The correlations between multiple plaque composition values are accounted for by using subject-specific random intercepts. This allows for vary-ing intercepts for each patient. In addition to fitting separate models for individual (multidirectional) shear stress features (TAWSS, OSI, RRT, transWSS, CFI), we included the following covariates in the LME model: TAWSS, CFI and their interaction (to test for synergetic effects). The statistical analysis was performed in R, version 3.3.2 (R Foundation for Statistical Computing, Vienna, Austria) using the LME4 package; p<0.05 was considered significant.
Results
GENERAL DATA
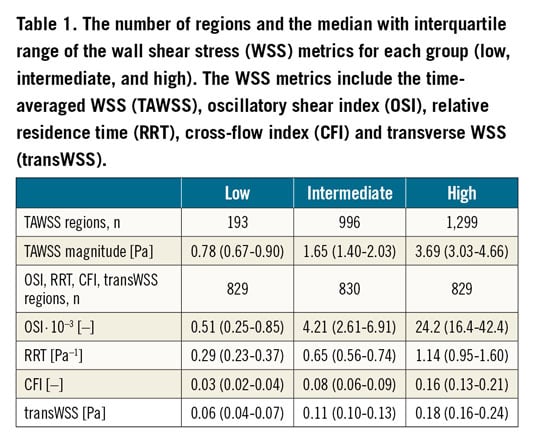
Baseline characteristics of the twenty patients have been described previously (Supplementary Table 2). In total, 1,846 VH-IVUS images were analysed with 107 (62.5-123) images per artery. From these images, 316 3-mm segments (18 [11-21] segments per artery) containing 2,488 regions (141 [86.5-165] regions per artery) were used for final analysis. The average values for the low, intermediate, and high categories of the different WSS parameters are presented in Table 1.
CONVENTIONAL SHEAR STRESS METRIC: TAWSS
Plaque area progression and composition changes were greatly influenced by exposure to baseline TAWSS. A significant inverse association between TAWSS and plaque progression (p=0.006) was observed, showing more plaque regression going from low TAWSS (–0.002±0.020 mm2) towards intermediate (–0.027±0.018 mm2) and high (–0.042±0.018 mm2) TAWSS (Figure 3, Supplementary Table 3). The other plaque constituents followed a similar significant decreasing pattern with increasing TAWSS. Significant differences were found between the low and high TAWSS groups of all the components except for FF tissue and NC.
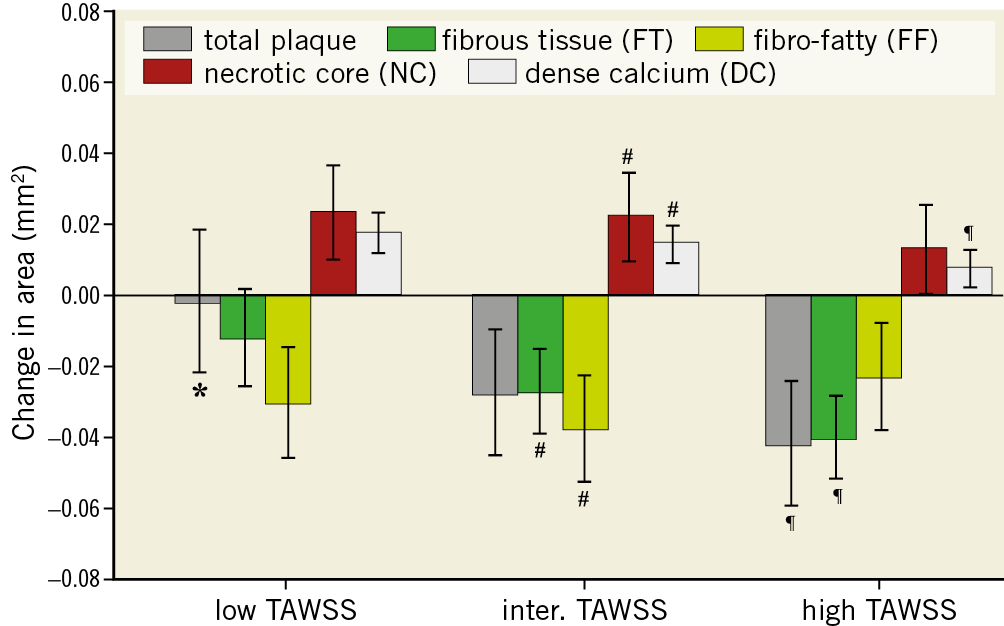
Figure 3. Plaque area and composition changes over a six-month period for plaques exposed to low, intermediate and high time-averaged wall shear stress (TAWSS). Error bars are the standard error. p<0.05: low versus intermediate (*), intermediate versus high (#) and low versus high (¶).
MULTIDIRECTIONAL SHEAR STRESS
In general, we observed that multidirectional WSS was primarily involved in altering the plaque composition rather than the plaque size. No significant difference in total plaque area changes was found in low vs high OSI regions (Figure 4A). An inverse relationship with OSI was found for FF tissue (p<0.001), implying the higher the OSI the more FF tissue regression. Significantly higher progression was found for NC area (p=0.001) and DC area (p<0.001) in the high OSI regions compared to the intermediate and low OSI regions, but no differences were observed for FT regression in these regions. Evaluation of the changes in plaque exposed to low vs high RRT revealed that plaques exposed to low RRT exhibited more regression of total plaque area (p<0.001) and FT (p=0.003) than plaques that were exposed to high RRT (Figure 4B). Similar to high OSI, high RRT regions showed more NC (p=0.008) and DC (p<0.001) progression and more regression of FF tissue (p=0.0003) than low RRT regions. A positive RRT relationship was found for DC (p<0.001) and FT (p=0.01), implying the higher the RRT the more DC progression and less FT tissue regression.

Figure 4. Plaque area and composition changes over a six-month period for plaques exposed to low, intermediate and high oscillatory shear index (OSI) (A) and exposed to low, intermediate and high relative residence time (RRT) (B). Error bars are the standard error. p<0.05: low versus intermediate (*), intermediate versus high (#) and low versus high (¶).
Different levels of transWSS did not significantly influence the total plaque growth, FT, and FF (Figure 5A). Regions exposed to high transWSS showed more progression of NC area (p=0.01) and DC area (p<0.0001) than regions exposed to low transWSS. Similar patterns were seen for the CFI (Figure 5B). Changes in total plaque area and FT were unaffected by different levels of CFI. There was a positive relation between CFI and the NC (p<0.002) and DC groups (p<0.001), and a negative relation for the FF tissue (p<0.001).

Figure 5. Plaque area and composition changes over a six-month period for plaques exposed to low, intermediate and high transverse wall shear stress (transWSS) (A) and cross-flow index (CFI) (B). Error bars are the standard error. p<0.05: low versus intermediate (*), intermediate versus high (#) and low versus high (¶).
CO-LOCALISATION OF TAWSS AND MULTIDIRECTIONAL SHEAR STRESS
To study whether plaque progression is influenced by multidirectional WSS additional to TAWSS, regions of low and high TAWSS were co-localised with low, intermediate, and high multidirectional WSS. The greatest progression of total plaque, FT and FF area was found in regions of low TAWSS co-localised with low and intermediate CFI (low CFI: 0.15 mm2, intermediate CFI: 0.10 mm2), which was much larger than the average plaque growth in low TAWSS (–0.001 mm2) (Figure 3, Figure 6, Supplementary Table 4). Further, the change in area in these groups was significantly greater than the change in area in the low TAWSS regions co-localised with high CFI (total plaque, FT, FF: p<0.0001). High TAWSS regions co-localised with low or high CFI demonstrated the greatest NC progression, while in high CFI regions the greatest regression was found for total plaque area, FT, and FF tissue. In high TAWSS regions, plaque regression (p<0.001) was observed in all the CFI groups, which resulted from significant changes in the plaque components FT (p<0.001), FF tissue (p<0.001), NC (p<0.001), and DC (p<0.001). A significant synergetic effect was found for all the components (p<0.001).
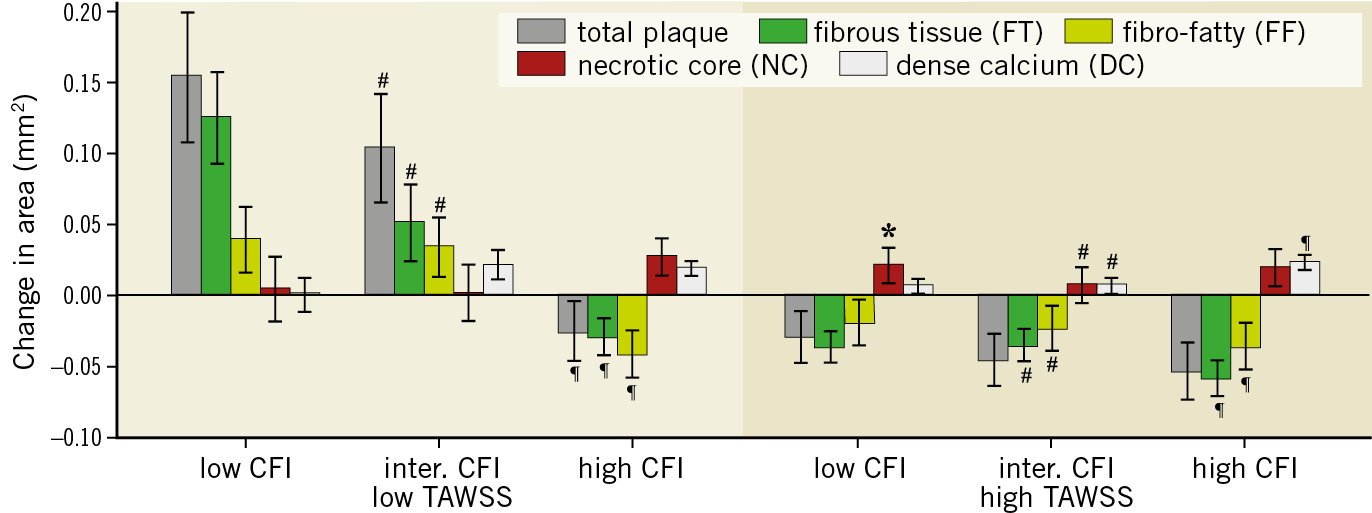
Figure 6. Plaque area and composition changes over a six-month period for plaques exposed to low or high time-averaged wall shear stress (TAWSS) co-localised with low, intermediate and high cross-flow index (CFI). Error bars are the standard error. p<0.05: low versus intermediate (*), intermediate versus high (#) and low versus high (¶).
The co-localisation of TAWSS with OSI (Supplementary Figure 2, Supplementary Table 5) showed a similar response to the co-localisation of TAWSS with CFI (Figure 6). However, the co-localisation results with RRT showed similar results to TAWSS alone (Supplementary Figure 3). Interestingly, in the co-localisation of high TAWSS with high RRT, plaque growth and plaque composition changes mimic more the high RRT response (Supplementary Figure 3, Supplementary Table 6).
Discussion
For the first time, the effect of TAWSS together with multidirectional WSS on plaque progression and compositional changes was investigated in the coronary arteries of patients with coronary artery disease (CAD). We showed that multidirectional WSS mainly contributes to changes in plaque composition, such that plaque vulnerability is increased, and less to changes in plaque size. Interestingly, regions with low TAWSS co-localised with low to intermediate CFI resulted in the greatest plaque progression; low TAWSS alone did not show significant plaque progression (Figure 3). High TAWSS, regardless of the CFI magnitude, was shown to influence characteristics of plaque vulnerability (i.e., total plaque area and FT regression, and NC progression).
TIME-AVERAGED WALL SHEAR STRESS
Our results on changes in plaque size and composition in regions with low and high TAWSS are in close agreement with previous studies6. It is under debate whether high-risk plaque development is associated with either low or high TAWSS17,18. We hypothesise that high TAWSS is atheroprotective in early atherosclerosis, but at later stages destabilises the plaque.
MULTIDIRECTIONAL SHEAR STRESS
Only one study has investigated the influence of multidirectional WSS on plaque progression and compositional changes in human coronary arteries13. This study measured oscillatory WSS as the maximum angle deviation of WSS over the cardiac cycle. Plaques that were exposed to low TAWSS co-localised with low oscillatory WSS showed large plaque progression whilst those which were co-localised with high oscillatory WSS showed transformation towards a vulnerable plaque phenotype. Both of these observations are in agreement with our study. However, that work did not address the individual effect of oscillatory WSS and the combined role of high TAWSS and multidirectional WSS in plaque progression and destabilisation13.
The influence of OSI and RRT on plaque initiation has been investigated previously. In murine aortas, plaque location was in better agreement with OSI and RRT than TAWSS19. A study in human coronary arteries showed that plaques are often located at low TAWSS regions20; however, both high OSI and RRT were more predictive for the presence of plaque. A caveat to this study was that they virtually removed the plaque in order to represent the healthy state of the artery and assessed the TAWSS, OSI and RRT in this manipulated geometry. Therefore, this study cannot be regarded as a true natural history study and comparisons should be interpreted with caution. We found a more pronounced effect of RRT and OSI on changes in plaque composition than plaque growth. Specifically, regions with the largest progression of NC and DC and regression of FF tissue were associated with high OSI and RRT.
A recently introduced haemodynamic metric to characterise another feature of multidirectional flow is transverse WSS (transWSS) or normalised transWSS (CFI). The present study shows that there is no effect of transWSS or CFI on plaque progression; however, it appears to influence plaque composition. Indeed, a number of studies suggest that an increase in multidirectional flow or transWSS is atherogenic9,21. In an in vitro study, endothelial cells subjected to transverse flow resulted in an increase in inflammation (increase in expression of NF-κB)9. In another study using rabbits, high transWSS was found at lesion sites, whereas this correlation was less apparent with either TAWSS or OSI21. This relationship was less evident in more mature rabbits. However, they did not study plaque composition, which in our study proved to be most affected by the transWSS. It should be noted that these studies were performed using either cultured cells or atherosclerotic animal models and hence may not be fully representative of the human case.
CO-LOCALISATION OF TIME-AVERAGED WALL SHEAR STRESS WITH MULTIDIRECTIONAL SHEAR STRESS
We present here, for the first time, data on low and high TAWSS regions co-localised with various multidirectional WSS parameters. In contrast to the low TAWSS, the plaque changes in the high TAWSS regions seem not so much influenced by the multidirectional WSS. Co-localisation of TAWSS with CFI and OSI showed the same patterns in plaque progression, which was expected because of the high correlation between these parameters (r=0.83).
Our data on plaque progression potentially suffer from regression-to-the-mean effects. This was investigated in a separate analysis by incorporating baseline plaque area into the LME model. We observed that plaque progression was still significantly related to all multidirectional WSS parameters. However, although still significant, it was less pronounced in the low TAWSS co-localised with low CFI regions. Therefore, the conclusions are all valid.
Limitations
All patients were treated with high doses of statins. With this therapy, an overall plaque regression is often observed. Therefore, the results that we obtained are a balance of pro-atherogenic haemodynamic conditions, e.g., low TAWSS, and the anti-atherogenic influence of statins. With current treatment strategy in CAD patients, these data reflect WSS-related plaque progression in this population.
Furthermore, our data on the relationship between plaque progression and (multidirectional) WSS were obtained in LAD arteries only. Although no data exist on possible differences in WSS-related plaque progression in the other coronary arteries, it cannot be excluded that the multidirectional WSS in these arteries has a larger range and therefore shows a different response.
VH-IVUS was used to assess the local plaque composition; however, VH-IVUS is under debate for its applicability to identify local plaque composition. Although some studies showed a moderate correlation between VH-IVUS and histology especially for the FF and NC tissue22,23, a number of studies showed >80% accuracy to identify FT, FF, NC, and DC compared to histology24. Therefore, in general, the relationships found between plaque components and multidirectional WSS reflect the actual changes in the tissue. However, conclusions with regard to FF and NC should be interpreted with caution.
The number of patients studied is limited. Therefore, multiple regions within a single coronary artery were analysed. To obtain independent samples, the data were averaged over 3 mm and circumferentially over 45°7,14. We opted for 45° sectors to ensure minimal loss in earlier observed details in the haemodynamic environment simultaneously with the highest possible accuracy in circumferential matching with follow-up data13,14. The circumferential registration algorithm showed a matching error of <10° in 78% of the cross-sections compared to manual image registration. This means that, of these cross-sections, 78%-100% of the sector was correctly matched. To account further for subject dependencies, for data analysis a sophisticated LME regression model was used. Using this approach, we obtained statistical significance, despite the limited number of patients. Besides, this study is an exploratory study and therefore the conclusions should be confirmed in a larger patient database.
Because we defined low TAWSS as <1 Pa, in the co-localisation analysis we ended up with a low number of regions exposed to both low TAWSS and low CFI (n=11) and low TAWSS and intermediate CFI (n=15), contrasting with the other groups in which at least 167 data points were present, possibly due to different boundary conditions as compared to previous studies7. Splitting the TAWSS data into tertiles would have resulted in a larger number of data points but would not have allowed study-ing the co-localisation with true low TAWSS. Despite the fact that these sample sizes were low, the statistics revealed strong effects in these regions.
Conclusions
In conclusion, this study shows that there are important associations between (multidirectional) WSS metrics and changes in plaque composition reflecting increased plaque destabilisation. Further, multidirectional flow acts synergistically with TAWSS on plaque composition and plaque size. Therefore, the combination of (multidirectional) WSS profiling and plaque imaging in combination with systemic risk factors is imperative to identify plaques that potentially develop into a vulnerable plaque.
|
Impact on daily practice Our data confirmed that TAWSS is a good predictor for locations of plaque growth. On top of that, multidirectional WSS provides information on changes in plaque composition and potentially detects regions with plaque destabilisation. Therefore, we recommend using both the TAWSS and one of the multidirectional WSS parameters. We suggest that the multidirectional parameter would be either OSI or CFI, since RRT and transWSS are dependent on TAWSS. |
Funding
Funding was received from the European Research Council under the European Union’s Seventh Framework Programme/ERC Grant Agreement n. 310457 and Vereniging Trustfonds Erasmus Universiteit Rotterdam.
Conflict of interest statement
A. Kok reports grants from the European Research Council and from Trustfonds during the conduct of the study. H. Samady reports grants and personal fees from Philips Volcano, grants from Abbott Vascular and Medtronic, during the conduct of the study, and other from SIG and Covanos, outside the submitted work. H. Samady and D. Molony have a patent pending for Methods and Systems for Determining Hemodynamic Information for One or More Arterial Segments. J. Wentzel reports a grant from the European Research Council during the conduct of the study. The other authors have no conflicts of interest to declare.
