The biplane angiographic data, acquired after implantation of an everolimus-eluting bioresorbable vascular scaffold (Absorb™ BVS; Abbott Vascular, Santa Clara, CA, USA) in the right coronary artery of a 46-year-old patient, were separately fused with frequency domain optical coherence tomography (FD-OCT) and intravascular ultrasound (IVUS) data to reconstruct the three-dimensional (3-D) anatomy. The local shear stress (SS) distribution in the FD-OCT- and IVUS-based models was assessed using computational fluid dynamics. The FD-OCT-based reconstruction (Figure 1A) allowed imaging of the lumen irregularities in the scaffolded segment due to strut protrusion (Figure 1B), which caused recirculation zones around the struts (Figure 1C). In contrast to the strut-induced heterogeneity of the haemodynamic micro-environment noted in the high resolution FD-OCT-based model (Figure 1D and Figure 1E; follow-up in Figure 1F), the IVUS-based reconstruction resulted in a smoother lumen surface and homogeneous SS distribution (Figure 1G) since strut protrusion was not visible in IVUS (Figure 1H and Figure 1I; follow-up in Figure 1K). The level of detail in the 3-D models had an effect on the relationship between baseline SS and six-month neointima thickness (Figure 1M and Figure 1N); this relationship was much stronger in the FD-OCT-based 3-D reconstruction. The fusion of FD-OCT/angiographic data coupled with blood flow simulation can be used to study in vivo the influence of the haemodynamic milieu on the scaffolded lumen surface on a micron level.
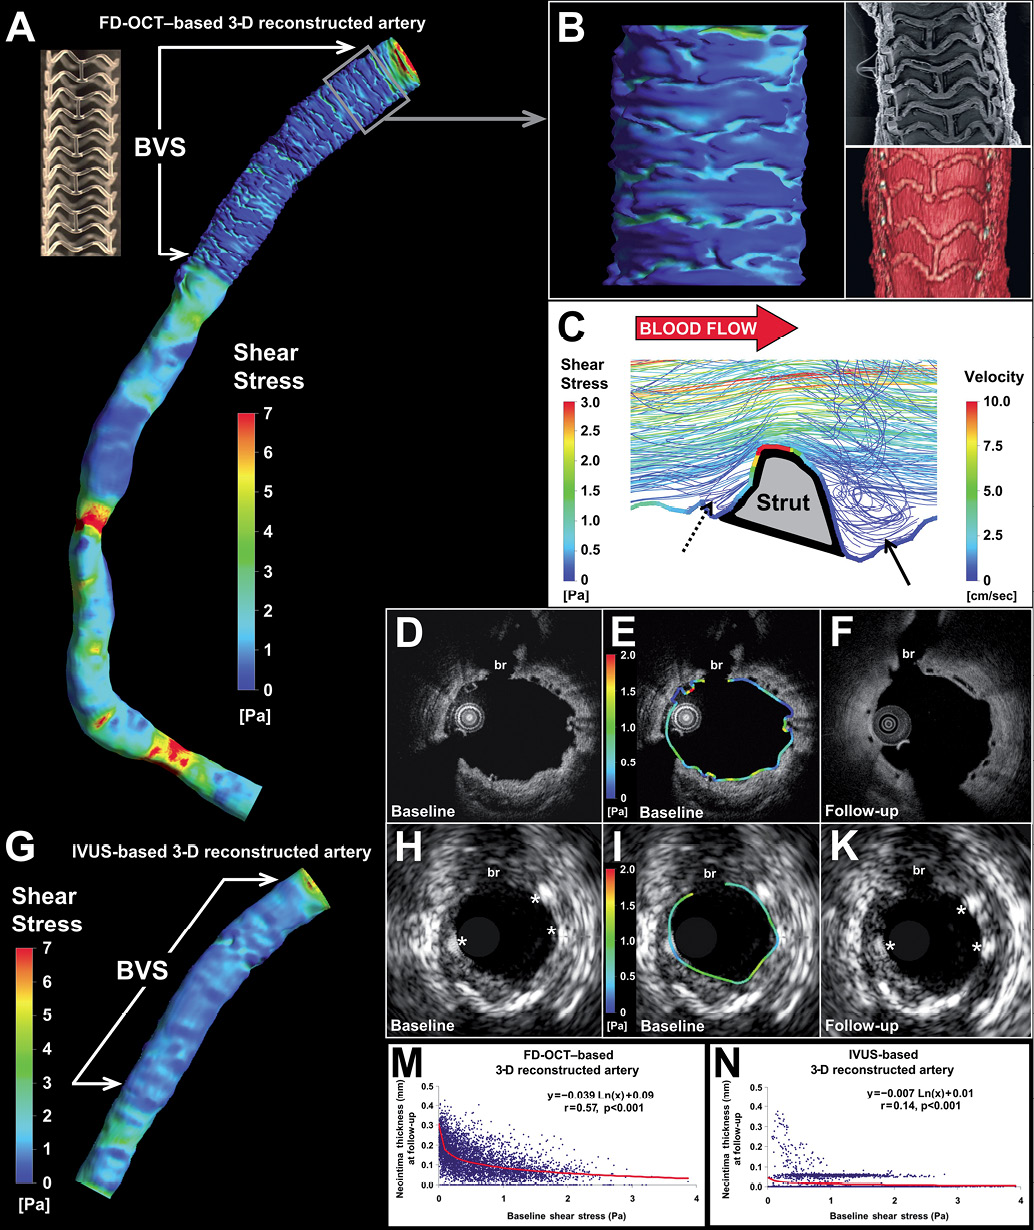
Figure 1. Three-dimensional reconstruction and local haemodynamic milieu in BVS.
Conflict of interest statement
The authors have no conflicts of interest to declare.
Appendix
CORONARY ARTERY IMAGING
Invasive imaging with biplane angiography, IVUS (pullback speed: 0.5 mm/sec; Eagle Eye® Gold Catheter; Volcano Corp., San Diego, CA, USA) and FD-OCT was performed post-scaffold implantation at baseline and at six-month follow-up. At baseline, FD-OCT imaging was performed using the Terumo OFDI system (Terumo Corp., Tokyo, Japan; pullback speed: 20 mm/sec; frame rate: 160 frames/sec; pullback length: 66.2 mm) during blood clearance by injection of contrast medium (injection pump: Mark V ProVis™; Medrad, Inc., Indianola, PA, USA; flow rate: 3 ml/sec; volume: 10 ml).
THREE-DIMENSIONAL CORONARY ARTERY RECONSTRUCTION
The high-speed pullback during FD-OCT image acquisition results in a very small number of end-diastolic images which, along with the continuous catheter translocation inside the moving coronary arteries, make the FD-OCT-based three-dimensional (3-D) reconstruction using conventional methods (i.e., based on the 3-D imaging catheter path) not possible. Therefore, we used a modified methodology for 3-D reconstruction using FD-OCT and angiographic data which was lately reported to provide geometrically correct 3-D models enabling reliable SS assessment in native segments1-3. In brief, the gravitational centre of the detected luminal borders (manual segmentation) was determined and used to place the OCT images (distance between frames: 0.125 mm) onto the luminal 3-D centreline derived from end-diastolic biplane angiographic data. The rotational orientation of the detected borders onto the lumen centreline was estimated using 3-D geometrical algorithms and anatomical landmarks seen both in FD-OCT and angiography. The total length of the FD-OCT-based 3-D reconstruction was 59.6 mm. Three-dimensional reconstruction based on end-diastolic IVUS and biplane angiographic data was also performed3.
BLOOD FLOW SIMULATION
The geometries obtained were further processed with computational fluid dynamics techniques for the generation of a finite volume mesh. Anisotropic meshes with unstructured tetrahedral elements were generated for each baseline surface using an automated mesh generation programme (ICEM CFD; Ansys Inc., Canonsburg, PA, USA). To capture the detailed characteristics of the haemodynamic micro-environment, mesh density was increased around the stent struts and within the boundary layer of the flow field, and had a maximum element edge equal to approximately one quarter of the BVS strut thickness (i.e., ≈40 μm). The FD-OCT-derived 3-D model was meshed with ≈3,000,000 tetrahedrons. Blood flow simulation was performed by solving the 3-D Navier-Stokes equations (CFX 11; Ansys). Blood was considered as a homogeneous, Newtonian fluid with a dynamic viscosity of 0.0035 Pa·s and a density of 1,050 kg/m3. Blood flow was considered to be steady, laminar and incompressible, and a flat velocity profile was imposed at the inlet of the entire reconstructed arterial segment. Coronary blood flow for the artery was estimated by measuring in two angiographic projections, obtained at baseline post scaffold implantation, the number of frames required for the contrast agent to pass from the inlet to the outlet of the reconstructed segment, the volume of the segment at baseline and the cine frame rate4,5. The arterial wall was considered to be rigid and no-slip conditions were applied at the baseline luminal surface, while zero pressure conditions were imposed at the outlet. Shear stress (SS) at the baseline luminal surface was calculated as the product of blood viscosity and the gradient of blood velocity at the wall.
CALCULATION OF NEOINTIMA THICKNESS IN 3-D SPACE
Neointima thickness was calculated as the distance (along the line passing through the luminal centre of mass) between the 3-D luminal surface at baseline (post-implantation) and the 3-D luminal surface at follow-up using an in-house developed algorithm implemented in Visual Fortran (Compaq Computer Corporation, Houston, TX, USA)6. Positive values corresponded to areas of neointimal hyperplasia. For both the FD-OCT- and IVUS-derived models, neointima thickness was measured along the axial direction per 0.125 mm and around the vessel circumference per 5° for each cross-section and was associated to SS at the corresponding location.
DETAILED FIGURE LEGEND
Anatomically correct 3-D coronary artery reconstruction and assessment of the local haemodynamic milieu in a right coronary artery following implantation of the Absorb™ bioresorbable vascular scaffold (BVS).
A. Model at baseline (post-implantation) based on the fusion of FD-OCT and angiographic data with colour-coded map of the SS distribution on the BVS-treated surface and the native portion of the artery. A photo of the BVS revision 1.1 strut design (i.e., in-phase zigzag hoops linked by bridges; strut thickness: 156 μm) is also included.
B. Detailed view of the 3-D reconstructed surface based on the high-resolution FD-OCT images corresponds well to the BVS strut architecture and portrays the irregular lumen surface caused by strut protrusion which critically determines the local SS patterns with relatively higher values occurring on top of the struts and lower values in the inter-strut areas. An electron microscopy photo (top right) acquired from a rabbit iliac artery 14 days post-BVS implantation, and a 3-D volume-rendered image of the patient’s artery (bottom right) showing the strut structure are also included in this panel.
C. Three-dimensional flow streamlines around the strut micro-environment demonstrate flow disturbance with a large recirculation region distal to the strut (arrow) and a much smaller one proximal to the strut (dotted arrow) resulting in very low and low SS, respectively, as demonstrated by the colour-coded SS map superimposed on the lumen/strut border along a longitudinal (proximal to distal) section plane. Visible streamlines are derived from the entire 3-D lumen volume of the field of view at multiple levels along the third dimension, i.e., depth.
D, E and F. Corresponding FD-OCT cross-sectional images (evident by the side branch [br]) at baseline post-implantation (panel D) and six-month follow-up (F) show the struts and the neointima tissue in high detail owing to the superior resolution. The local circumferential SS distribution is included in panel E showing focal spots of low and relatively higher SS.
G. Coronary artery reconstruction at baseline (post-implantation) based on the fusion of intravascular ultrasound (IVUS) and angiography with colour-coded map demonstrating the SS distribution on the BVS-treated surface which appears to be smoother compared to the FD-OCT-based reconstructed artery. This was primarily due to the lower cross-sectional resolution (≈150 vs. ≈15 μm in FD-OCT) and, secondarily, the poorer axial sampling information (frame distance: ≈0.4 mm [end-diastolic images] vs. 0.125 mm [consecutive images] in FD-OCT) by IVUS imaging.
H, I and K. IVUS cross-sectional images at baseline (panel H) and six-month follow-up (panel K) corresponding to the FD-OCT images. The lower IVUS resolution (≈150 vs. ≈15 μm in FD-OCT) provides a rough assessment of BVS struts (asterisks) and neointima hyperplasia at follow-up. The circumferential baseline SS distribution in panel I shows a quite homogeneous pattern without local SS maxima and minima.
M and N. The relationship between baseline SS and neointima thickness at six months was found to be much stronger in the FD-OCT-based (r=0.57) versus the IVUS-based (r=0.14) reconstructed artery. This difference in the relationship between baseline SS and neointima thickness should be attributed not only to the different cross-sectional resolution of IVUS vs. FD-OCT, but also to the poorer axial sampling information in the IVUS-based reconstruction (frame distance: ≈0.4 mm vs. 0.125 mm in FD-OCT) that resulted in the interpolation of larger areas between the sequential end-diastolic IVUS frames when constructing the 3-D surface.