Abstract
Aims: Bioresorbable scaffold (BRS) regions exposed to flow recirculation, low time-averaged wall shear stress (TAWSS) and high oscillatory shear index (OSI) develop increased neointima tissue. We investigated haemodynamic features in four different BRSs.
Methods and results: Fantom (strut height [SH] = 125 µm), Fantom Encore (SH = 98 µm), Absorb (SH = 157 µm) and Magmaris (SH = 150 µm) BRSs were deployed in phantom tubes and imaged with microCT. Both 2D and 3D geometrical scaffold models were reconstructed. Computational fluid dynamics (CFD) simulation was performed to compute TAWSS and OSI. Thicker struts had larger recirculation zones and lower TAWSS in 2D. Absorb had the largest recirculation zone and the lowest TAWSS (240 µm and −0.18 Pa), followed by Magmaris (170 µm and −0.15 Pa), Fantom (140 µm and −0.14 Pa) and Fantom Encore (100 µm and −0.13 Pa). Besides strut size, stent design played a dominant role in 3D. The highest percentage area adverse TAWSS (<0.5 Pa) and OSI (>0.2) were found for Fantom (56% and 30%) and Absorb (53% and 33%), followed by Fantom Encore (30% and 25%) and Magmaris (25% and 20%). Magmaris had the smallest areas due to a small footprint and rounded struts.
Conclusions: Due to stent design, both Fantom Encore and Magmaris showed smaller TAWSS and OSI than Fantom and Absorb. This study quantifies which scaffold features are most important to reduce long-term restenosis.
Introduction
The efficacy of metallic stents and bioresorbable scaffolds (BRS) to treat coronary artery stenosis is related to the haemodynamic environment1. The struts of these devices disturb the local flow field and induce regions with low and oscillating wall shear stress2,3,4,5. These flow disturbances are related to various pathological processes. Low wall shear stress is associated with increased neointimal growth4,6,7,8,9, delayed re-endothelialisation1,10 and an increased risk of stent thrombosis1,5,11.
The magnitude of blood flow disruption is influenced by scaffold design. It was shown that strut height and shape influence the size of flow recirculation zones12,13. Furthermore, larger strut spacing restores the blood flow profile between struts12,13. Alignment of the general stent layout to blood flow also determines the region exposed to low and oscillating wall shear stress13,14.
BRS are designed to dissolve over time, which has the potential benefit of restoring vasomotion, leaving the option open for future bypass surgery with graft anastomoses at the scaffolded segments, and reducing late stent-related adverse events15,16. Typically, a BRS consists of bioresorbable polymers or metals that are inherently weaker than conventional non-resorbable metallic stents. Therefore, more material is needed to provide adequate support to the artery. As a result, BRS have relatively thick struts with more pronounced haemodynamic impact as compared to current-generation thin-strut metallic drug-eluting stents (DES)17.
In this context, the aim of this work is to compare the impact of four different BRS designs on local haemodynamics using computational fluid dynamics (CFD). Three devices are characterised by a rectangular strut profile, namely the Fantom® sirolimus-eluting bioresorbable scaffold (REVA Medical, San Diego, CA, USA), the Fantom® Encore Tyrocore™ bioresorbable scaffold (REVA Medical) and the Absorb™ GT1 everolimus-eluting bioresorbable vascular scaffold (Abbott Vascular, Santa Clara, CA, USA). One device is characterised by more rounded strut edges, namely the Magmaris® resorbable magnesium scaffold (Biotronik, Berlin, Germany).
Methods
To investigate the effect of the individual scaffold designs, we used two different approaches. Firstly, a two-dimensional (2D) analysis was performed to elucidate the effect of strut height and shape. Secondly, a three-dimensional (3D) analysis was carried out to investigate the combined effects of strut height, strut shape and scaffold layout.
SCAFFOLD RECONSTRUCTION
The main characteristics of the four studied scaffolds are presented in Table 1. We compared the Fantom with a strut thickness of 125 µm, Fantom Encore with a strut thickness of 98 µm, Absorb with a strut thickness of 157 µm and the Magmaris with a strut thickness of 150 µm.
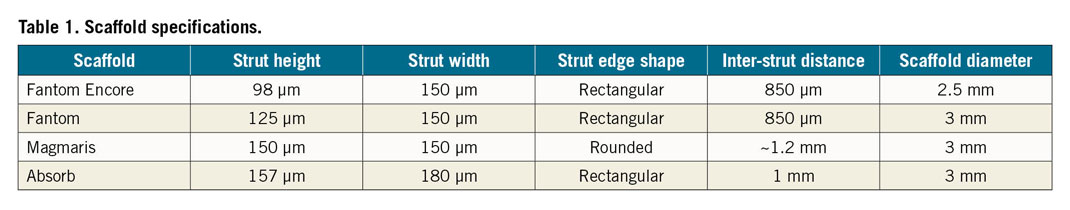
Firstly, the scaffold struts were reconstructed in 2D (Figure 1A). The strut height, width and shape were based on data provided by the manufacturer. The inter-strut distance was repeatedly measured, and the average inter-strut distance was determined for each scaffold. The distance between struts for all 2D models was the average inter-strut distance of all real scaffolds, namely 975 µm. The complete 2D geometry consisted of five consecutive struts placed on the top and bottom of a flat cylinder. In addition, in order to study the effects of changes in strut height, strut width and inter-strut distance, we created hypothetical 2D strut models with a 20% decrease in height, in width and in inter-strut distance. To study the effects of the rounded strut edges in Magmaris, a model with rectangular struts of the same size was made.
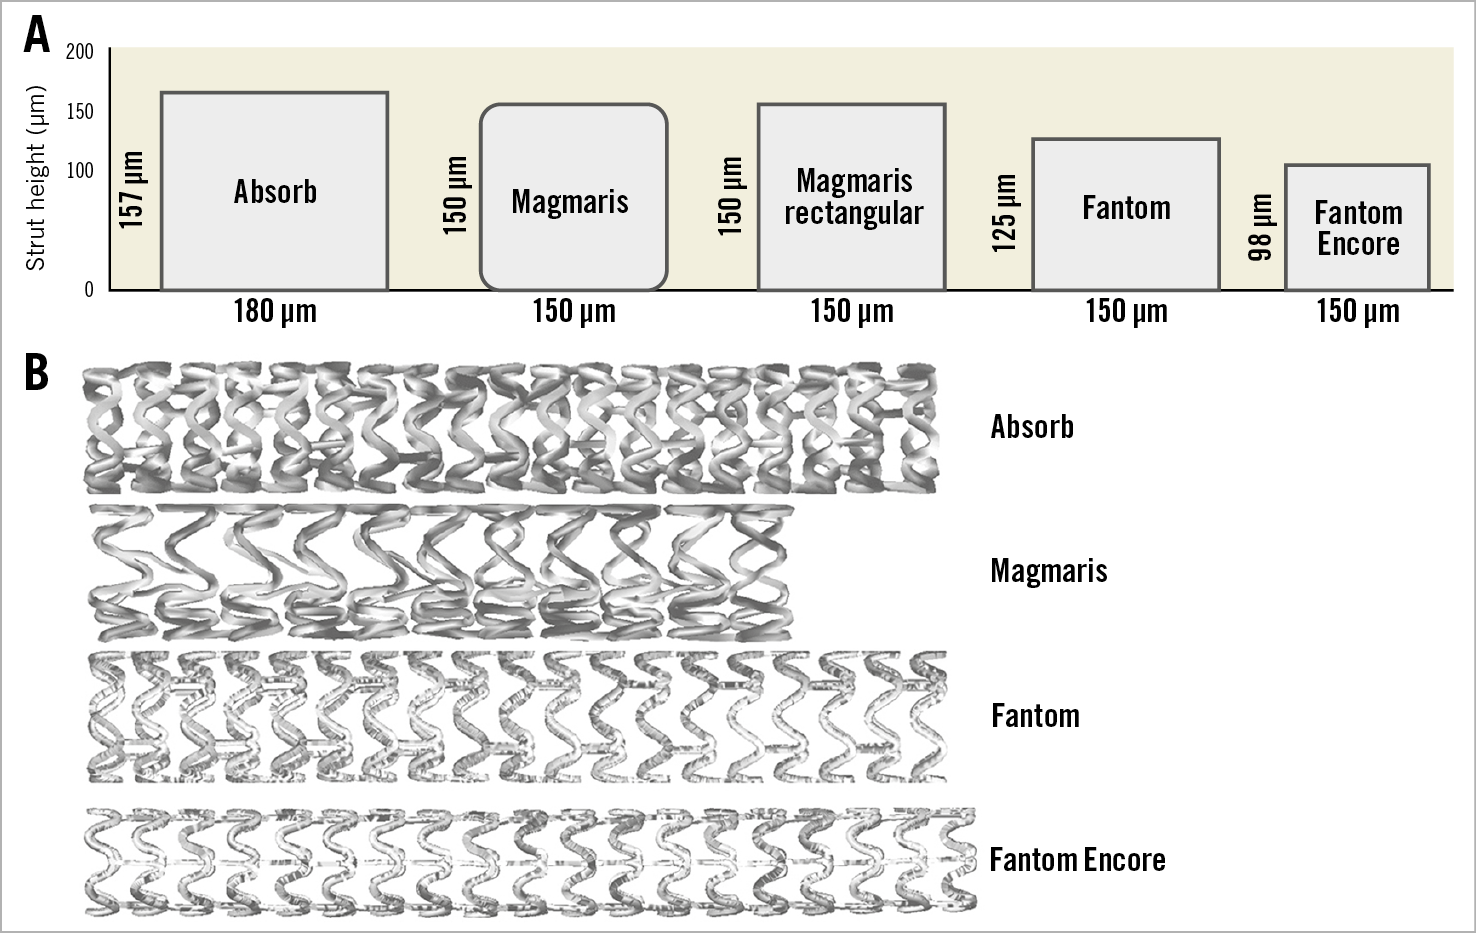
Figure 1. Scaffold geometry. A) Two-dimensional strut cross-sections. B) Three-dimensional reconstructed scaffolds.
Secondly, the scaffolds were reconstructed in 3D (Figure 1B). Each of the scaffolds was deployed inside a plastic phantom tube, according to the guidelines of the scaffold suppliers. After expansion, the in vitro models were imaged with microcomputed tomography (microCT) with an isotropic resolution of 20 µm (Quantum FX; PerkinElmer, Waltham, MA, USA). The centrelines of the scaffolds were extracted from the microCT data using Mimics (Materialise, Leuven, Belgium), resulting in the skeletonised scaffolds. Subsequently, the reconstructed 2D struts were placed over the 3D skeletons using a previously developed semi-automatic procedure in Rhinoceros, v.5 (Robert McNeel & Associates, Seattle, WA, USA)18. A surface was lofted over each of the 2D strut shapes resulting in the complete surface of the scaffolds18. Finally, the geometries of each of the scaffolds and the surrounding tubes were merged in ICEM CFD, v.17.1 (ANSYS Inc., Canonsburg, PA, USA).
GEOMETRY DISCRETISATION
After geometry reconstruction, the surfaces were discretised into elements in ICEM CFD, v.17.1. A mesh independence study was performed in order to optimise the computational efficiency without decreasing the solution accuracy. The resulting typical element sizes were 0.015 mm and 0.1 mm for the scaffolded region and the non-stented regions, respectively. The final discretised models were composed of around five million elements, which is comparable to previous studies19.
COMPUTATIONAL FLUID DYNAMICS
Transient CFD simulations were performed with a generic left anterior descending coronary artery inlet flow profile mimicking pulsatile physiological conditions20 and zero reference pressure at the outlet using Fluent, v.17.1 (ANSYS Inc.). The mean flow rate was scaled to a steady flow rate with maximum velocity of 0.15 m/s. In addition, the time-averaged wall shear stress (TAWSS) at the inlet was kept the same for all scaffolds by scaling the inflow accordingly. The vessel wall was considered rigid with no-slip condition. Blood inside the reconstructed stented geometrical model was assumed to be non-Newtonian, behaving according to the Carreau model21, with a mass density of 1,060 kg/m3. One and a half heart cycles were simulated, using 150 time steps. The first half of the simulated cardiac cycle was disregarded in order to eliminate start-up effects22. Both the inlets and outlets of the 3D geometries were extended by three times the diameter to make sure that the simulated flow was fully developed before entering the stented region and to reduce the effect of outflow boundary conditions23.
HAEMODYNAMIC QUANTITIES OF INTEREST
The TAWSS and oscillatory shear index (OSI) were derived from the computed time-dependent velocity field. The TAWSS is the mean wall shear stress over one heart cycle. TAWSS values lower than 0.5 Pa have been associated with increased neointimal formation24. Therefore, adverse TAWSS was defined as <0.5 Pa. In addition, the OSI was extracted from the performed simulations. If blood flow is recirculated, the wall shear stress also changes direction. OSI captures the amount of directional change of wall shear stress in one heart cycle. Ranging from 0 to 0.5, higher OSI values have been associated with increased neointimal formation25,26. In this paper, adverse OSI was defined as >0.2.
DATA ANALYSIS
The CFD results of the 3D phantom wall in scaffolded regions were post-processed in CFD-Post, v.17.1 (ANSYS Inc.) and analysed with MATLAB® R2018a (MathWorks, Natick, MA, USA). The vessel wall was divided into segments of four degrees in circumference and 50 microns in length. These segments were used for generating a 2D contour map of the TAWSS and OSI. Only the regions between struts were included. Histograms were made in order to analyse the distributions in terms of their skewness, kurtosis and standard deviation. The Kolmogorov-Smirnov test was used to test the distributions for normality (p<0.001). The Kruskal-Wallis test was used to test similarity in the distributions of the scaffolds. The percentage lumen area with low TAWSS and high OSI was determined in scaffolded regions for all scaffolds.
Results
2D SIMULATIONS
Figure 2 illustrates the blood flow patterns in 2D simulations. The velocity streamlines and vectors between two adjacent struts are displayed for each scaffold. The velocity vectors distal from the struts point in the opposite direction to the blood flow, indicating the presence of a distal recirculation zone. After the distal recirculation zone, the streamlines run parallel to the wall again, which indicates the restoration of blood flow. This zone is labelled as the recovery zone. Proximal to the next strut, another recirculation of blood flow can be observed, which is defined as the proximal recirculation zone. The proximal recirculation zone is smaller than the distal recirculation zone. The sizes of the distal recirculation zone and proximal recirculation zone increase with increasing strut height, whilst the size of the recovery zone decreases with strut height.
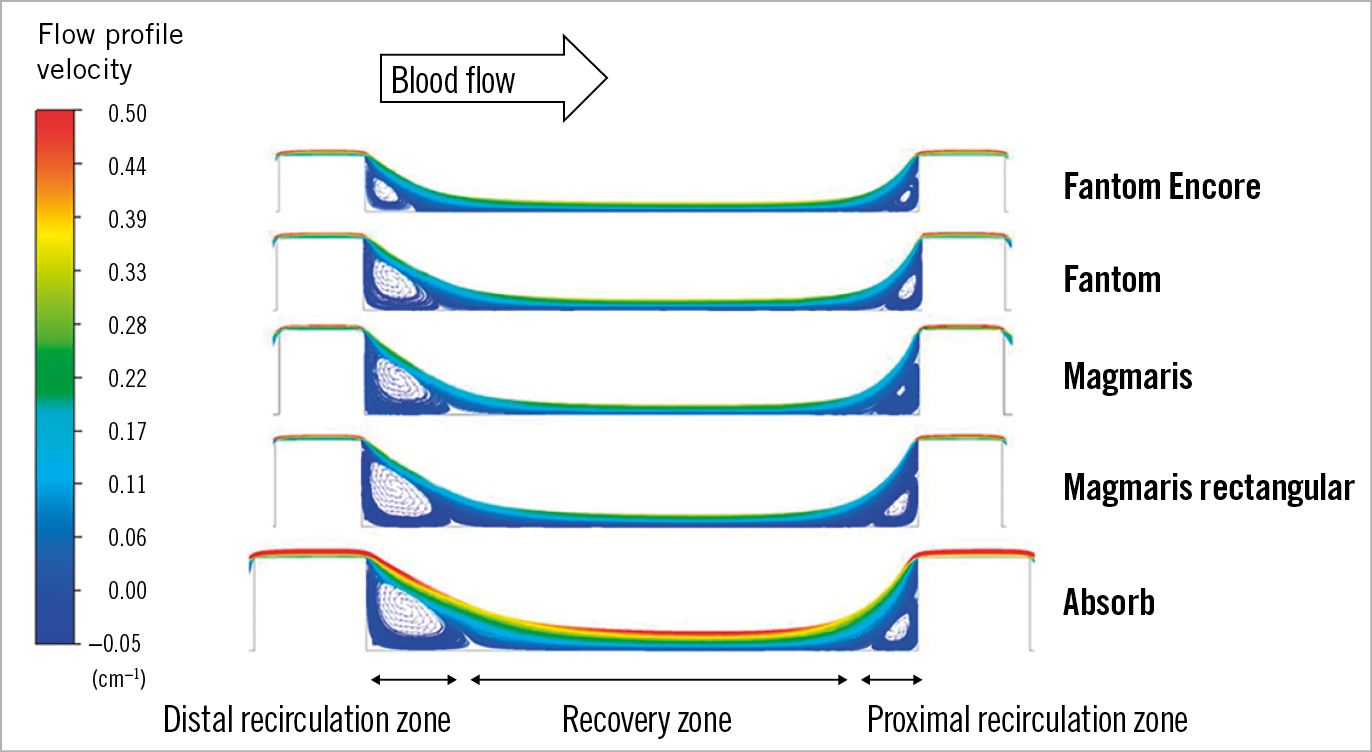
Figure 2. Blood flow pattern between struts. Streamlines of blood flow between struts in a 2D simulation, with flow direction from left of the image. The recirculation zones distally and proximally to struts are denoted by recirculating vector arrows.
In Figure 3 the TAWSS between struts is shown. The distal and proximal recirculation zones have zero and negative TAWSS, whilst the recovery zone has positive TAWSS values. The Fantom Encore has a minimal TAWSS of −0.12 Pa in the distal recirculation zone, with a recirculation zone length of 0.10 mm, which is equal to 17% of the distance between struts. In the recovery zone, the TAWSS peaks at 0.45 Pa. The proximal recirculation zone is smaller than the distal recirculation zone (0.07 mm, 12%) with a higher minimal TAWSS value (−0.07 Pa). The sizes of the recirculation zones increase with increasing strut height, whilst the minimal, maximal TAWSS and size of the recovery zone decrease with strut height.
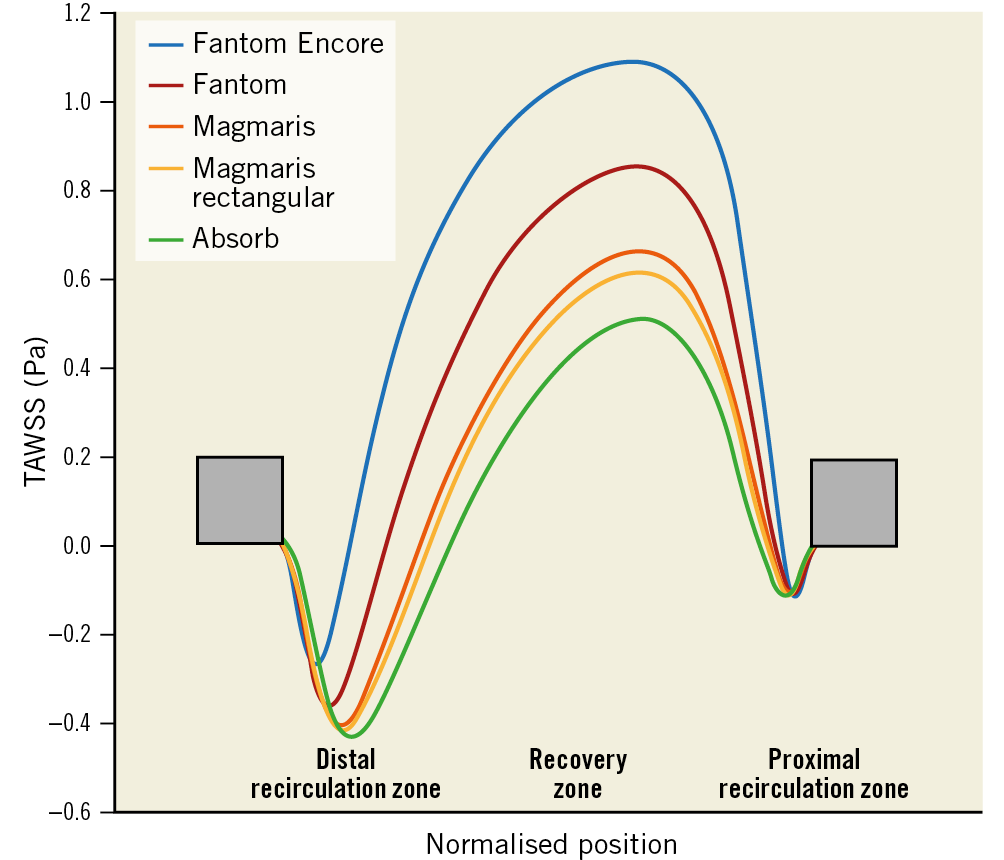
Figure 3. Longitudinal representation of TAWSS in-between two struts. Struts are denoted by the grey boxes. The x-axis is the normalised position of struts. The y-axis shows the directional TAWSS. The lines represent the TAWSS for each scaffold.
A positive trend between strut thickness and distal recirculation zone is shown in Figure 4. A negative trend is shown between peak TAWSS and strut thickness and between minimum TAWSS and strut thickness. Compared to rectangular strut edges, rounded strut edges show relatively smaller recirculation zones, higher peak TAWSS in the recovery zone and higher minimum TAWSS in the recirculation zones.
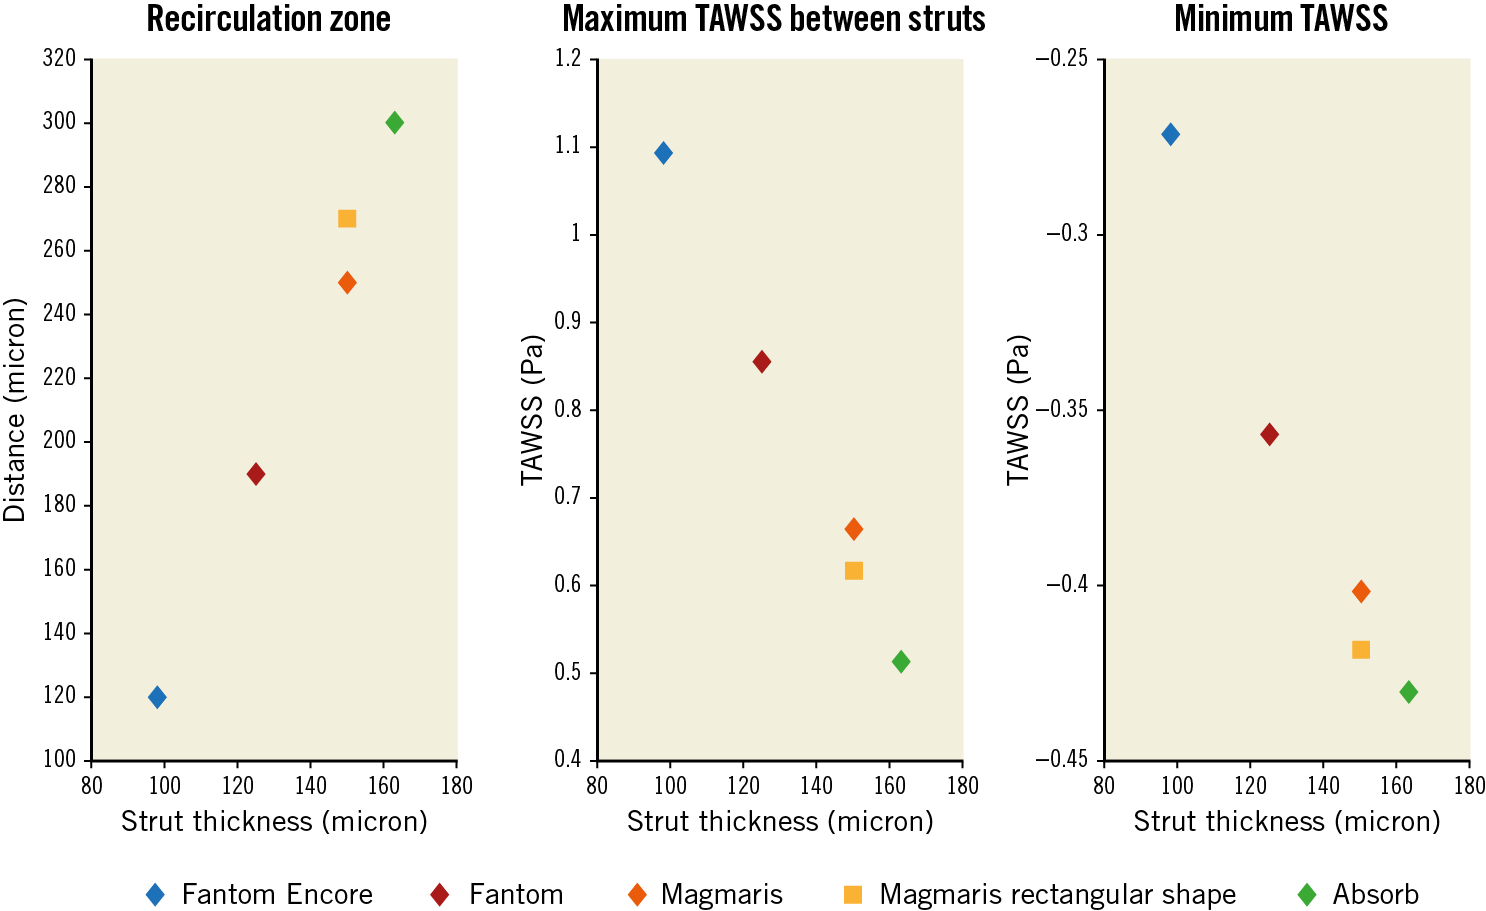
Figure 4. Analysis of strut thickness. The effects of strut thickness on the size of the recirculation zones proximal and distal to struts, the minimum TAWSS in the recirculation zones and the maximum TAWSS in the recovery zone.
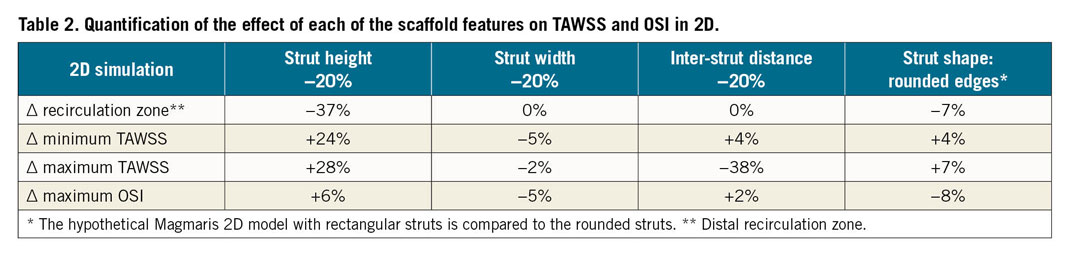
In Table 2 the effects of changes of the scaffold features are quantified in 2D simulations. Strut thickness changes the size of the distal recirculation zone, the minimum and maximum TAWSS values the most. Inter-strut distance does not change the minimum TAWSS and the recirculation zone as much; however, it has a larger effect on the maximum TAWSS value compared to strut thickness. Rounding the strut edges has a smaller effect, while strut width does not affect any of the analysed quantities considerably. The maximum OSI values seem not to be considerably affected by any factor.
3D SIMULATIONS
Figure 5A and Figure 5B show the distribution of the TAWSS and OSI for each scaffold in 3D, in which the effect of different scaffold design on TAWSS and OSI is demonstrated. Low TAWSS and high OSI are visible near the struts. Elevated TAWSS and lower OSI values are visible between struts, near the cell centre. This is further illustrated in the unwrapped TAWSS distribution of the Fantom Encore in Figure 5C. The recirculation zones and recovery zones are visible near struts, comparable to the features observed in 2D. In addition, the zoomed single cell highlights the variations of TAWSS within a cell, presenting the combined effect of the scaffold layout and deployment.
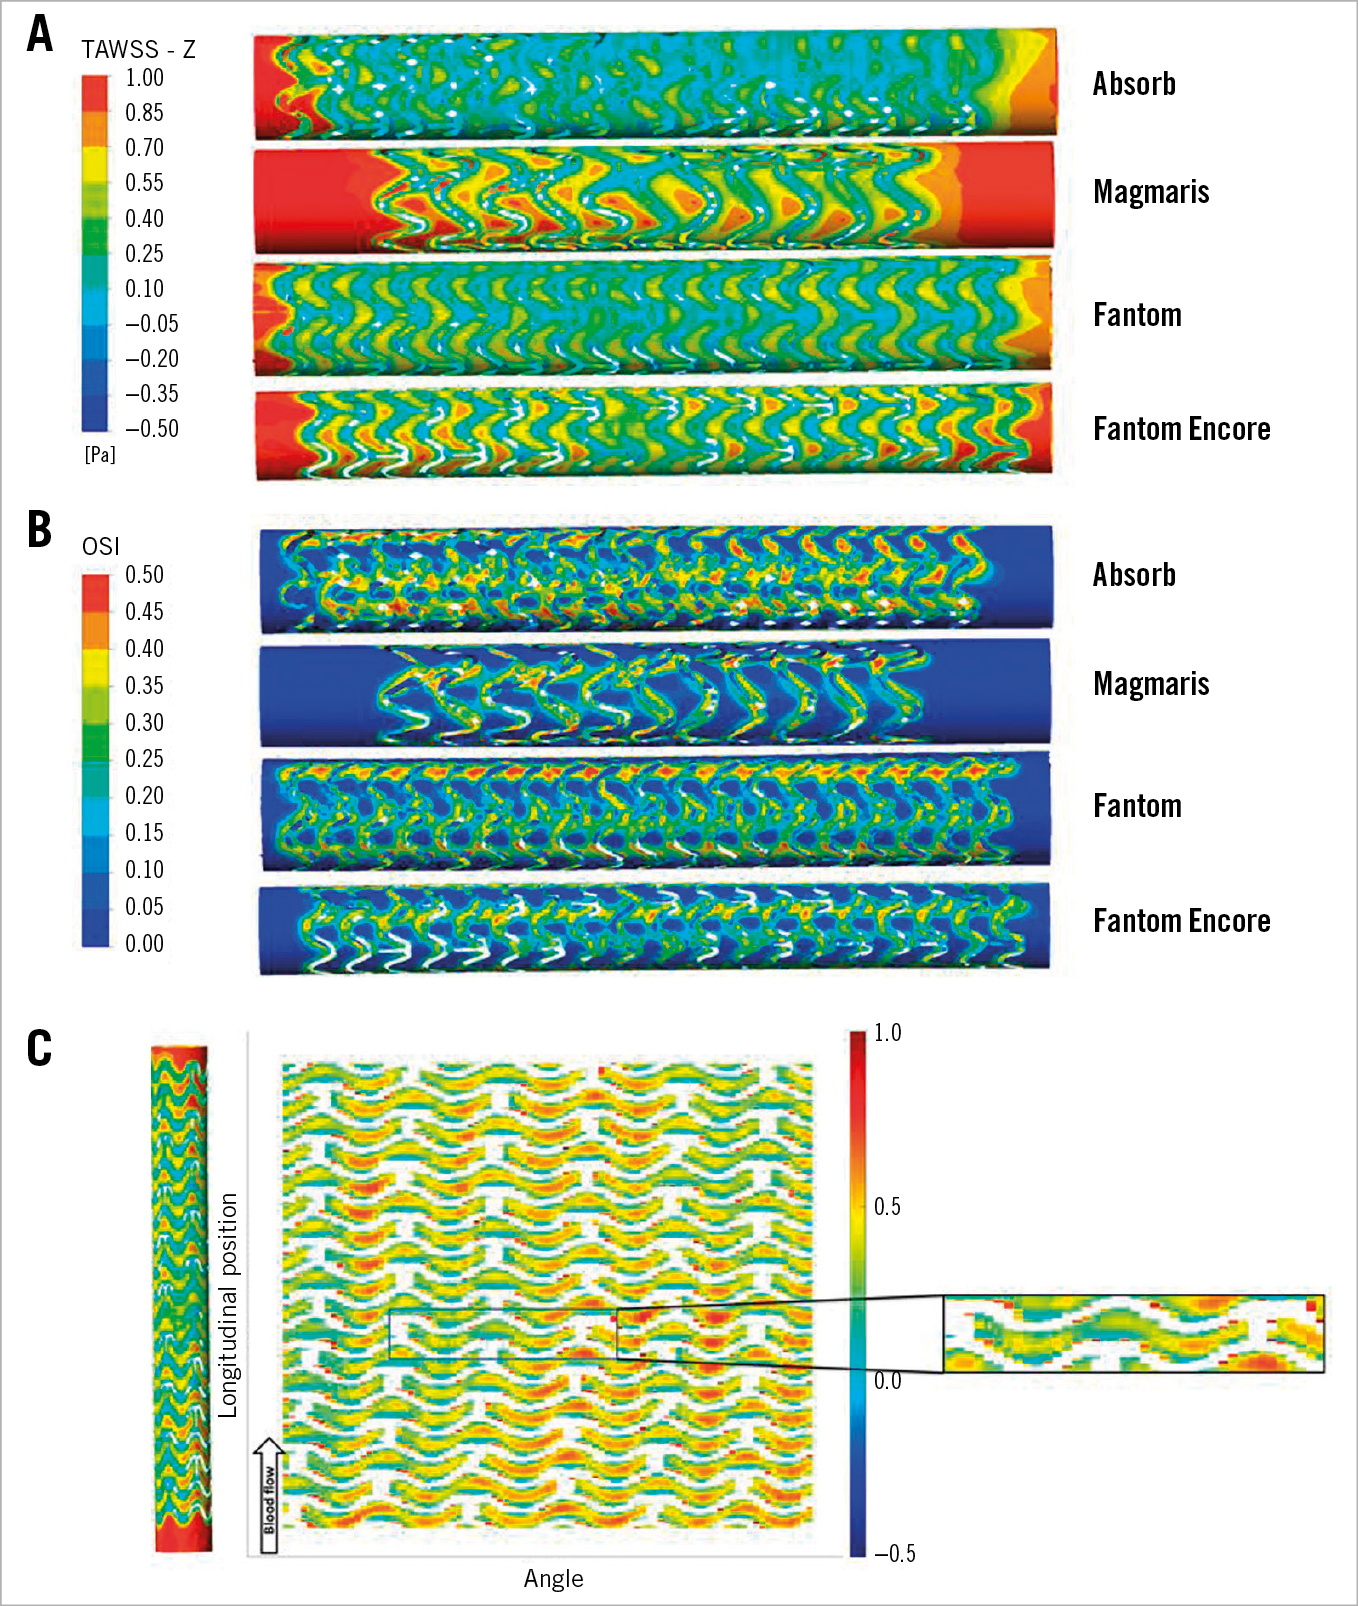
Figure 5. TAWSS and OSI distribution of the different scaffolds. A) TAWSS. B) OSI. C) Unwrapped TAWSS distribution map of the Fantom Encore. The scaffold is coloured white. The deployment effects are highlighted in the zoomed cut.
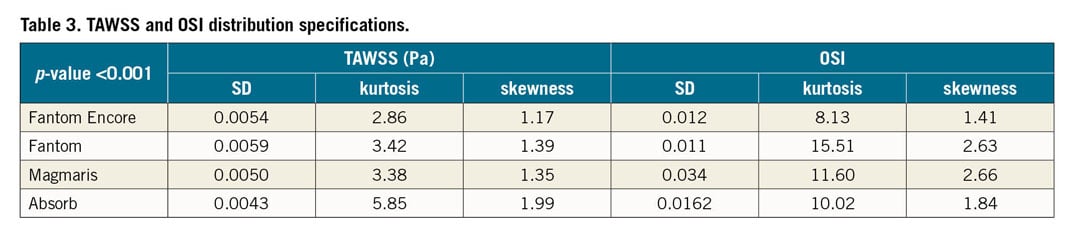
Figure 6 shows the distribution of TAWSS and OSI per scaffold. The percentage area with low TAWSS (<0.5 Pa) and high OSI (>0.2) is also denoted. Both TAWSS and OSI distributions of the scaffolds were significantly different (p<0.001) (Table 3). The percentage area with low TAWSS for the Fantom is 56%; for the Fantom Encore it is approximately half of the percentage area. The Absorb has a slightly smaller amount of low TAWSS (53%) and the Magmaris has the least amount of low TAWSS (26%). The percentage area with high OSI for the Fantom is 31%, whilst for the Fantom Encore it is 24%. The Absorb has the highest amount of high OSI (33%), whilst the Magmaris has the least amount of high OSI (20%).
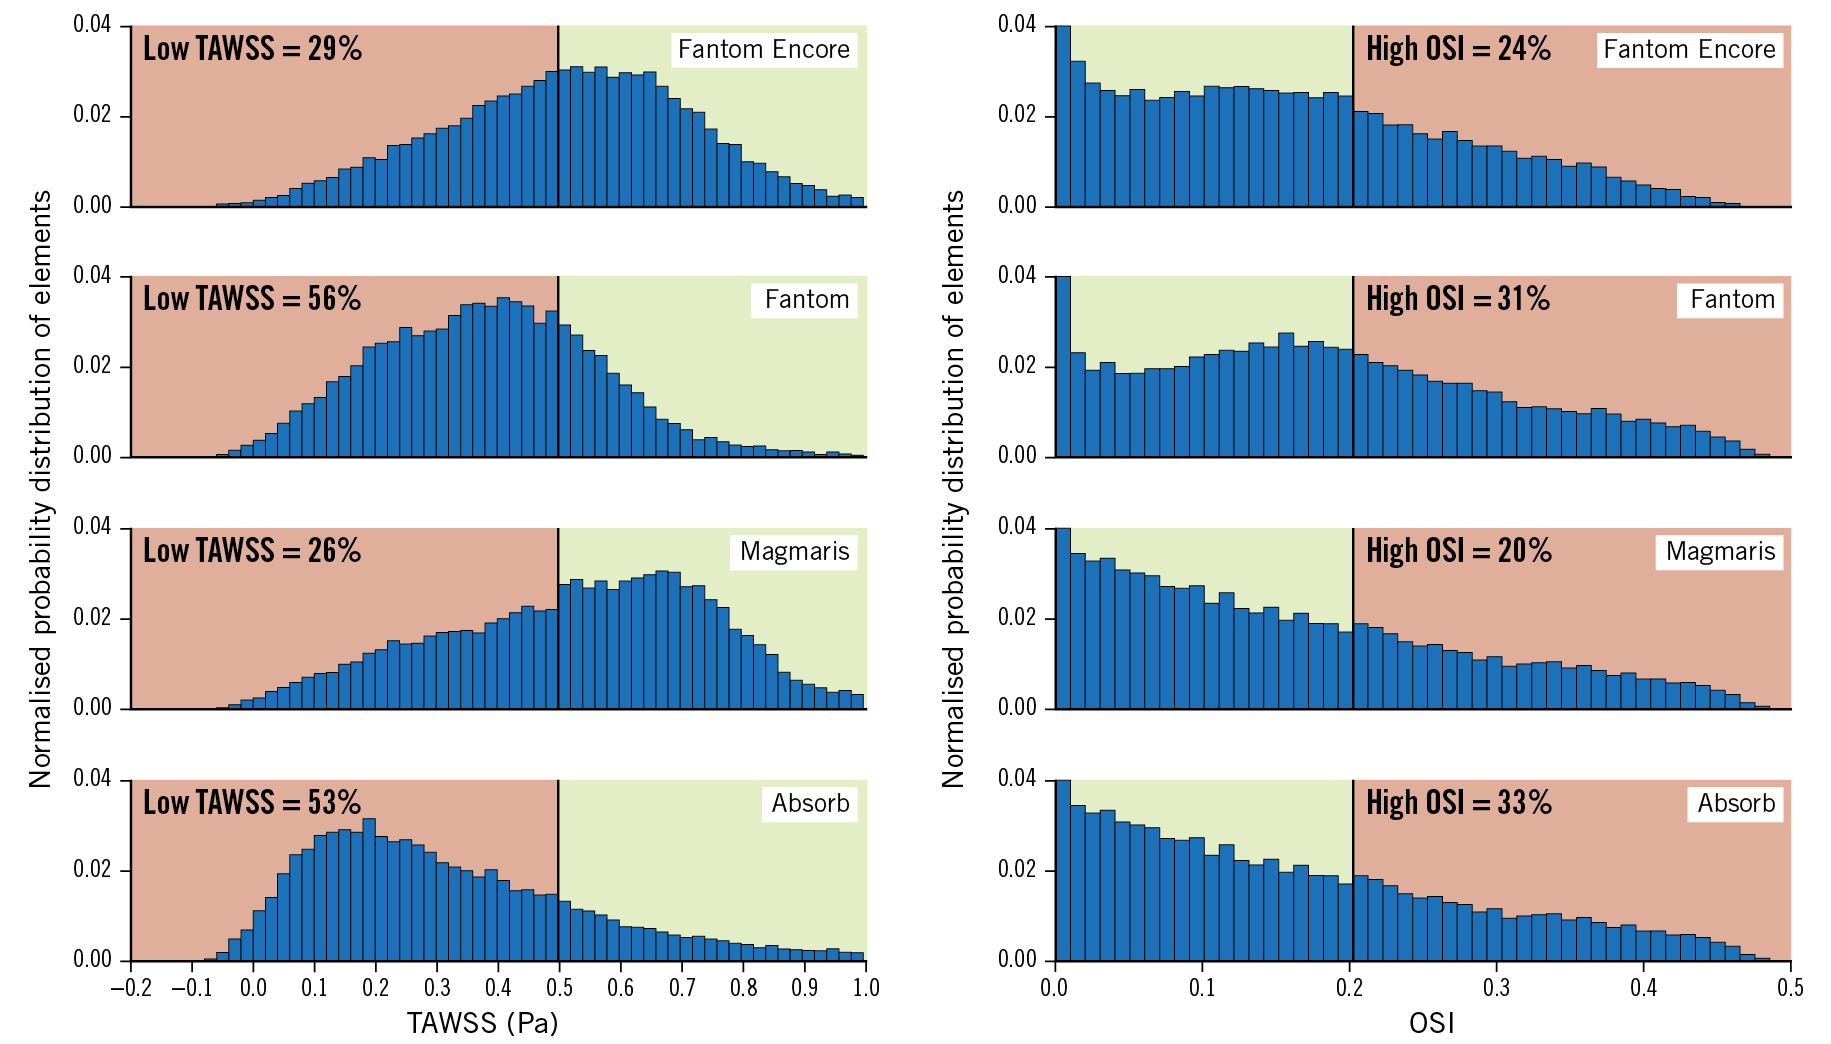
Figure 6. Histograms of the TAWSS and OSI distribution of the scaffolds. The percentage area with low TAWSS (>0.5 Pa) and high OSI (>0.2) is coloured red and high TAWSS and low OSI is coloured green.
Discussion
In this study, the haemodynamic behaviour of four BRS was investigated by means of computational techniques. The effects of scaffold design, layout and strut size on TAWSS and OSI were analysed. These metrics provide a tool for assessing the midterm to long-term safety and efficacy of scaffolds. In 2D, the strut height proved to be the main determinant of the computed flow features. In 3D, both strut design and the overall scaffold layout influenced the distribution of TAWSS and OSI.
First, the scaffolds were compared in a 2D simulation, in which the impact of strut height, width, shape and the inter-strut distance on the distal recirculation zone, and the minimum and maximum TAWSS values was illustrated. The quantitative analysis showed that strut height is nearly linearly related to the haemodynamic quantities analysed for struts with a rectangular shape, confirming previous studies12,27. Rounding of strut edges in the case of the Magmaris reduces the size of recirculation zones by 7%, and the minimum TAWSS by 7%, and increases the peak TAWSS by 4%, which illustrates the positive effect of rounding of the strut shape on the haemodynamic microenvironment, which corroborates previous findings17. Interestingly, a decrease in inter-strut distance does not seem to have a major effect on the recirculation zone size and minimum TAWSS; however, the maximum TAWSS value in the recovery zone is considerably reduced. In essence, depending on the threshold of low TAWSS, there are fewer areas of normal TAWSS on the arterial wall. This illustrates the interplay between strut height and inter-strut distance. The OSI values seem not to be considerably affected by any of the factors; the reason remains to be investigated.
Second, the scaffolds were compared to each other in 3D simulations. The flow features observed in 2D simulations were also present in 3D, including the distal recirculation zone, recovery zone and proximal recirculation zone. However, the effect of strut height was not as dominant. In the 2D simulations, the decrease of strut height from the Fantom (125 µm) to the Fantom Encore (98 µm) is 27 µm (22%), which caused the recirculation zones to decrease by 37%. Going from the Fantom to the Fantom Encore in 3D led to a 17% reduction of low TAWSS area, which is less of a reduction compared to the 2D case (17% vs 37%, respectively). Scaffolds contain connectors and v-shaped rings, which cannot be modelled in 2D. These rings and connectors add to the disturbance of the 3D flow profiles, causing the reduction of low TAWSS area to be less in 3D.
In addition, the cell layout in 3D considerably influences the sizes of recovery zones14. An open-cell design results in larger recovery zones, and thus smaller areas with low TAWSS and high OSI22. This explains the comparable areas of low TAWSS and high OSI of the Fantom and the Absorb, despite the Absorb having thicker struts. The Magmaris also has thicker struts than the Fantom; however, the areas of low TAWSS and high OSI were considerably smaller. In fact, the Magmaris had the least amount of adverse TAWSS and OSI due to both the rounded strut edges and the scaffold design. As previous studies have shown, smaller areas of low TAWSS values at baseline after scaffold implantation have been associated with an increase in lumen area in the long term28. Therefore, one of the selection criteria of scaffolds should be the haemodynamic performance at baseline. Thin struts are often considered to be the main predictor of good haemodynamic performance; however, the results of this study show that open-cell scaffolds might be just as effective in reducing regions with low TAWSS and high OSI. The role of designers is to find a balance between the minimum strut height needed for sufficient radial force and the maximum strut height for minimal low TAWSS and high OSI areas.
Limitations
The 3D models were based on the geometry obtained after deployment of BRS in straight plastic tubes. This has two important implications. Firstly, the 3D curvature of the coronary arteries was not included. The 3D curvature will induce secondary flows, and therefore asymmetrical velocity profiles will develop with higher velocities at the outer curve, and lower velocities at the inner curve29. However, since this effect depends on the shape of the artery and not on scaffold design, 3D curvature is expected to have a comparable effect for all scaffolds. Secondly, the plastic tube was not rigid but not as compliant as the vessel wall tissue. This prevents embedding of struts, a feature observed in coronary arteries30. This will influence strut protrusion, effectively changing strut height. This will affect the haemodynamic environment in vivo17. How and whether stent and strut design changes strut protrusion in vivo is also determined by the properties of the diseased vessel wall and remains to be investigated.
Conclusions
In this study, scaffolds with relatively thicker struts turned out to have smaller areas of low TAWSS. This was due to a larger inter-strut distance and due to rounding of the strut edges, presenting the added significance of both scaffold design features. Out of the four investigated BRS, the Magmaris and the Fantom Encore performed best in terms of local haemodynamics. This study shows the significance of strut shape and scaffold layout, suggesting that scaffolds with thicker struts can perform better than scaffolds with thinner struts if the shape and layout are chosen wisely.
|
Impact on daily practice This study shows the extent of the effect of each of the scaffold design features on low TAWSS and high OSI. Based on these results, an open scaffold design proved to be one of the major determinants of favourable blood flow profile and should be considered in both the selection of a scaffold as well as in the design of scaffolds. Choosing a scaffold that induces higher endothelial TAWSS and lower OSI at baseline after deployment increases lumen area in the long term. |
Funding
This project has received funding from the European Union’s Horizon 2020 research and innovation programme under grant agreement number 777119.
Conflict of interest statement
The authors have no conflicts of interest to declare.
Supplementary data
To read the full content of this article, please download the PDF.