Abstract
Aims: The aim of the study was to evaluate the effect of strut protrusion (SP) on wall shear stress (WSS) and neointimal growth (NG) one and five years after implantation of an Absorb bioresorbable vascular scaffold.
Methods and results: Eight patients were selected from a first-in-man study. Following three-dimensional (3D) reconstruction of coronaries, WSS was quantified using Newtonian steady-flow simulation in each cross-section at 5° subunits (sectors) of the circumferential luminal surface. At one year, neointimal thickness (NT) was measured by optical coherence tomography (OCT) and correlated to WSS and SP post procedure. Median SP was 112.9 (90.8, 133.1) µm post implantation. Post procedure, a logarithmic inverse relationship between SP and post-implantation WSS (r=–0.425, p<0.001; correlation coefficients in a range from –0.143 to –0.553) was observed, whereas a correlation between baseline logarithm-transformed WSS (log-WSS) and NT (r=–0.451, p<0.001; correlation coefficients ranged from –0.140 to –0.662) was documented at one year. Mixed-effects analysis between baseline log-WSS and NT at follow-up yielded a slope of 30 µm/ln Pascal (Pa) and a y-intercept of 98 µm. As a result of NG, median flow area decreased from 6.91 (6.53, 7.48) mm2 post implantation to 5.65 (5.47, 6.02) mm2 at one-year follow-up (p=0.01) and to 5.75±1.37 mm2 at five-year follow-up (p=0.024). However, the vessel surface exposed to low WSS (<1 Pa) decreased significantly post procedure (42%) to one year (35.9%) and five years (15.2%) (p-overall <0.0001).
Conclusions: SP disturbs laminar flow, creates regions of low WSS (<1.0 Pa) that are associated with NG and lumen area reduction. Low WSS post implantation reduced significantly at long-term follow-up. Thin struts with effective embedment would substantially reduce NG and accelerate homogenisation of WSS towards physiological values.
Introduction
Bioresorbable scaffolds (BRS) have ushered interventional cardiology into a new era of percutaneous treatment of coronary artery disease. BRS restores vasomotricity and vessel wall (VW) cyclic strain that are vital for VW metabolism1. Local haemodynamics (LH), quantified as wall shear stress (WSS), have fundamental interaction with the VW2. Scaffold coverage, strut thickness, protrusion and embedment have an influence on local WSS distribution3,4. Following scaffold implantation, disruption of laminar flow triggers a cascade of reactions that may result in acute/subacute thrombosis, chronic exuberant neointimal tissue (NTi) and neoatherosclerosis5.
Optical coherence tomography (OCT)-based computational fluid dynamic (CFD) models provide assessment of LH at a detailed level not attainable even with experimental techniques6. In the present study, we investigated the effect of strut protrusion/embedment on post-implantation WSS (post-WSS) distribution and NTi formation at one-year and five-year follow-up.
Method
STUDY DESIGN
The details of the ABSORB cohort-B study (A Clinical Evaluation of the Everolimus-Eluting Bioresorbable Vascular Scaffold System in the Treatment of Patients with De-Novo Native Coronary Artery Lesions; NCT00856856) and treatment procedure have been previously described7. Eight cases with serial OCT were selected based on good image quality, minimal foreshortening and relative lack of curvature of the target vessel in two angiograms and clear visualisation of struts by OCT without major artefacts due to rotation, elongation and repetition of endoluminal structures due to cardiac motion8.
OCT IMAGE ACQUISITION
Intracoronary imaging was performed post procedure, at one year and five years in treated coronaries using a frequency-domain (FD) OCT system (C7-XR™ OCT; St. Jude Medical, St. Paul, MN, USA) with a pullback speed of 20 mm/sec. The details of image acquisition are shown in Supplementary Appendix 1.
OCT DATA ANALYSIS
OCT data were analysed off-line, using QCU-CMS software (Medis medical imaging systems, Leiden, the Netherlands)7. The following data were acquired from OCT: endoluminal intra-scaffold flow area (FA), abluminal scaffold area, proximal and distal edge segment FA, percent (%) FA obstruction, neointima area and thickness7. The data acquired post implantation were used to investigate the relationship between post-implantation strut protrusion/embedment and post-WSS distribution. The data acquired at one-year follow-up were used to reconstruct two separate contours: firstly, the baseline luminal borders defined by splines connecting the adluminal sides of the struts (retrospective baseline model), and secondly the luminal contour at one-year follow-up (one-year follow-up model) delineating the inter-strut neointimal boundary as well as the covered struts (Figure 1).
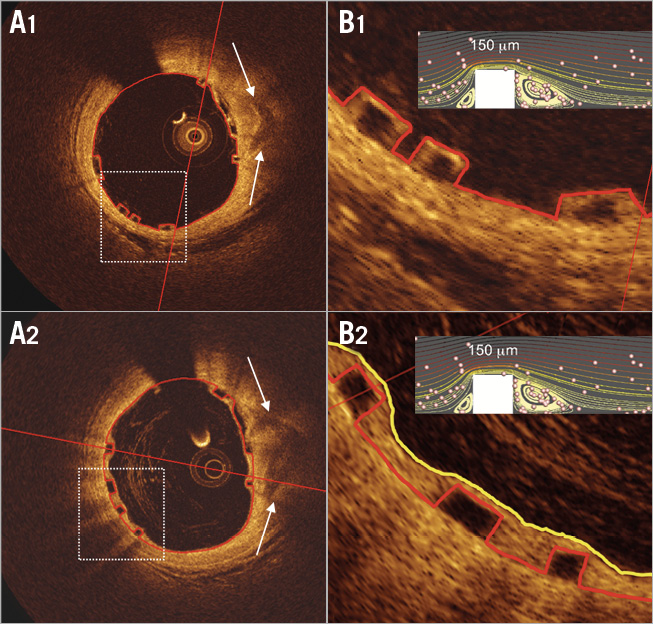
Figure 1. Neointimal tissue covers the polymeric struts at one year. In OCT the red contours superimposed on the lumen and strut boundaries in A1 and B1 are actual flow luminal contours post implantation, while in A2 and B2 the red contours still delineate the virtual and retrospective (one year later) flow luminal contours. For one-year retrospective analysis of virtual WSS post implantation, virtual post-procedure luminal borders in red were determined by the splines conjoining abluminal sides of the black core of the struts16. In B2, the yellow contour represents the actual flow luminal contour at one year once the struts have been covered by neointima. Inserted in B1 and B2 (right upper small panels) are CFD simulations that depict flow streamlines, cell tracking and flow reversals.
EMBEDMENT/PROTRUSION ANALYSIS BY OCT
The strut embedment and protrusion were measured with a semi-automated method (QCU-CMS, version 4.69) (Figure 2),9.
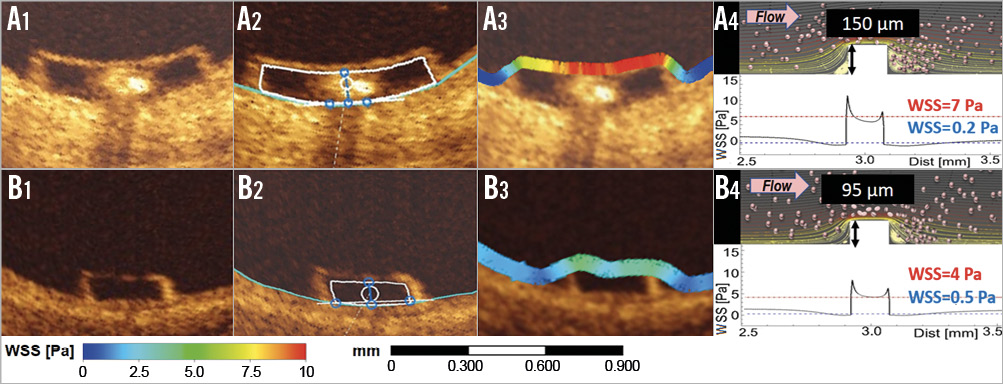
Figure 2. Strut thickness and strut protrusion post implantation determine the shear stress magnitudes on top of the strut and beside the struts. Panels A1 and B1 show two struts (Absorb and ArterioSorb™ [Arterius Ltd., Leeds, United Kingdom]) of different thickness (150 µm and 95 µm) and/or protrusion, with in A2 and B2 the interpolated luminal contour being located at the backside of the struts9. Panels A3 and B3 show colour-coded WSS overlying the strut, with high WSS in red on the top of the strut and low WSS in dark blue at the bottom of the strut. The thin strut (ArterioSorb) generates less of a WSS gradient between the top of the strut (indigo colour) and the bottom of the strut (light blue). CFD simulations shown in panels A4 and B4 depict streamlines, cell tracking indicating regions of flow reversal and WSS gradient (expressed in Pascals [Pa]) between the top (WSS value in red) and the bottom (WSS value in blue) of the strut4.
CORONARY ARTERY RECONSTRUCTION
For the CFD study, three-dimensional (3D) reconstruction of the coronary artery was performed using a published methodology10. The details of 3D reconstruction are explained in Supplementary Appendix 2.
COMPUTATIONAL FLUID DYNAMIC STUDY
WSS was estimated by solving 3D Navier-Stokes equations (ANSYS CFX, Version 18.0; ANSYS, Inc., Canonsburg, PA, USA). WSS was measured in native and scaffolded segments in cross-sections along the axial direction per 200 µm interval and in circumferential per 5-degree subunits (sectors) in each cross-section, using an in-house algorithm (Figure 3). The details of the CFD study are explained in Supplementary Appendix 3.
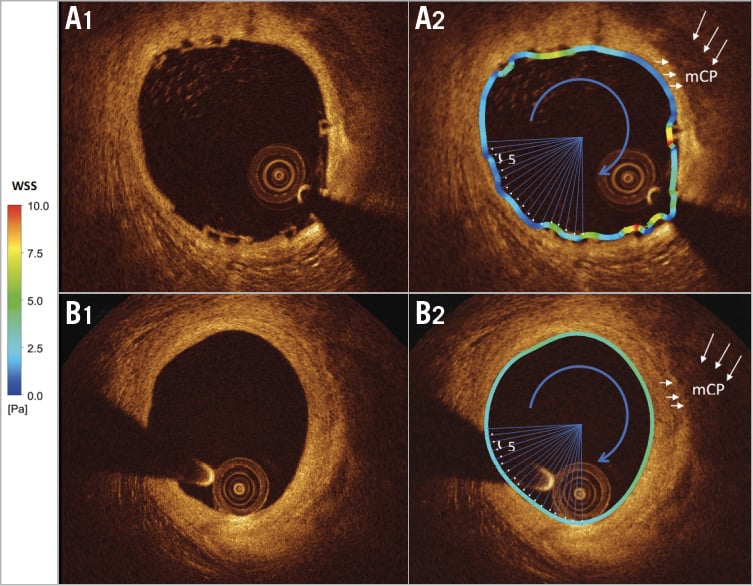
Figure 3. Homogenisation of the shear stress distribution at five-year follow-up. Post-WSS is quantified circumferentially in 5º subunits (sectors) (A1, A2) and at five years (B1, B2) over the luminal perimeter (see coloured barcode for WSS values). Each 5º subunit has one WSS value. Post implantation high WSS is usually observed on top of the strut and low WSS between the struts. At five years, WSS is homogeneously within physiological values (see barcode 2.5-5 Pa in green) (mCP: mixed calcified plaque).
STATISTICAL ANALYSIS
Data are expressed as mean±standard deviation or median and interquartile range. Pearson correlation coefficient and logarithmic regression analyses were implemented to investigate the association between baseline WSS, post-implantation protrusion and the neointimal thickness (NT) at follow-up. For WSS comparison between post implantation, one year and five years, a mixed-effects model was built on % increase of WSS from post implantation to one year and five years. All analyses were performed using statistical analysis programme SPSS, Version 23 (IBM Corp., Armonk, NY, USA), R V.3.2.3 and R package lme5 (R Foundation for Statistical Computing, Vienna, Austria)11.
Results
PATIENT CHARACTERISTICS
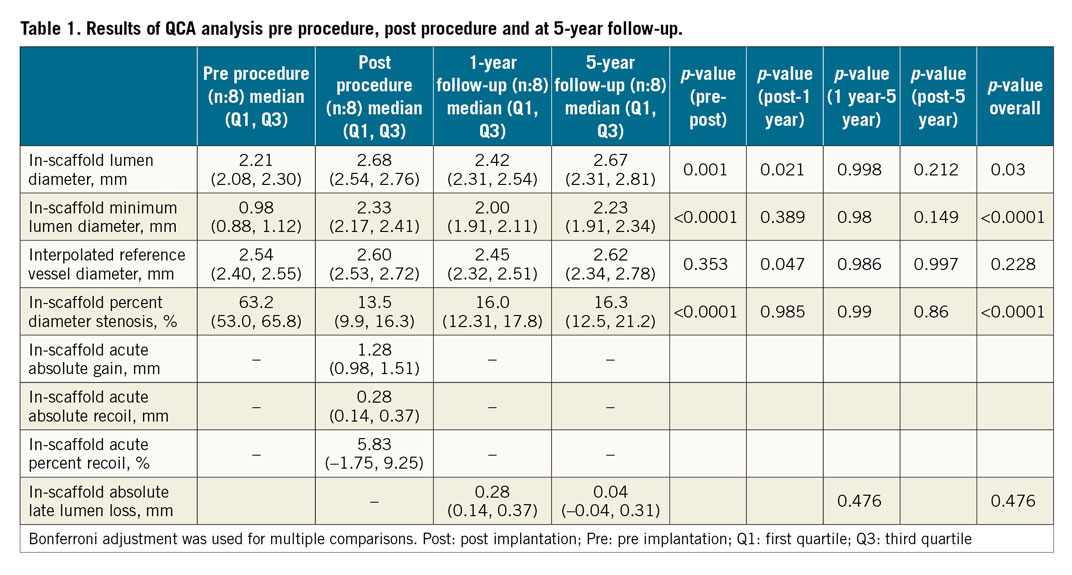
In all cases (n=8), scaffolded segments were relatively straight and had a luminal centreline with <20 degree angulation12. Five left anterior descending, two left circumflex and one right coronary artery were treated with an Absorb. All scaffolds had a diameter of 3.0 mm and a length of 18 mm. The expected scaffold diameter for the range of deployment pressures was 3.24±0.11 mm. Patient characteristics are shown in Supplementary Table 1. Procedural characteristics are shown in Supplementary Table 2. Pre-implantation, post-implantation, one-year and five-year quantitative coronary angiography (QCA) data are shown in Table 1.
OCT ANALYSIS RESULTS
OCT results are summarised in Table 2. The analyses were performed at device level (n=8). In-scaffold FA decreased from 6.91 (6.53, 7.48) mm2 to 5.65 (5.47, 6.02) mm2 at one year (p=0.01) and to 5.70 (5.10, 6.59) mm2 at five years (p=0.024). At one year, neointimal proliferation (neointimal area: 1.4 [1.20, 2.01] mm2, NT: 0.12 [0.06, 0.19] mm) was noticed in treated segments and resulted in an increase of % FA stenosis from 4.47% (–6.71, 13.25) post implantation to 17.1% (12.4, 24.3) at one year and 15.5% (11.7, 26.3) at five years.
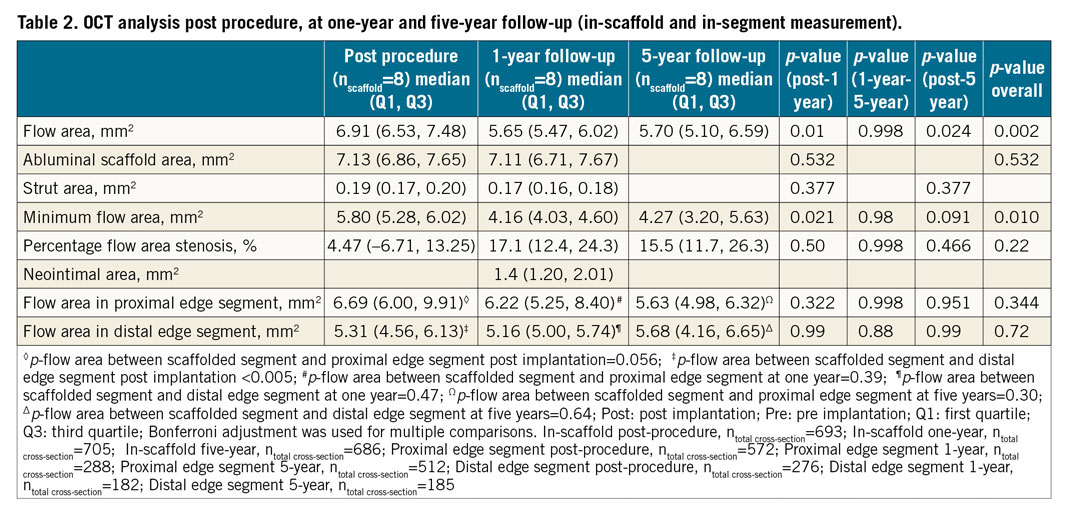
At five years, the regional differences in FA post implantation between non-scaffolded proximal/distal-edge and scaffolded segments disappeared (Table 2).
EMBEDMENT/PROTRUSION ANALYSIS RESULTS
The analyses were performed at cross-section and strut levels. All struts were well apposed to the VW. There were 5,038 struts analysed for embedment/protrusion in 556 OCT cross-sections. At strut level, strut embedment was 54.2 (34.2, 77.4) µm while the protrusion was 112.9 (90.9, 133.1) µm. At cross-section level, strut embedment was 57.8 (45.5, 71.1) µm while the protrusion was 109.3 (96.4, 121.6) µm. Deployment/post-dilatation balloon pressures were found to have a slight effect on embedment depths (r=0.14, p=0.049).
WSS ANALYSIS POST IMPLANTATION AND AT FOLLOW-UP
Each CFD cross-section was divided into four quadrants and in each quadrant WSS was calculated at post-implantation baseline model, at retrospective baseline model, one-year model and five-year model. Due to skewed WSS data, logarithmic transformation was implemented. Post-implantation median WSS was compared with the virtual WSS in the retrospective baseline model. The actual and virtual WSS peri-struts were compared at cross-section level (n=630) using a Bland-Altman approach and by linear regression analysis (r=0.827) (Supplementary Figure 1A, Supplementary Figure 1B). In mixed-effects analysis, WSS based on post-implantation CFD models (real post-implantation model) was comparable to WSS in retrospective baseline CFD models derived from one-year OCT data (p=0.86).
Post-implantation in-scaffold median WSS was 1.19 (0.84, 1.69) Pa, whereas median WSS in proximal and distal non-scaffolded edges was 1.82 (0.95, 3.10) Pa and 1.90 (1.03, 5.62) Pa, respectively (p-for difference between proximal non-scaffolded edge and scaffolded segment WSS=0.013, p-for difference in WSS between scaffolded and distal non-scaffolded edge<0.0001). Figure 4 shows logarithmic inverse relationships between SP and post-WSS (r=–0.425, p<0.001; correlation coefficients ranged from –0.143 to –0.553).

Figure 4. Inverse relationship between WSS and strut protrusion post implantation. A) Significant logarithmic inverse relationship between WSS (Pa) and SP (µm) at strut-level analysis for each cross-section of one device. B) The arrow identifies the single relationship exhibited in panel A among all the other logarithmic inverse relationships.
At one year, in-scaffold median WSS was 1.26 (0.98, 1.60) Pa, whereas median WSS in the proximal non-scaffolded edge segment was 1.17 (0.67, 2.01) Pa and 1.81 (0.80, 3.44) Pa in the distal non-scaffolded edge segment. The median NT was 0.12 (0.06, 0.19) mm (area of neointima: 1.4 [1.20, 2.01] mm2). A statistically significant inverse correlation was noted between retrospective baseline log-WSS and NT at one year for all devices (r=–0.451, p<0.005; correlation coefficients ranged from –0.140 to –0.662) (Figure 5). Overall, mixed linear regression analysis between retrospective baseline log-WSS and NT at follow-up yielded a slope of 30 µm/ln (Pa) and a y-intercept of 98 µm.
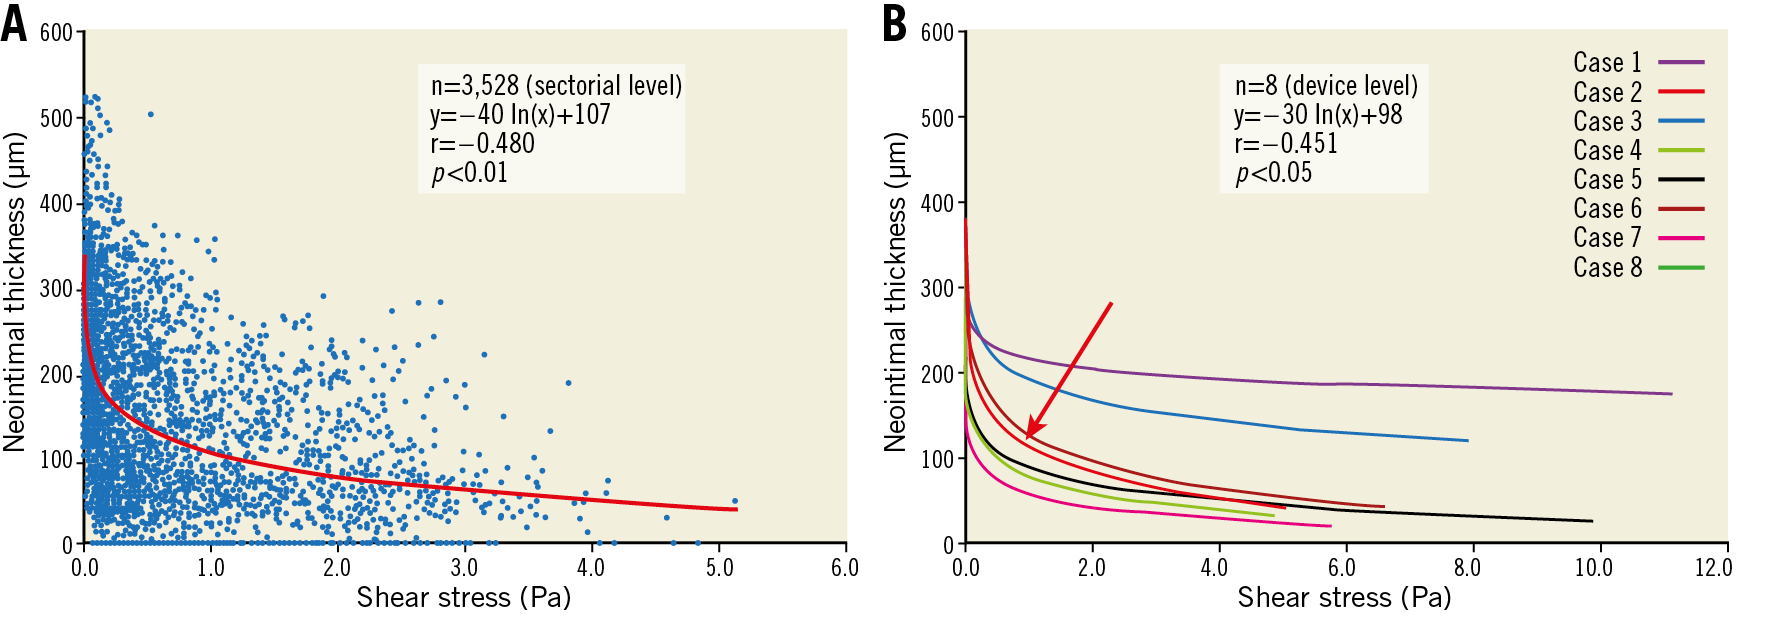
Figure 5. Inverse relationship between WSS post implantation and neointimal thickness at one-year follow up. A) Significant logarithmic inverse relationship between WSS and NT in one device displaying all the sectorial measurements obtained in that single device. B) The arrow identifies the neointima-WSS relationship for that specific device among all the other logarithmic inverse relationships observed in other devices.
At five years, in-scaffold median WSS (1.92 [1.31, 2.81] Pa) was significantly higher than post procedure (1.19 [0.84, 1.69] Pa) (p=0.0016). Median WSS in proximal and distal non-scaffolded segments was not significantly different from scaffolded segment median WSS (p=0.97, p=0.91, respectively) (Table 3). The model fit with correlation structure was much better than the model fit without (likelihood ratio test p<0.0001) in comparisons between the time points.
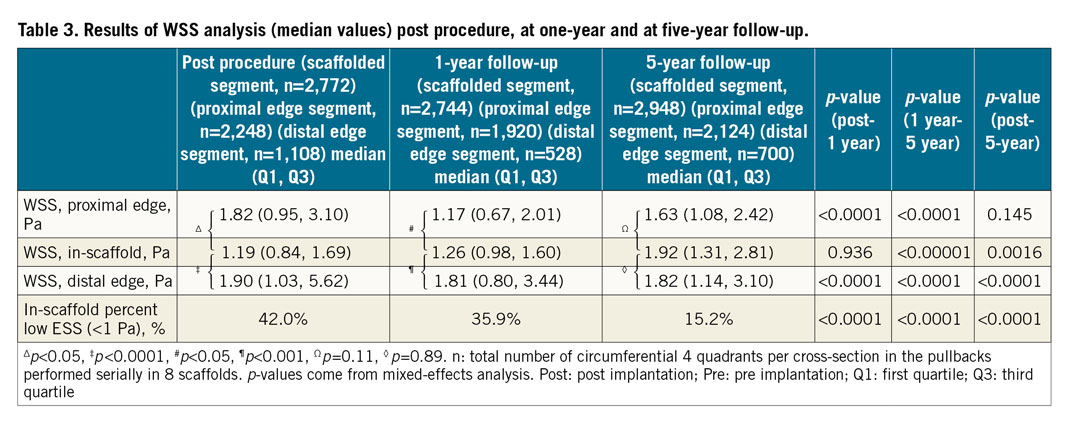
While post-WSS distribution was heterogeneous with numerous peri-strut zones of low WSS, at five years the distribution became more homogeneous (Figure 6, Figure 7). Vessel surface exposed to low WSS (<1 Pa) decreased significantly from 42.0% at baseline to 35.9% at one year and 15.2% at five years (p-overall <0.0001) (Figure 8).
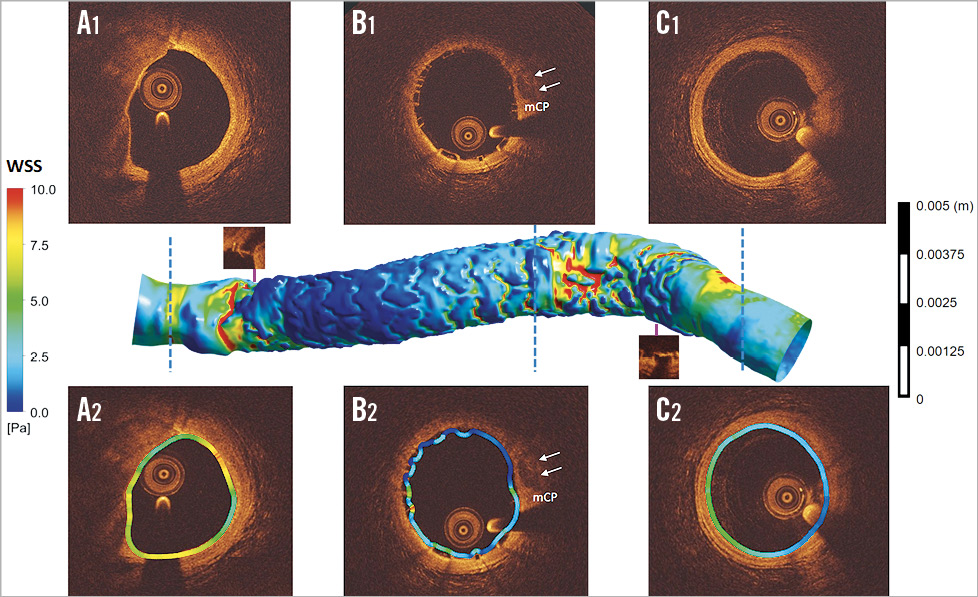
Figure 6. Post-implantation shear stress distribution in scaffold-implanted vessel. WSS was analysed post implantation in the proximal non-scaffolded segment (A1, A2), in scaffolded segments (B1, B2) and in the distal non-scaffolded edge segment (C1, C2). In the scaffolded segment, due to larger luminal area and strut protrusion, WSS in the inter-strut luminal surface shows a peri-strut area of very low WSS (dark blue in B2). At the inlet and outlet of the scaffold, the non-scaffolded segment shows a short region of high WSS in red (mCP: mixed calcified plaque).
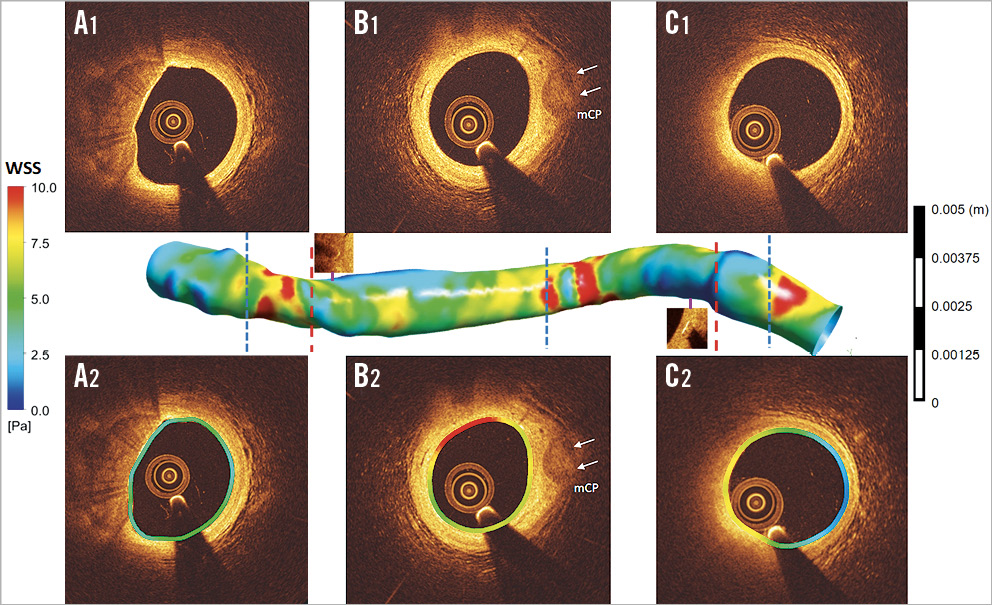
Figure 7. Shear stress distribution in scaffold-implanted vessel at five-year follow up. At five years, WSS was analysed in the proximal non-scaffolded edge (A1, A2), in scaffolded segments (B1, B2) and in the distal non-scaffolded edge (C1, C2). Compared to the corresponding cross-sections in the post-implantation CFD model in Figure 5, WSS distribution becomes more homogeneous and has more physiological values (colour-coded green and yellow) ranging between 5 and 7.5 Pa in the scaffolded segment identified on OCT by the radiopaque markers. The inlet and outlet of the scaffold still show an area of high WSS in red. At follow-up, the lumen became smooth without significant topographic obstacles which could disrupt the flow (mCP: mixed calcified plaque).
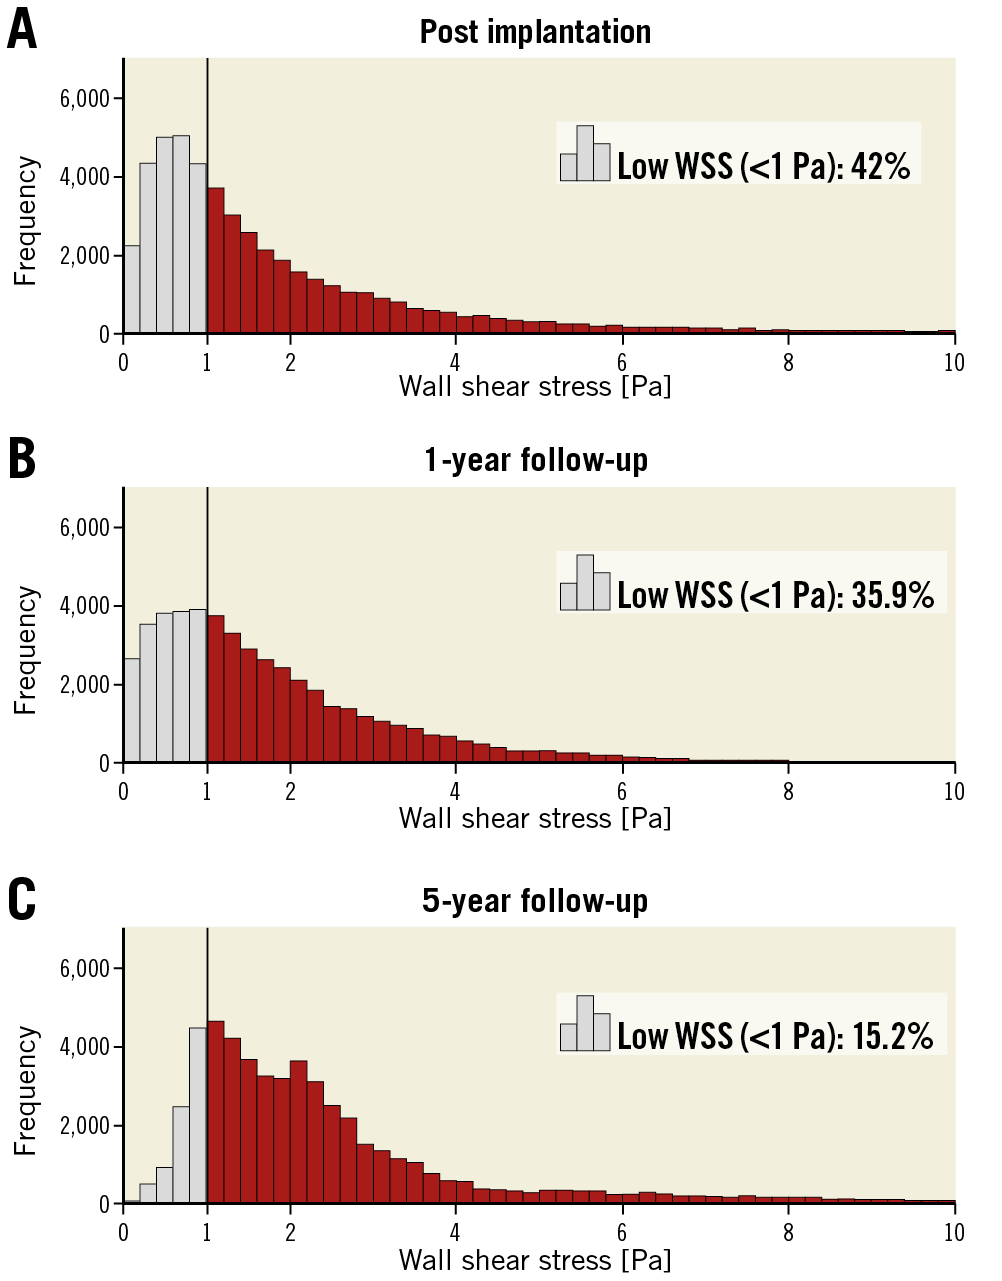
Figure 8. Histograms of WSS post implantation, at one year and at five years. The percentage of low WSS (<1 Pa) was 42% post implantation (A), 35.9% at one year (B) and 15.2% at five years (C).
Discussion
This is the first study to use serial OCT and CFD data to evaluate the effect of SP on WSS and NT at one-year and five-year follow-up. We have identified that: 1) the mean SP is 110±25 µm and only 36±15% of the strut thickness (157 µm) is embedded post implantation; 2) due to poor strut penetration, post-implantation thick square-shaped struts induced flow disruptions with regions of very low WSS peri-strut; 3) the disrupted laminar WSS and areas of very low WSS with flow reversal at baseline determine the amount of peri-strut neointimal proliferation at one year; 4) at five years, due to neointimal coverage, WSS recovers homogeneous distribution with physiological values; 5) at the edges of the scaffolded region, initial post-procedural step-up and step-down in WSS disappeared at five years.
THE IMPACT OF SP ON POST-WSS AND NEOINTIMAL REGENERATION AT ONE YEAR
Due to the wide footprint of the Absorb, strut embedment is not easily achievable. The square shape and initial contact radius of the struts impede penetration according to the principles of contact mechanics13. The penetration of the strut is directly related to the strut width which is based on Pascal’s law of pressure (Pressure=Force/Area). As the strut width increases, the pressure required for wall penetration will increase which may reduce the strut embedment considerably. With poor penetration, thick struts stand as obstacles, creating flow separations, eddies and stasis around the struts, resulting in low WSS peri-strut. On the other hand, the strut surface induces higher WSS, creating a gradient in WSS between the top and bottom of the struts14. The disturbed flow and oscillatory WSS promote biological changes producing a well-established environment for thrombus formation and neointimal hyperplasia (NH) through activation of athero-promoting genes15. The NTi on the strut surface is much less accentuated than in the inter-strut zones16. Over time, this mechanobiological modulation of tissue proliferation dissipates the WSS micro-gradient as the proliferating tissue between the struts fills inter-strut zones. NTi continues to develop until it reaches the strut surface and the thicker the struts are, the thicker the neointima will be.
With thinner struts and deeper VW embedment, protrusion is reduced and recirculation and stagnation around the struts will be smaller5. In case of thinner struts with good penetration, neointimal growth (NG) will inevitably be limited with less lumen area reduction17.
IMPROVEMENT IN WSS AT LONG-TERM FOLLOW-UP
Following scaffold implantation, barotrauma stretch-induced arterial injury changes the smooth muscle cell (SMC) phenotype from contractile to synthetic and triggers SMC migration towards the subintima where they secrete abundant proteoglycans forming the bulk of the stenotic mass18. Mechanical stretch also engenders inflammatory reactions in the intima and adventitia. The antiproliferative drug eluted from the scaffold aims to eliminate the early inflammatory reaction secondary to the barotrauma. However, 80% of the antiproliferative drug is eluted from the scaffold by 30 days7. The limited duration of antiproliferative agent release has no significant effect on long-term NG that is influenced by other factors such as LH. Apparently, increased and sustained laminar WSS at follow-up is an inhibiting factor for further cellular proliferation19.
Step-up and step-down in luminal dimensions at the inlet and outlet of the scaffold generate macro-changes in WSS and modulate neointimal proliferation that will ultimately homogenise luminal dimensions in the proximal, distal and scaffolded segments20. The morphological improvement in transitional zones was completed at one year21.
METHODOLOGICAL CHALLENGES IN ASSESSING WSS AND NEOINTIMA
During implantation, the thick struts of the Absorb are barely embedded and highly protruding. These protruding struts disturb laminar flow around the struts. At that stage, the best approach to describe flow patterns is proposed by Gogas et al, depicting five sites of WSS assessment: proximal inter-strut, proximal peri-strut, on top of the strut, distal peri-strut and inter-strut space distal to the strut22.
At one year, translucency and volume of the strut remain essentially unchanged. By interpolating lumen contour from the embedded struts, it is possible to reconstruct the lumen contour (for a retrospective post-implantation model). It has been appealing to compute retrospectively peri-strut WSS (virtual baseline WSS) and correlate the current neointima at one year, as this approach enables perfect co-localisation and matched assessment of the post-WSS with current NG at one year (Figure 2),16.
At five years, the struts and initial lumen contour are undetectable, and the luminal surface is smooth and homogeneous. The only feasible method of surface analysis was to subdivide the luminal perimeter into subunits of 5° sectors. To standardise the analysis method and render the WSS analysis comparable for three periods of acquisition, post implantation, one year and five years, we applied a subunit sector approach to those three periods16.
Limitations
The main limitation of the present study is that, to investigate the relationship between post-WSS and NT at one year, a retrospective 3D vessel model was implemented using one-year OCT data. This was done to overcome potential discrepancies in corresponding OCT frames, regarding the circumferential strut distribution between post-implantation and one-year OCT and to associate post-WSS and follow-up neointima as accurately as possible. The second limitation is the small number of observations. Several criteria were implemented for filtering suitable cases to investigate the effect of SP on post-WSS and NH at one year. 1) To prevent any effect of swirling flow due to vessel curvature, on the scaffolded segment WSS distribution, we did not include the cases with curvature. 2) The cases without two angiographic projections with at least a >25 degree difference could not be reconstructed. 3) To investigate the alteration in WSS at one year and five years, the cases with truly serial OCT imaging post implantation, at one year and at five years were recruited.
Conclusions
Following Absorb implantation, the local flow micro-environment around the protruding struts is characterised by alternance of high and low WSS. SP and disrupted local WSS appear to be important determinants of NG. The thickness of the struts and intensity of the flow disturbance predetermine the thickness of the inter-strut neointima. With time, newly constituted intimal lining improved the luminal surface with homogenisation of the WSS towards physiological values at long-term follow-up. Despite the initial bulky structure of the quadratic struts, the VW recovered its smooth surface to re-establish a de novo laminar WSS profile, following biointegration of the scaffold into the VW.
Guest Editor
This paper was guest edited by Adnan Kastrati, MD; Deutsches Herzzentrum, Munich, Germany.
|
Impact on daily practice The fundamental issue of the polymeric struts in PLLA is their lack of tensile strength and radial force that have to be compensated for by their thickness and large footprint, pre-empting VW embedment and their quick coverage by neointima. Thereby, SP and its disturbing impact on laminar flow and WSS predetermine the thickness of the neointima. Although the present observation is hypothesis-generating, recent preclinical and clinical observations with thinner and circular struts have demonstrated a causative relationship between embedment (more) and WSS disturbance (less)4. Long-term follow-up will confirm or disprove a causative relationship between strut thickness and the thickness of the neointima with new-generation bioresorbable scaffolds with thinner and circular struts. |
Funding
E. Tenekecioglu has received a research grant from the Scientific and Technological Council of Turkey (TUBITAK).
Conflict of interest statement
P.W. Serruys and Y. Onuma are members of the International Advisory Board of Abbott Vascular. The other authors have no conflicts of interest to declare. The Guest Editor has no conflicts of interest to declare.
