Abstract
Aims: Optical coherence tomography (OCT) provides high-resolution imaging which enables characterisation of atherosclerosis and vascular response to injury, but to ensure optimal analysis, one must realise potential sources of image distortion. We designed a series of analyses, using coronary stents as a model, to investigate the influence of wire position on OCT-derived vascular images.
Methods and results: The study evaluated intracoronary OCT images from the Cardialysis-Cleveland University Hospitals Cardiovascular Imaging Core Laboratories database. Intracoronary OCT images were acquired with the M2 system (LightLab Imaging Inc., Westford, MA, USA) and analysed using a customised software. Wire concentric index (WCI) was calculated as “wire-lumen distance/lumen radius”. Lumen, stent, and strut contours were defined and 360 chords (1 degree increments) were placed radially between the lumen and stent contours. Strut length was defined by the number of chords spanned by each strut. Strut level thickness (SLT) was measured with each chord. SLT variability ([Max - Min SLT]/number of chords per strut) was calculated. Lumen measurements were performed with optimal calibration and repeated with ±1% changes from optimal Z-offset. The hemisphere containing an eccentric wire had shorter strut reflections (5.0±1.6° vs. 6.6±2.1°, p<0.001) compared to the opposite hemisphere. Eccentric wires depicted 84% of the struts as non-parallel to the luminal surface (>10% SLT variability). Changing Z-offset by 1% resulted in a non-uniform shrinkage or expansion of the luminal contour in images generated from eccentric wires, but not from concentric wires.
Conclusions: Eccentric intraluminal position of the OCT ImageWire occurs frequently and affects calibration and interpretation of images, including length, orientation and visibility of vessel wall structures.
Introduction
Imaging the endovascular environment at a micron-scale level holds considerable promise1, but the future impact of optical coherence tomography (OCT) on clinical and research applications depends on judicious evaluation and understanding of both its strengths and intricacies. The ability of OCT to characterise arterial wall components has been demonstrated in experimental models2. OCT has also been used safely in humans to characterise atherosclerosis and to evaluate intravascular devices3-6. A recent forum among European investigators recommended the use of OCT for evaluation of drug-eluting stents (DES)7. However, potential sources of distortion in OCT coronary imaging reconstruction have not been previously appreciated.
The current commercially available OCT system (M2CV OCT Imaging System; LightLab Inc., Westford, MA, USA) consists of a single-mode optical fibre in a hollow rotating cable that emits light beams radially from the catheter axis. The image is reconstructed based on reflected signals of each individual scan, a process influenced by the distance between the sample and the light source. The small diameter of the ImageWire (0.019 inches) may lead to an eccentric intraluminal position during image acquisition in vivo, which in turn may affect image reconstruction. The present investigation aims at evaluating the influence of the ImageWire position on OCT coronary images in humans.
Methods
The study evaluated intracoronary OCT images from the University Hospitals’ Cardiovascular Imaging Core Laboratories database. These images were acquired as part of clinical trials evaluating follow-up stents. The study included stents implanted electively in consecutive patients with de novo, long stenoses in native coronary arteries requiring overlapping stents. For the strut reflection length and orientation study, 6-month follow-up images of five lesions (zotarolimus-eluting stent: three; paclitaxel-eluting stent: one; sirolimus-eluting stent: one) were evaluated. For the strut visibility study, 6-month follow-up images of 10 lesions (zotarolimus-eluting stent: four; paclitaxel-eluting stent: four; sirolimus-eluting stent: one; bare metal stent: one) and 13-month follow-up images of 15 lesions (paclitaxel-eluting stent: 12; bare metal stent: three). The type of the stent was blinded to the analysts. Informed consent was obtained for all patients as part of their participation in the clinical trials. Stented coronary segments were selected for evaluation. This provided a good in vivo model to evaluate image distortion, given the stent struts’ well-defined bright reflection with shadowing and known morphology. The overall goal of the study was to determine if eccentric intraluminal position of the OCT ImageWire (IW) affects calibration and image reconstruction.
OCT image analysis
Cross-sectional images (frames) were excluded from analysis if they involved a major side branch (occupying > 45 degrees), sew-up or scattered beam artifacts, or any other situation compromising image quality (Figure 1)10.
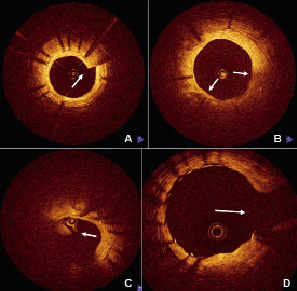
Figure 1. Examples of non-analysable frames due to common artifacts. A) Sew-up artefact (arrow) caused by the rapid axial movement of the wire during the scanning rotation, leading to the misalignment of the lumen contour. B) Scattered beam artefact caused by a bubble in the silicon lubricant between the rotating optic fibre and catheter sheath results in low signal regions which degrade penetration and resolution. C) Residual blood / thrombus, causing extensive image scattering and attenuation which impairs visualisation of the lumen contour. D) Frames were excluded when a side branch (arrow) spanned over an eighth of the total circumference.
Measurements of OCT cross-sectional images were performed using a dedicated automated contour-detection system (OCT system software B.0.1; LightLab Inc., Westford, MA, USA) developed in collaboration with the Cardialysis-Cleveland core laboratory. The lumen contour was delineated automatically, the inner and outer contours of each strut reflection were delineated semi-automatically, and an algorithm automatically placed 360 chords (1-degree increments) radially between lumen, inner and outer strut contours, and from this the distance of each chord was measured (Figure 2).
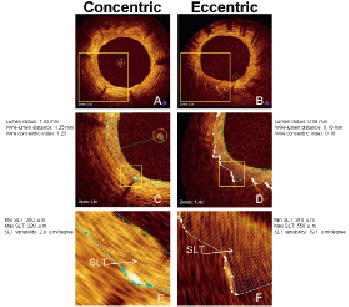
Figure 2. Evaluation of strut-level thickness variability. Representative frames with concentric (left panel) and eccentric (right panel) wire positions are shown (A, B = frames without contours). Lumen and stent contours and 360 degrees chords are shown in figures C, D, E, F. The direction of strut surface reflection is almost parallel with the lumen contour in the frame with concentric wire position (A, C, E), whereas it appears perpendicular in the frame with eccentric wire (B, D, F). The SLT variability, calculated based on each chord value spanning a single stent strut (arrows), is expected to be higher for the strut depicted in eccentric wire position (E) compared to the eccentric wire (F). SLT: strut level thickness.
These measurements form the basis of a series of assessments, each with a specific methodology, designed to address the study questions. Definitions of OCT parameters utilised in this study are described below.
OCT quantitative endpoints
A wire concentric index (WCI) was created as a scale of wire proximity to the lumen centre (centricity) and was calculated as the distance from the IW to the vessel wall divided by lumen radius: (WCI)=wire-lumen distance / lumen radius. In addition, the cross-sectional image was divided evenly into halves, and labelled as the hemisphere “containing” the wire or “opposite” to the wire with struts then labelled according to their location (Figures 3A & B).
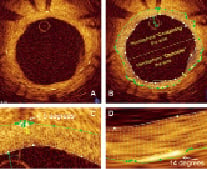
Figure 3. Evaluation of the length of strut reflection. Cross sectional OCT image with an eccentric wire without contours (A). The cross-section is divided into two hemispheres (B, contours are also depicted) based on the wire position. The strut reflection in the hemisphere opposite from the wire appears longer compared that located near the wire, which is confirmed by measurements (C and D: C shows the strut close to the wire and D shows the strut in the opposite hemisphere).
Strut reflection length was measured by the number of chords (angular distance) spanning each strut reflection (Figures 3C & D). This measurement is not the true strut size, but a reflection of light (blooming) from the strut surface. Strut reflections are typically present in every quadrant of the vessel cross-sectional image, have a characteristic appearance and provide a measurable surrogate to determine how the appearance of vessel wall structures vary depending on their location in relation to the wire position.
Strut-level thickness (SLT) is the distance between the inner strut contour and the coronary arterial lumen, determined automatically across the entire surface of each strut reflection at 1-degree increments (360 chords) (Figures 2C & D). SLT variability was calculated for each strut as “maximum – minimum SLT normalised (divided) by strut reflection length”. This endpoint was developed to evaluate SLT as a function of WCI, and to determine if WCI affects strut orientation in space. For instance, struts with a parallel orientation to the lumen surface are expected to have minimal or no SLT variability. SLT variability >10 µm was selected based on maximum OCT resolution as an indirect index of unparallel orientation between the strut and lumen surfaces (Figures 2 E & F).
To investigate the effect of wire position on strut visibility, frames were segregated in circumferential regions having the lumen center as the angle’s vertex. Frames were divided into two regions: “direct” (30 degrees containing the wire and the opposite 150 degrees) and “oblique” (15 to 105 degrees on either side of the wire) regions (Figure 4).
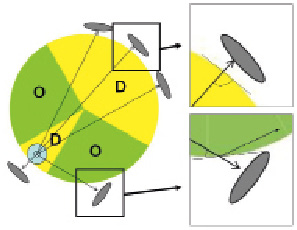
Figure 4. Graphic illustration of the vessel wall regions located in the direct and oblique orientation in relation to the IW. The stent struts are illustrated in grey oval shapes and represented according to their orientation to the lumen. The cross-section image was divided in two regions: direct (“D” = 30 degrees containing the wire and the opposite 150 degrees) vs. oblique (“O”). The right panels show the angle incidence of the beam as it enters the vessel wall in oblique and direct regions. Structure visualisation may also be affected by Snell’s law16, besides attenuation and refraction. IW: ImageWire.
The number of visualised stent struts was compared between direct and oblique regions. Frames that had no visible struts in the «oblique» regions were considered blind frames (BF). The frequency of BF was determined as a function of WCI.
The Z-offset is an adjustable correction mechanism in OCT image calibration11, and as part of our calibration methodology, OCT images of a guiding catheter were acquired to validate the optimal value. When calibrating the image, it is expected that the calibration affects the entire image uniformly, provided the wire is centrally located in the lumen. We performed measurements of reconstructed images using the optimal Z-offset, as determined by adjusting the fiduciary marks and then repeated measurements with +1% and –1% change in the Z-offset. We initially tested the impact of Z-offset selection on lumen areas and diameters. Then to evaluate if eccentric wire position would affect calibration of OCT images, we compared automated lumen area, diameter and 360 radii (chords) measurements in images with eccentric and concentric wire position (Figure 5).
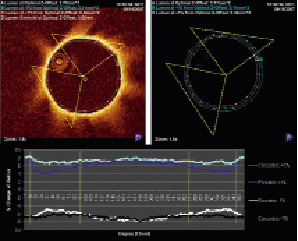
Figure 5. Impact of the wire location on image calibration. Upper panel shows a cross-sectional image without contours and the corresponding lumen contours of the same image according to the Z-offset settings (optimal-middle line, –1% outer and +1% inner contour). The regions demarcated by the yellow triangle depict the luminal contour most vulnerable to non-uniform changes in measurements with eccentric wire position. Lower panel shows a graphic display of each individual 360-degree radii measurements according to Z-offset settings and wire. The shortest distance from the centre of the catheter to the lumen wall was labelled as “0 degree” starting point. Changing the Z-offset in a concentrically placed wire (light blue and black lines) exerts a consistent change in the vessel radii. However, when the wire is eccentric (dark blue and white lines), adjusting Z-offset causes non uniform change to the radii of the vessel. Please note that the measurements start to separate (non-uniform) at approximately 10 and 270 degrees (framed by yellow lines). They correspond to the triangles in the upper panels; this region also coincides with the oblique regions depicted in Figure 4.
Image acquisition
All images were obtained with an intravascular time domain OCT system (M2 Cardiology Imaging System; LightLab Imaging, Inc., Westford, MA, USA) using a 0.019-inch imaging wire (ImageWire, LightLab Imaging, Inc., Westford, MA, USA). Images were acquired during automatic-pull back at 1 mm/second and at 15.6 frames/second. The patients were given heparin intravenously before procedures to maintain an activated clotting time over 220 seconds. The OCT image system was introduced into the target coronary segment through a 6 Fr guiding catheter. A dedicated occlusion balloon catheter (Helios; Avantec Vascular Corp., Sunnyvale, CA, USA) was inflated to 0.4-0.7-atm and proximally to the target segment. During inflation the distal vessel was flushed with warm (37 ºC) heparinised Ringer’s Lactate 0.5-1 cc/sec to clear the blood and assure optimal image quality. Images were digitally recorded and submitted to the corelab for offline evaluation.
Statistical analysis
For strut orientation, length, and visibility, all estimated values are shown as a continuous value, and expressed as mean standard deviation and mean with interquartile range. Comparisons of the continuous variables were made by unpaired t-test. Categorical values were expressed as frequencies and comparisons were made by chi-square test. Linear regression analysis was used to evaluate the correlation of WCI with Maximum SLT variability of each frame, average length of strut and strut count. Sensitivity and specificity were calculated according to standard definitions. To assess variability in delta chordal value between optimal Z-offset and ±1% Z-offset, a coefficient of variation was calculated: (the standard deviation of change in chordal length/mean change in chordal length). Differences are considered statistically significant at p<0.05. Statistical analyses were performed using SPSS software (Version 17; SPSS Inc. Chicago, IL, USA).
Results
Strut reflection length and orientation
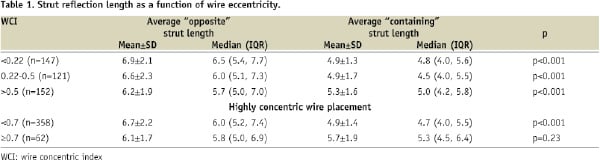
Strut reflection length assessment included 420 frames with 4,025 struts. All included frames showed at least one strut reflection in the “opposite” hemisphere versus the hemisphere “containing” the wire. When the total analysed frames divided into three groups in accordance with the WCI, the wire had an eccentric location (WCI<0.22) in 147 frames, intermediate (0.22≤WCI<0.5) in 121 and concentric (WCI≥0.5) in 152 frames. Overall, strut reflection appeared longer in the “opposite” hemisphere versus the hemisphere “containing” the wire (6.6±2.1° vs. 5.0±1.6°, p<0.001). In frames with eccentric wire position, length of strut reflection remained significantly different in each class of WCI (6.9±2.1° vs. 4.9±1.3° for WCI<0.22; 6.6±2.3° vs. 4.9±1.7° for WCI 0.22-0.5; 6.2±1.0° vs. 5.3±1.6° for WCI >0.5; p<0.001 for all data) in “opposite” and “containing” regions, respectively. Strut reflections remained significantly different until a WCI of ≥ 0.7 (true concentric wire position) was achieved, and thereafter the strut lengths located in the “Opposite” and “Containing” hemispheres were similar (6.1±1.7 vs. 5.7±1.9; p=0.23) (Table 1).
Strut orientation assessment included 421 frames with 4,046 struts. SLT variability >10 µm was found in 84% of frames with eccentric wires, 35.7% in intermediate, 17.3% in concentric (p<0.001). Lower WCI correlated with maximum SLT variability (r=-0.55, p<0.001).
Strut visibility
In this assessment, a total of 1,193 OCT image frames were included. There were 57 (4.8%) BFs, defined as absence of any strut. Incidence of BF for eccentric (WCI<0.29, n=431), intermediate (0.29≤WCI<0.5, n=330) and concentric (WCI≥0.5, n=432) wire positions were: 8%, 5.8%, 1.6% (p<0.001), respectively. Among frames with eccentric wire location (n=431), opposite regions depicted fewer struts than containing regions (2.6±1.6 vs. 3.6±1.8, p<0.001).
Z-offset
In this analysis, 16 catheter images were selected: eight eccentric and eight concentric wire positions. The average WCI was 0.26±0.03 and 0.56±0.18 (p<0.001) in the eccentric and concentric group respectively. Changing the Z-offset by +1% affected the average diameter of all frames by 6.5% and cross-sectional area by 13.5%. Changing the Z-offset by –1% affected the average diameter of all frames by -6.5% and cross-sectional area by –12.4%. However, the relative difference in measurement change between concentric and eccentric frames was significant (Table 2).
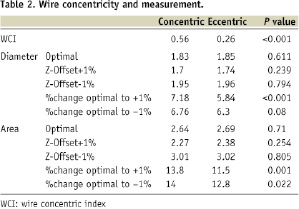
Further, these changes in radii measurements were not uniformly distributed around the lumen (i.e., the image did not shrink or expand equally) with eccentric wire position. Depicted graphically, the average degree of change for each chord is shown; the corresponding region which is most inconsistently affected is indentified between the yellow lines (Figure 5). In the +1% Z-offset group, the coefficient of variation for radial change was 23.8 (eccentric) compared to 6.26 (concentric). For the –1% Z-offset group, the coefficient of variation was –17.1 (eccentric) compared to –5.64 (concentric). Interestingly, regions approximately between 10-90 degrees and 270-350 degrees showed the most discrepancy in change among the 360 chords of the circle. Ultimately this resulted in a deformation of the lumen / vessel contour as seen in the contour-only image (figure 5 upper-right panel).
Discussion
OCT is a novel imaging modality with an expanding role for in vivo evaluation of coronary arteries, and an emerging niche in the assessment of coronary artery plaque, stent apposition and device evaluation. With the increasing usage of OCT, it is important to recognise a potential source of image bias in the production of these high resolution vascular images. The effect of eccentric wire position has been an under-appreciated source of potential error, although similar effects have already been indicated in the frontier studies on intravascular ultrasound12. The results of this study indicated that an eccentric intraluminal position of the OCT IW affects image calibration, visibility, perceived orientation and measured length of structures located within the vessel wall (i.e., stent strut reflections). Recognition of these and other sources of distortion in image interpretation can cause the incorrect evaluation of incomplete stent apposition and are critical for both clinical and research applications of OCT.
As shown in Table 3, there are various artifacts of intracoronary OCT images other than we investigated in the current study.
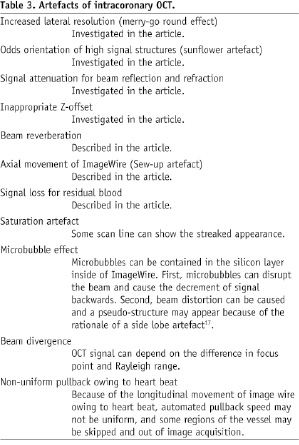
One should pay attention all of them for the accurate interpretation of the OCT images.
Eccentric wire position leads to significant changes in strut length and orientation. Such image misrepresentation reveals that one must take into account the distance between the object and IW as well as its location in relation to the wire position. Additionally, the effect of rotational scanning on image reconstruction has two other potential sources of bias that likely contributed to this intracoronary imaging phenomenon, as described below.
“Sunflower effect” – object orientation
Coronary OCT images are a reconstruction of multiple scans (A lines) obtained while the IW spins, emitting light and being pulled along the artery. All structures thus appear in the direction of the spinning wire and perpendicular to the emitted beam from the wire, not perpendicular to the centroid of the lumen. If the wire is in a concentric position, the centre of the true image and displayed images are similar, but this relationship is affected by an eccentric wire position.
A by-product of rotational scanning, the reflections from metallic stent struts can be elongated and seemingly align toward the IW, akin to sunflowers aligning to the sun. This effect is pronounced with eccentric wire position, as it can display strut reflections almost perpendicular to the lumen surface in oblique regions from the wire. Besides its distinct visual appearance, this phenomena is quantified in our study by the high SLT variability observed in the oblique regions in eccentric wires (Figures 2E & F). Such effects can also be seen in intravascular ultrasound (IVUS) images, however the lower resolution of IVUS precludes strut-level analyses, and the larger IVUS catheter is usually more centrally located within the lumen. This effect will likely be diminished with the newer generation of optical frequency domain imaging (OFDI) OCT because of a larger catheter size, however this concept still needs to be tested. When using wire-based OCT platforms, one should be aware of the potential impact of sunflower artifacts during stent and plaque analyses particularly in frames with eccentric wires. In our corelab, when performing SLT analysis, great attention is paid to placing measurements in the middle of the blooming artifacts to minimise the influence of the “sunflower effect” on the SLT results.
“Merry-go-round effect” – object length
OCT’s high axial resolution is well-known, but its lateral resolution is limited by the number of scans (A lines, 200). Thus, distance dependant image distortion may also occur with rotational scanning. As such, the further the distance of the object (i.e., strut) from the IW, the longer its angular length appears. This phenomenon is secondary to the effect of lateral resolution in regions far from the «sweet-spot» focus, and away from the light source. One may correlate these images with “merry-go-round» physics, as objects farther from the central axis “move” faster than near field objects and produce a «stretched» image. We propose that this may have important future implications in the serial assessment of strut length, particularly when evaluating the degradation of bioabsorbable stents. From the result of this study, WCI of ≥ 0.7 should be optimal for the correct evaluation of strut length.
Strut visibility
The effect of beam angle and distance from the image catheter on echogenicity between adventitia and media has been reported in IVUS13. Similarly, beam angle and distance from the IW may affect the OCT signal. This study demonstrated that strut visibility can be suboptimal in particular regions of the cross-sectional image, a characteristic more evident when the wire position is eccentric. The greater number of stent struts imaged in the direct (“D”) vs. oblique (“O”) regions suggests the potential to “miss” structures in the coronary artery wall in the regions least perpendicular (oblique) to the image beam.
Light attenuation is a well known phenomenon affecting signal intensity in OCT image. Together with refraction, these are the main factors leading to relatively poor OCT image depth. In eccentric wires, the light will travel through tissue to image the oblique wall regions. Tissue has much higher attenuation and refraction indexes than the lumen filled with saline or contrast. One should be aware that low or lack of signal in plaques located in regions oblique to eccentric wires can be explained by the intrinsic properties of OCT rather than the presence of calcium or lipid components.
Z-offset
The observed changes in lumen dimensions according to the Z-offset settings highlight the importance of accurate calibration for OCT image measurements, which is similar to other imaging modalities. Importantly, our 360 chord (every 1-degree) circumferential analysis showed that the image shrinks or expands in a non-uniform manner along the lumen circumference if the wire is eccentric. Comparing an eccentrically placed wire to a concentric one, the impact of changing Z-offset is significantly different in the contour of the wall near to the IW. Regions located in an oblique orientation adjust less to changes in Z-offset, which in extreme cases creates a visual luminal distortion. Importantly, this happens in a similar location (oblique regions) to the loss of visualised stent struts and sunflower artifacts. Interpreters of OCT images should be aware of these “hot-spots”, located at 15-105 degrees on either side of an eccentric IW, where distortion congregates. When the catheter is concentric, changing Z-offset affects all regions of the lumen nearly equally (uniformly). The magnitude (±1%) of the changes in Z-offset tested in this study demonstrate a proof of concept, although it is larger than would typically occur in a corelab and with well trained users in the clinical setting. However, inexperienced operators should be aware of the critical impact of Z-offset settings for accurate measurements and image visualisation when performing online analyses, as a 12-14% difference in area may impact clinical decision making, particularly in moderate stenoses. While it is not yet known if this has clinical relevance, our study highlights the importance of careful evaluation of optimal Z-offset, given the potential for contour distortion and potential misinterpretation of structures.
Limitations
The current study did not test the impact of pull-back speed and difference in the type of stent on these artifacts, although the previous paper showed these effects14,15. The present findings are not necessarily applicable to OFDI OCT systems, since both physics of the light source and mechanics of the catheter including different catheter profile may have significant impact on the image formation.
Conclusion
The present study shows different types of image production distortions and reveals their amplification as a result of an eccentrically placed IW. The WCI index was found to correlate with the various artifacts demonstrated (object length, orientation, luminal contour, as well as the ability to depict objects at obtuse angles to the image beam). Eccentric wire position was also shown to impart image distortion during the calibration of the system. Physicians and scientists must be aware of these fundamental concepts for the optimal use and proper interpretation of OCT images in both clinical and research applications.