KEYWORDS
Abstract
Aims: To study online left ventricular (LV) dynamic effects of transmural ischaemia and reperfusion during consecutive balloon coronary occlusions in the setting of percutaneous coronary intervention (PCI).
Methods and results: In 10 consecutive unselected patients with stable angina (seven males, mean age 62±3 years) who underwent elective PCI, LV dynamics were continuously recorded using a pressure-conductance catheter to simultaneously measure pressure and volume (PV-loop). The effects of a prolonged balloon coronary occlusion (148±19 s) and a second occlusion on various LV function parameters were studied, as well as recovery of these parameters after reperfusion. Ischaemia caused an immediate (<5 s) decrease in diastolic function, followed by a decrease in contractile function, indicated by a rightward shift of the PV-loop, and a decreased dP/dtmax and ejection fraction. All parameters recovered within two minutes after reperfusion. The second occlusion caused a more rapid and more pronounced decrease in systolic and global LV function, while the 12-lead ECG showed less ST-segment deviation.
Conclusions: Online LV pressure-volume measurements during elective PCI show that prolonged balloon coronary occlusion causes a phased ischaemic response of diastolic dysfunction, and then systolic dysfunction with more pronounced deterioration during a consecutive ischaemic period, paradoxical to the ischaemic electrocardiographic signs.
Introduction
Ischaemia caused by occlusion of a coronary artery leads to a cascade of left ventricular (LV) dynamic effects.1 Repeated or long coronary occlusions during percutaneous coronary intervention (PCI) may possibly induce myocardial stunning2, but may also protect the myocardium against subsequent ischaemic periods.3
Data on ischaemia-induced effects on LV function are available from experimental studies in animals4 as well as from studies during angioplasty in humans.5-7 However, usually relatively short ischaemic bouts were studied and not continuously and directly measured.5-7 Hence, the magnitude and timing of acute ischaemia-induced effects in humans is poorly documented. Furthermore, limited information is available on LV function responses to repeated prolonged ischaemic bouts. Experimental studies have shown that ischaemic contractile dysfunction develops more rapidly and pronounced when preceded by one ischaemic bout.8 However, this phenomenon has never been confirmed in humans. In humans, pulmonary artery pressure together with cardiac vein flow and lactate production was assessed9, as well as LV pressure10, while most studies were focused on ST-segment deviations11 and wall motions scores.12
Therefore, the main objective of this study was to evaluate acute responses of LV dynamic parameters to ischaemia and reperfusion throughout elective PCI procedures by direct and continuous assessment of LV pressure and volume (PV-loop), enabled by a pressure-conductance catheter.13,14 This allowed us to study 1) the immediate and continuous responses to a prolonged balloon coronary occlusion until occurrence of transmural ischaemia, and to subsequent reperfusion, and 2) the responses to a second prolonged balloon coronary occlusion.
Methods
Patients
The study population consisted of 10 consecutive unselected patients with stable angina and single vessel disease, who underwent an elective PCI of the left anterior descending coronary artery (LAD) and of the right coronary artery (RCA). Exclusion criteria were previous myocardial infarction, impaired LV systolic and diastolic function, valvular disease and LV thrombus. The study complied with the Declaration of Helsinki and was approved by the institutional research and ethics committee. All patients gave written informed consent.
Study protocol
Patients were pre-treated with aspirin (100 mg) and clopidogrel (300 mg) and received a bolus of heparin (5000 IU IV) before PCI. After placement of the 6 Fr guiding catheter, the 7 Fr pigtail equipped combined pressure-conductance catheter (CD Leycom, Zoetermeer, The Netherlands) was placed in the LV via the femoral artery. The Swan-Ganz catheter was placed in the pulmonary artery via the femoral vein. A 5 mL blood sample was used to measure rho, blood resistivity. Cardiac output was determined by thermodilution and parallel conductance by hypertonic saline injections in order to calibrate the volume signals of the conductance catheter.13 Patients were subjected to prolonged balloon predilatation (first balloon inflation) of the stenosis until transmural ischaemia (as >2 mm ST-segment elevation in two contiguous leads) and chest pain occurred. The subsequent balloon inflation for stent placement (second balloon inflation) followed the same protocol. A five minute period between the coronary occlusions was pursued to allow LV dynamic indices to return to baseline values. Intracoronary drugs such as nitroglycerin were not administered prior to completion of the measurements.
LV dynamic measurements and analysis
LV dynamics were recorded continuously during the PCI and were analysed offline. Balloon occlusion duration, time until chest pain and ECG changes were assessed. Maximal ischaemia-induced effects were assessed just before balloon deflation and compared to pre-balloon inflation baseline. Per-beat averages of the recorded variables were calculated as the mean of all beats during a steady state of at least eight seconds and covering two respiratory cycles. The following indices were obtained: heart rate (HR), cardiac output (CO), ejection fraction (EF), stroke volume (SV), stroke work as the area of the PV-loop (SW), end-systolic and end-diastolic volume (ESV, EDV), end-systolic and end-diastolic pressure (ESP, EDP), maximal rate of pressure change (dP/dtmax), and the relaxation time constant Tau, defined as that time required for the cavity pressure at dP/dtmin to be reduced by half.15 Effective arterial elastance (EA), an index of LV afterload, was calculated by ESP/SV. End-systolic elastance (EES) was estimated by ESP/ESV16, and end-diastolic stiffness (EED) by EDP/EDV. Subsequently, the ventricular-arterial coupling ratio was calculated by EES/EA, which describes the interaction between LV performance and the systemic arterial system.17 Regional cycle efficiency (RCE) was calculated for the most basal and apical volume segment by SW/(∆PLV·∆VLV), as previously described.18 Lastly, the half-time value, a 50% change of maximal effect was used to calculate the rate of change of the LV function indices.
Statistical analysis
Data are expressed as mean ±SEM or n(%). All changes were tested with Student’s paired t-test.
Results
Patient characteristics
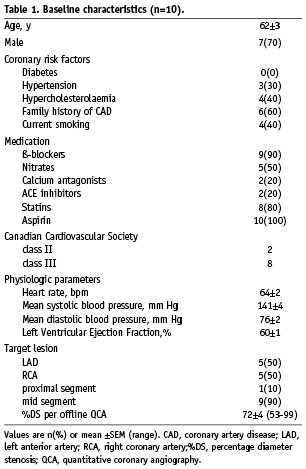
The baseline characteristics of the 10 patients are shown in Table 1. All patients were in sinus rhythm.
First balloon inflation
The left panel of Table 2 shows changes in LV dynamics during the first coronary balloon occlusion (148±19 s). First, diastolic function decreased (started<5 s): as indicated by an increased Tau, EDP and EDV. Second, contractile function decreased, as indicated by a rightward shift of the PV-loop during all LAD occlusions and three out of five RCA occlusions, an increased ESV and a decreased EF, and dP/dtmax. Global LV function decreased indicated by the changed SV, EA and EES/EA ratio. Regional LV function decreased indicated by the decreased apical RCE. All indices showed some degree of stabilisation shortly after their initial rapid deterioration. LV dynamics including RCE showed no differences in response to ischaemia between the LAD and RCA patients. The mean time to maximal ST-segment deviation was 96±32 s and the mean time to chest pain 105±26 s. Figure 1A illustrates a typical patient with a rightward shift of the PV-loop. The two patients without a PV-loop shift had a subtotal RCA stenosis and angiographic collateral flow (Rentrop class II and III). Their coronary occlusion was terminated at 180 seconds, without ECG changes or angina.
After balloon deflation, all ischaemia-induced dynamic changes returned to baseline: Tau (12±2 s), dP/dtmax (19±6 s) and SW (18±1 s) rapidly returned to baseline, whereas EDV (34±7 s), ESV (47±14 s) and EDP (57±18 s) slowly returned to baseline. There was a transient overshoot of SW above pre-ischaemic baseline of 19±9% (p=0.04) up to 12.39±1.18 mm Hg·L (time after deflation 45±13 s, lasting for 84±39 s) and of dP/dtmax 15±6% (p=0.07) up to 1877±73 mm Hg/s (time after deflation 35±7 s, lasting for 91±35 s). Total ST-segment resolution occurred within 50 seconds.
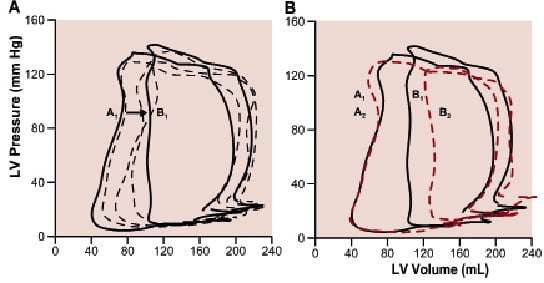
Figure 1. Typical PV-loops during PCI of the LAD. Panel A illustrates a 60 s coronary occlusion (baseline, solid line A1), at 6, 15 and 30 s occlusion (dashed lines) and just before balloon deflation (solid line B1). Panel B illustrates, in the same patient, a more pronounced response to the second (62 s) occlusion (dashed line B2) relative to its baseline (dashed line A2). Note the smaller area of the PV-loop (stroke work) during the second occlusion.
Second balloon inflation
The right panel of Table 2 shows changes in LV dynamics during the second coronary balloon occlusion (90±14 s). Changes occurred in a similar order as during the first occlusion. There was a rightward shift of the PV-loop in all patients. Changes of mainly global (i.e. SV, SW and EA) and systolic (i.e. ESV, EF and EES) LV parameters were more pronounced during the second occlusion. The more pronounced response of LV dynamics including RCE to the second ischaemic period was not different between the LAD and RCA group. Apical RCE after predilatation (Figure 2), was nearly significantly increased compared to before this first balloon inflation (71±3 vs. 63±4%, p=0.05). Figure 1B illustrates a typical patient with a more pronounced shift of the PV-loop, including a smaller SW.
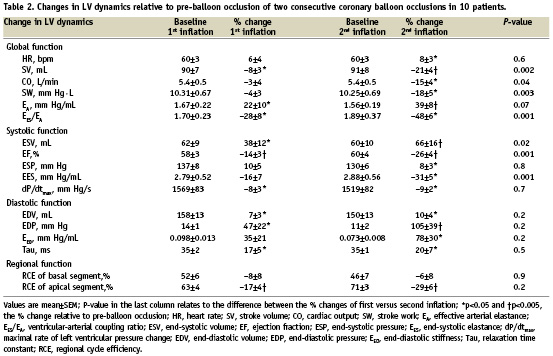
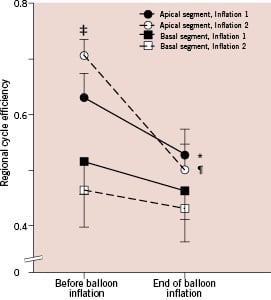
Figure 2. Regional cycle efficiency of the LV, before and during balloon coronary occlusion. Cycle efficiency was higher in the apical segments compared to the basal segments. Apical cycle efficiency showed a 17±4% (*p<0.001) decrease during the first occlusion, and a 29±6% (¶p=0.002) decrease during the second occlusion. Basal cycle efficiency showed no change. Note that apical cycle efficiency before the second occlusion (i.e., after predilatation of the stenosis) was higher than before the first occlusion, 71±3% versus 63±4% (‡p=0.05).
An increased rate of change of LV parameters during the second occlusion is illustrated in Figure 3. On the 12-lead ECG, the summed ST-segment deviation (measured 80 ms after the J-point), was less during the second ischaemic period (10.1±2.1 vs. 6.0±2.0 mm, p=0.02). ECGs were obtained at maximal chest pain (87±13 s).
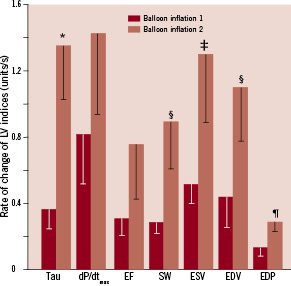
Figure 3. Illustration of the rate of change during ischaemia until the index reaches its half-time value, a 50% change of the maximal effect. Tau (ms); dP/dtmax (0.1·mm Hg/s); EF (–); SW (10·mm Hg·L); ESV (mL); EDV (mL), and EDP (mm Hg). A factor 0.1 was applied to dP/dtmax, and a factor 10 to SW for illustrative purposes. Note that all indices show a higher rate of change during the second balloon inflation compared to the first inflation.*p=0.006, ¶p=0.03, ‡p=0.05, §p<0.08.
The Rentrop class II patient, showed a marked ischaemic response with a rightward shift of the PV-loop, as indicated by the increased ESV (by 36 mL) and EDV (by 20 mL). This time, the particular patient experienced angina requiring balloon deflation after 32 seconds.
The time between balloon inflations (460±68 s, range 207-825 s) did not influence the more pronounced LV responses to the second inflation, when we compared the responses between patients with either a short or a long interval between inflations (data not shown). The range of time in between balloon inflations was mainly PCI-procedure-related. After balloon deflation, LV dynamic parameters fully returned to baseline and followed similar patterns as after the first inflation. Figure 4 illustrates the time course of several LV dynamic indices in a patient during two consecutive LAD occlusions followed by reperfusion.
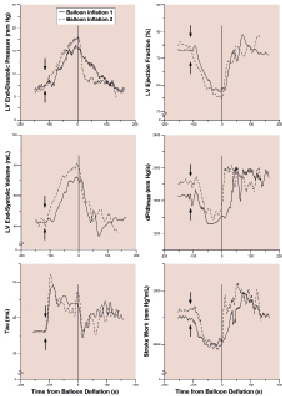
Figure 4. LV dynamic changes during consecutive LAD occlusions for PCI in a typical patient. Note the immediate changes after the onset (arrows) of the first balloon inflation (solid line), and the more pronounced ischaemic response during the second balloon inflation (dashed line). Also note the immediate recovery after deflation (at 0 s on the x-axis).
Discussion
This is the first study in humans to evaluate acute and continuous LV dynamic responses to consecutive coronary balloon occlusions in an elective PCI population with stable angina, by direct online LV pressure and volume measurements. A second coronary occlusion following an initial prolonged occlusion caused a more pronounced negative inotropic response.
Phased response to a prolonged coronary occlusion
We studied the magnitude and timing of LV dynamics in response to prolonged ischaemic bouts. In contrast to previous studies5-7, we chose prolonged balloon occlusions (>90 s) to allow LV indices to stabilise, and continuous assessment of combined LV pressure and conductance-derived volume, instead of LV dimensions at several time points obtained by LV angiograms to provide us detailed information on LV dynamics throughout elective PCI.
Our data show that ischaemia causes an instantaneous decrease in diastolic function as indicated by a prolonged LV relaxation, and suggests a decrease in passive diastolic function as indicated by an increased diastolic stiffness (EED). The increase in EED was mainly driven by the large increase in EDP. Yet, EDV also showed a small increase, which suggests that there was an up and rightward shift of the PV-loop following its nonlinear end-diastolic pressure-volume relation, in line with previous results.5
Contractility decreased during ischaemia as indicated by a decrease in EF, dP/dtmax and EES. Moreover, the increase in ESV could be interpreted as a rightward shift of the end-systolic pressure-volume point19, since ESP remained practically unchanged. Therefore, the rightward shift of the end-systolic pressure-volume relation indicated a decrease in contractility as well.20,21 Furthermore, we demonstrated that the ventricle loses its optimal interaction with the arterial system, as indicated by the decrease of the ventricular-arterial coupling ratio (EES/EA) below the critical value of 1.0. The latter has been used as a threshold value for systolic dysfunction.22 The decrease in contractility (EES) in combination with a maintained peripheral resistance provides an excessive arterial load (i.e. afterload) on the LV, as indicated by the increase in effective arterial elastance (EA).
Coronary occlusion led to a more pronounced decrease in RCE of the apical segment compared to the basal segment, representing a larger decrease in contractile function, which may be attributed to the obstructed perfusion of the LV apex. Assessment of RCE, as a relatively novel parameter of LV contractility, has been applied to identify optimal pacemaker lead positioning for resynchronisation therapy18, but has not been investigated previously during ischaemia. In line with optimal resynchronisation therapy, our findings of ischaemic effects on RCE may be applied to assess LV segmental function recovery after revascularisation therapy for e.g. acute myocardial infarction.
The present study showed that following balloon deflation, the initial recovery phase was a hyperactivity phase, during which there was an increased dP/dtmax and SW, indicating an increased oxygen demand in response to the period of oxygen deprivation by the coronary occlusion. This overshoot phenomenon has been observed in animals23, but to our knowledge, this is the first report in humans.
Repeated ischaemia
The main observation in our study is that the LV shows a more rapid and more pronounced negative inotropic response during repeated ischaemia, which has never been shown in humans, but is in line with experimental studies.8 Our findings may not have been observed during previous clinical studies, because PV-loops were not assessed continuously, and the ischaemic bouts may have been too short.5-7 Moreover, our observations are not in conflict with observations from animal24 and human10,12 studies of LV function measured by other methods, which showed no preserved contractility during repeated ischaemia.
Previous clinical studies showed that brief ischaemic episodes resulted in a reduced ST-segment deviation during repeated ischaemia.11,12 In line with these studies, our study shows a deterioration of LV function during subsequent balloon coronary occlusion notwithstanding less ST-segment shift.
Theoretically, several physiologic mechanisms may be responsible for our findings.
First, the initial coronary occlusion reversibly impairs the LV on cellular level25 and decreases contractile reserve due to energy depletion in analogy to some experimental studies26, and to our findings of a smaller stroke work, i.e. oxygen consumption27, during the second occlusion. Our findings may therefore in fact provide an explanation for the preconditioning phenomenon by limiting energy utilisation. Furthermore, some of the ventricles may already have adapted to less oxygen supply due to coronary artery disease resulting in a hibernating state without alteration of LV contraction, but with an altered contractile reserve during periods of increased demand.
Second, the initial balloon inflation used as predilatation for the stenosis causes de-recruitment of collateral vessels5,28,29 – as observed in one of our RCA patients with Rentrop class II – due to improved coronary perfusion pressure by the dissolved pressure gradient.30 Thus, the myocardium supplied by the previously stenotic but now un-stenotic coronary artery is more subject to ischaemia by a second coronary occlusion.
Limitations
We realise that the term preconditioning was ultimately meant for a reduction of infarct size after repeated ischaemia3, which obviously is not possible to investigate in humans. Nevertheless, we did meet the prerequisite for myocardial preconditioning by using prolonged coronary artery occlusions (90 to 180 s) as used in previous studies.9-11 The explanation of our observation remains to be elucidated, for instance by measuring coronary blood flow and obtaining coronary sinus metabolic samples.
Clinical implications
The present study confirms and extends previous studies by providing further knowledge on ischaemia-induced changes in LV dynamics during repeated coronary balloon occlusion during performance of a PCI, by assessment of online arithmetical and load-independent data from PV-loops. Limiting energy utilisation during repeated ischaemia may be responsible for the preconditioning phenomenon.
Conclusion
In this study, we demonstrated acute LV dynamic responses to prolonged coronary balloon occlusion, with an immediate depression of first diastolic and second systolic function. We found a faster and stronger negative inotropic response to a subsequent ischaemic bout with a concomitant decrease in energy utilisation and a paradoxically decreased ST-segment shift.
Acknowledgements
The authors acknowledge our nursing staff of the cardiac catheterisation laboratory for their skilled assistance with special thanks to W.J. Rohling, RN.
