Abstract
Aims: In the acute coronary syndrome setting, the interaction between epicardial coronary artery stenosis and microcirculation subtended by the culprit vessel is poorly understood. The purpose of the present study was to assess the immediate impact of percutaneous coronary intervention (PCI) on microvascular resistance (MR) in patients with non-ST-elevation myocardial infarction (NSTEMI).
Methods and results: Thirty-eight patients undergoing PCI for NSTEMI were recruited consecutively. Culprit lesions were stented over a Doppler and pressure-sensor-equipped guidewire. In the presence of epicardial stenosis, MR was calculated by taking collateral flow, as measured by the coronary wedge pressure, into consideration. After removal of epicardial stenosis, MR was calculated simply as distal coronary pressure divided by average peak velocity. When collateral flow was incorporated into the calculation, MR increased significantly from 1.70±0.76 to 2.05±0.72 (p=0.001) after PCI in the whole population. Periprocedural changes (Δ) in absolute values of MR and troponin T correlated significantly (r=0.629, p=0.0001). In patients who developed periprocedural myocardial infarction, MR increased significantly after PCI (1.48±0.73 versus 2.28±0.71, p<0.001). Nevertheless, removal of the epicardial lesion did not change MR in patients without periprocedural MI (1.91±0.73 versus 1.81±0.67, p=0.1).
Conclusions: When collateral flow is accounted for, removal of epicardial stenosis increases MR in patients with NSTEMI undergoing PCI.
Introduction
Coronary microvascular dysfunction, as demonstrated by increased microvascular resistance (MR), developing after successful primary percutaneous coronary intervention (PCI) in patients with ST-elevation myocardial infarction (STEMI), is associated with a greater extent of infarction and larger left ventricular volumes1-3. Nevertheless, much less is known about the response of distal microvasculature to PCI in non-ST-elevation myocardial infarction (NSTEMI), which has similar underlying atherothrombotic processes to STEMI. On the other hand, therapeutic targeting of the microvasculature that could improve patient outcome in acute coronary syndromes requires effective and accurate assessment of microvascular function. Fortunately, identification of even a subtle alteration in distal microvascular circulation that may develop after PCI is possible by assessment of coronary MR4. However, controversy exists as to whether MR is affected by PCI and by the haemodynamic severity of epicardial stenosis.
Potential consequences of the removal of epicardial stenosis on the microcirculation subtended by the revascularised coronary artery remain poorly understood. In a previous study, in which collateral flow was not taken into consideration during calculation of MR, a significant decrease in MR was shown following removal of epicardial stenosis5. In those initial studies, it was also shown that MR is increased by the increasing severity of epicardial stenosis5-7. By contrast, two experimental studies, in which coronary stenosis was created artificially by balloon inflation, demonstrated that MR was constant in the presence of different degrees of coronary stenosis when collateral flow was taken into consideration8,9. Concordantly, in two very recent clinical studies, MR was demonstrated to be independent of functional epicardial stenosis severity when collateral flow, which could minimise the impact of epicardial stenosis on MR, was taken into account10,11. Nevertheless, both of these two recent clinical studies either excluded patients who developed periprocedural myocardial infarction or did not include unstable lesions. Therefore, the impact of periprocedural myonecrosis on MR and the relationship between unstable epicardial lesions and the microcirculation remain to be elucidated.
In this study, we hypothesised that unstable epicardial lesions possess different features which may lead to different responses in the distal microcirculation after PCI. To test this hypothesis, the current study examined the immediate impact of mechanical removal of unstable epicardial lesions on microvascular resistance determined by taking collateral flow into account in patients who presented with NSTEMI.
Methods
PATIENT POPULATION
Forty-three patients presenting with NSTEMI and undergoing PCI for a single culprit lesion in a coronary artery within 48 hours after admission were enrolled in the study. Diagnosis was based on the new ST-segment depression >0.1 mm, T-wave inversion of 0.4 mm in at least two leads, or symptoms consistent with acute myocardial infarction and the presentation of elevated levels of troponin T (TnT) (>0.1 ng/mL). All patients received a 600 mg loading dose of clopidogrel and aspirin at admission. Between admission and PCI, all patients received low molecular weight heparin. All patients underwent successful bare metal stent implantation. The study was conducted in accordance with the Declaration of Helsinki, and our hospital ethics committee approved the study protocol. Written informed consent was obtained from all patients.
STUDY PROTOCOL
Patients underwent invasive evaluation of microvascular function and PCI on average 20±4 hours following admission. TnT values were collected at admission and every four hours thereafter. The patients underwent PCI after troponin levels descended from peak and showed a relatively stable trend at the last two measurements. Troponin values were also collected immediately and six hours after completion of PCI. Periprocedural change (Δ) in the absolute amount of troponin T was calculated as the post-PCI troponin T value at six hours minus the pre-PCI troponin T value. Periprocedural myocardial infarction was defined as a 20% increase of TnT following PCI12. After administration of 5,000 U heparin and 0.2 mg intracoronary nitroglycerine, reference angiographic images were obtained. Culprit lesions were identified mainly by their angiographic morphology in conjunction with ECG findings. Angiographically, culprit lesions were defined as a significant complex lesion with irregular edges, abrupt shoulders, ulcerations, and/or filling defects at or distal to the lesion indicating coronary thrombus. Lesion eccentricity was also considered as a criterion. Corresponding significant ST-segment depression and/or T wave inversion localised at relevant leads in ECG was also considered to be helpful in identifying the culprit artery.
For assessment of epicardial and microvascular haemodynamics, a Doppler and pressure-sensor-equipped guidewire (ComboWire® XT; Volcano Therapeutics, Rancho Cordova, CA, USA) was advanced across the stenosis. This dual-sensor guidewire has a Doppler crystal at the tip and a pressure sensor at 1.5 cm from the tip. Intracoronary pressure and flow were measured simultaneously using this dual-sensor-equipped guidewire, which was manipulated until an optimal and stable blood flow velocity signal was obtained, distal to the lesion. Aortic pressure (Pa) was obtained from the guiding catheter, and distal coronary pressure (Pd) and average peak flow velocity (APV) were measured with the dual-sensor guidewire. All haemodynamic signals were obtained at baseline and during maximum hyperaemia induced by a bolus of intracoronary papaverine, 15 mg for the right coronary artery and 20 mg for the left coronary artery. After obtaining pre-PCI measurements, PCI was performed over the ComboWire (Figure 1). During balloon occlusion (30 seconds), distal pressure was recorded as coronary wedge pressure (Pw). All haemodynamic measurements were repeated after PCI.
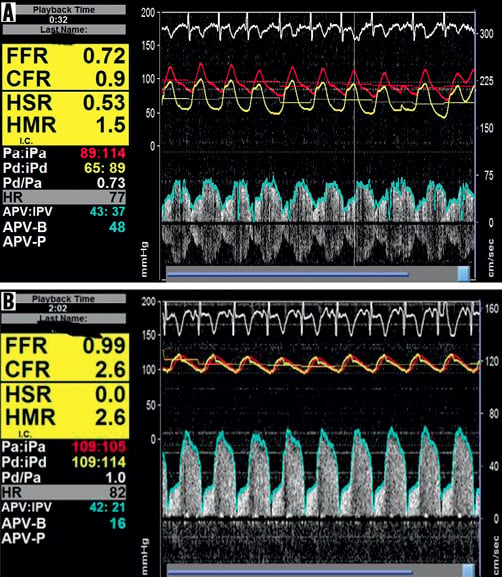
Figure 1. Changes in intracoronary haemodynamic parameters following PCI. A) Intracoronary haemodynamic measurements in the presence of an epicardial stenosis. FFR=0.72, h-SR=0.53, CFR=0.9 and MR=1.5; B) Intracoronary haemodynamic measurements after removing an epicardial stenosis. FFR=0.99, h-SR=0, CFR=2.6 and MR=2.6.
ANALYSIS OF HAEMODYNAMIC MEASUREMENTS
All haemodynamic measurements were recorded on a suitable interface (ComboMap®; Volcano Therapeutics, Rancho Cordova, CA, USA) and analysed off-line. Fractional flow reserve (FFR) was calculated as the ratio of mean distal to mean aortic pressure during maximum hyperaemia. Coronary flow reserve (CFR) was calculated as the ratio of hyperaemic to baseline APV. A velocity-based index of coronary stenosis resistance during hyperaemia (h-SR) was calculated as mean stenosis pressure gradient (Pa-Pd) divided by APV. Reliable calculation of MR in the presence of an epicardial stenosis requires incorporation of collateral flow, as measurable by the coronary wedge pressure (Pw), into the equation. Therefore, pre-PCI MR (mmHg·cm–1·s–1) was calculated at maximal hyperaemia by taking Pw into account as follows: Pa (1/APV) [(Pd-Pw)/(Pa-Pw)]. Since APV is perfectly correlated with the inverse of mean transit time (Tmn)9, (1/APV) was substituted instead of Tmn in the original formula, which was proposed by Aarnoudse et al8. Since myocardial flow is equal to coronary flow in the absence of epicardial stenosis, post-PCI MR was calculated during maximal hyperaemia simply as Pd divided by APV (Pd/APV). All haemodynamic indices of microvascular perfusion were determined before and after PCI. Periprocedural changes (difference between pre-PCI and post-PCI values=Δ) in intracoronary haemodynamic parameters have been calculated as an absolute number and as a percentage.
STATISTICAL ANALYSIS
Statistical tests were performed with the Statistical Package for the Social Sciences version 17.0 (SPSS Inc., Chicago, IL, USA). Continuous variables were expressed as mean±standard deviation. Categorical data were expressed as numbers or frequencies and compared using the chi-square test. Haemodynamic measurements performed at each step were compared using a paired sample t-test. Group means were compared by Student’s t-test for independent groups. Pearson correlation and linear regression analysis was used where appropriate. Significance was accepted at p<0.05.
Results
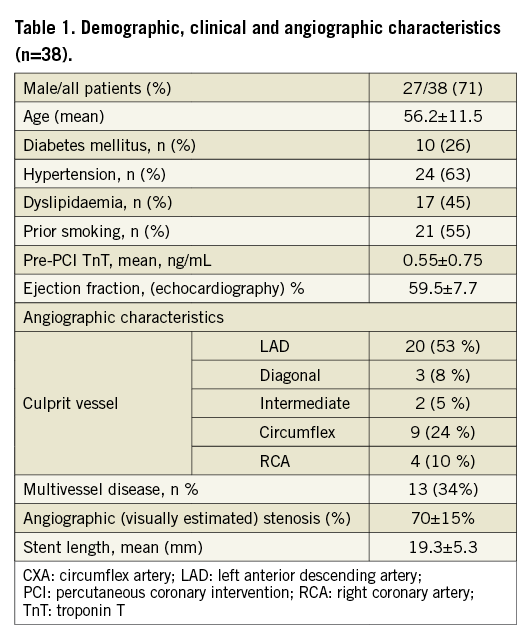
During the procedure, reliable and stable intracoronary Doppler signals could not be obtained in five patients. Therefore, the remaining 38 patients, in whom we were able to obtain stable and reliable intracoronary Doppler and pressure signals, constituted the final study population. The baseline clinical and angiographic characteristics are listed in Table 1. Most of the patients (66%) had single-vessel disease and culprit lesions were predominantly located in the LAD (53%).
HAEMODYNAMIC OUTCOMES AND RELATIONSHIP WITH MYONECROSIS
After PCI, coronary flow velocities and distal coronary pressures improved significantly. As expected, FFR (FFR pre-PCI 0.64±0.14 versus FFR post-PCI 0.94±0.05, p<0.001) and CFR (CFR pre-PCI 1.32±0.36 versus CFR post-PCI 1.67±0.4, p=0.001) increased and h-SR (h-SR pre-PCI 1.79±1.31 versus h-SR post PCI 0.11±0.10, p<0.001) decreased significantly following PCI (Table 2). On the other hand, MR increased significantly by 20% (from 1.70±0.76 mmHg·cm–1·s–1 to 2.05±0.72 mmHg·cm–1·s–1, p=0.001) after removal of epicardial stenosis (Figure 2). Average Pw was 30.5±11.5 mmHg (range: 14-44 mmHg).
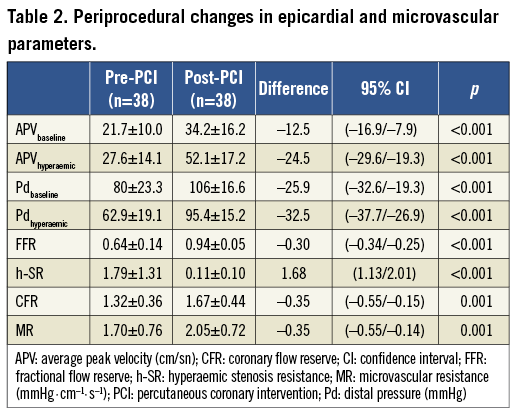
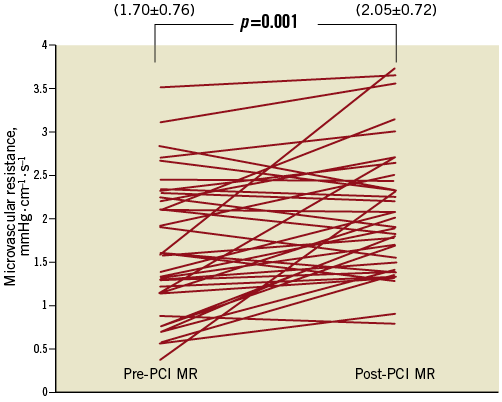
Figure 2. Periprocedural changes in microvascular resistance. Pre-PCI MR: pre-percutaneous coronary intervention microvascular resistance; Post-PCI MR: post-percutaneous coronary intervention microvascular resistance
Pre-PCI MR showed no correlation either with stenosis resistance (r=0.082, p=0.626) (Figure 3A) or with fractional flow reserve (r=0.19, p=0.39). Additionally, there was no correlation between periprocedural changes (Δ) in absolute amounts of MR and Δ FFR (r=0.054, p=0.74).
On the other hand, when pre-PCI MR was calculated simply as the ratio of mean hyperaemic distal pressure to mean hyperaemic average peak velocity without taking coronary wedge pressure into account (MRuncorrected), it was seen that the average pre-PCI MR was substantially overestimated (by 50%) (MRuncorrected= 2.56±1.03 mmHg ·cm–1·s–1 vs. MRcorrected= 1.70±0.82 mmHg·cm–1·s–1). It is obvious that, if correction in calculation of MR by incorporating collateral flow in the formula was not done, this initial overestimation of pre-PCI MR would lead to the paradoxical conclusion that PCI reduces MR (from 2.56±1.03 mmHg·cm–1·s–1 [MRuncorrected] to 2.05±0.72 mmHg·cm–1·s–1 [post-PCI MR], p=0.01). In addition to these findings, MRuncorrected correlated with h-SR (r=0.417, p=0.009) (Figure 3B) and pre-PCI FFR (r=0.34, p=0.021).
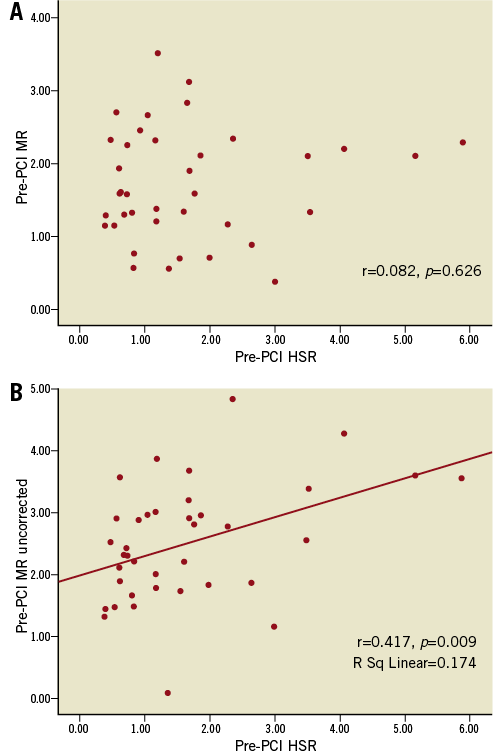
Figure 3. Relations between pre-PCI microvascular resistance (mmHg·cm–1·s–1) and hyperaemic stenosis resistance. A) Relationship between pre-PCI MR (corrected for collateral flow) and hyperaemic stenosis resistance; B) Relationship between pre-PCI MR (uncorrected) and hyperaemic stenosis resistance
ΔMR correlated with Δ troponin T (r=0.629, p=0.0001) (Figure 4) and post-procedural troponin T values (r=0.395, p=0.018). Nineteen patients developed periprocedural myocardial infarction as determined by >20% increase in TnT following PCI. The periprocedural increase in MR was significantly higher in patients with periprocedural myocardial infarction compared to those without (Table 3). Furthermore, removal of the epicardial lesion did not change MR in the group of patients in whom periprocedural MI did not occur. On the other hand, MR increased significantly after PCI in patients who developed periprocedural MI (Figure 5).
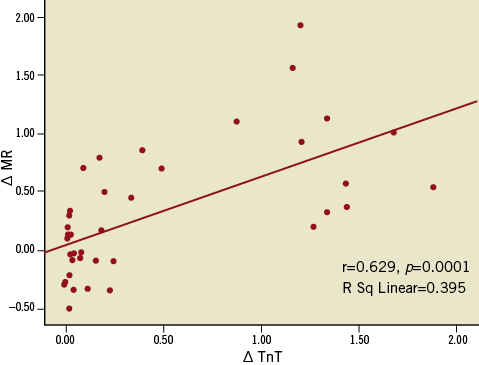
Figure 4. Relationship between periprocedural changes in microvascular resistance (mmHg·cm–1·s–1) and troponin T values. Delta MR: periprocedural change (difference between pre-PCI and post-PCI) in absolute amount of microvascular resistance; delta TnT: periprocedural change in absolute amount of troponin T.
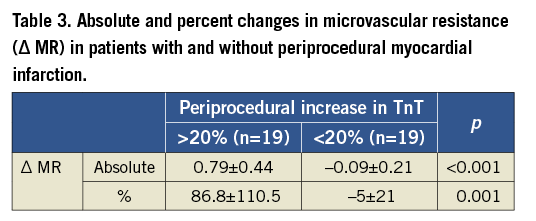
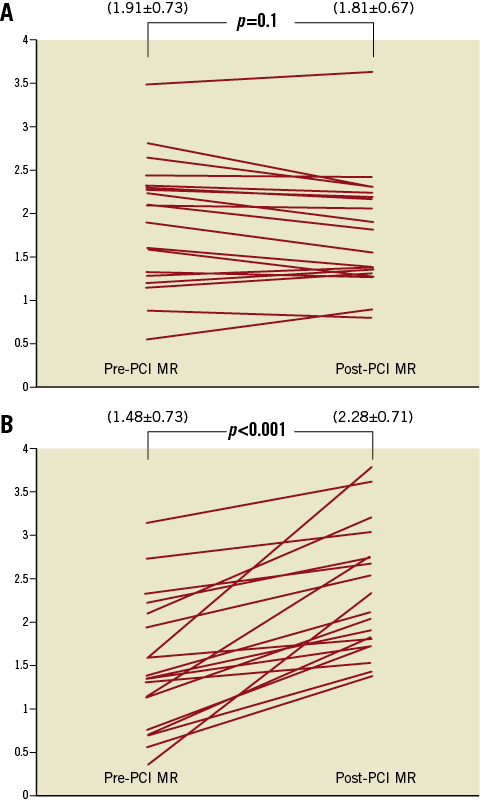
Figure 5. Comparisons of periprocedural changes in microvascular resistance (MR) in patients with and without periprocedural myocardial infarction (MI). A) Change in MR (mmHg·cm–1·s–1) in patients without periprocedural MI; B) Change in MR (mmHg·cm–1·s–1) in patients with periprocedural MI
Discussion
The results of our study indicate that removal of unstable epicardial lesions lead to an increase in microvascular resistance in patients presenting with NSTEMI undergoing PCI. This periprocedural increase in MR, which was accompanied by periprocedural elevation in the marker of myonecrosis, occurred particularly in patients who developed periprocedural myocardial infarction. Furthermore, our findings suggest that microvascular resistance, when calculated properly by taking collateral flow into account, was not influenced by the haemodynamic significance of the epicardial stenosis even if the stenotic lesion had unstable characteristics.
In order to diagnose and treat microvascular injury effectively, a better understanding of the interactions between epicardial lesion and microcirculation is necessary. There are only a few reports which have examined changes in MR after elective PCI. Nevertheless, there are no data about alteration of MR following PCI in the setting of NSTEMI where changes in microvascular tone are very dynamic. Findings from an invasive study which evaluated the impact of PCI on MR by using Doppler and pressure-sensor-equipped guidewires in stable patients suggested that PCI may lead to a decrease not only in epicardial stenosis resistance but also, surprisingly, in MR5. In the aforementioned study, MR was calculated in its simplest form as the ratio of hyperaemic distal pressure to hyperaemic distal average peak flow velocity both in the presence and after the removal of epicardial stenosis. Although this formula is reasonable in the absence of epicardial stenosis, reliable calculation of MR in the presence of an epicardial stenosis requires incorporation of collateral flow (as measurable by the coronary wedge pressure) into the equation8. If collateral flow, which may increase with the increasing severity of a stenosis, was not incorporated into the equation, myocardial blood flow would be underestimated and therefore microvascular resistance would be overestimated. As can be appreciated from our results, if pre-PCI MR was calculated without taking coronary wedge pressure into account, it would be consistently and substantially overestimated (by 50%). Because of this initial overestimation, it would appear that removing an epicardial stenosis may decrease post-PCI MR. This paradoxical decrease in uncorrected MR (which did not incorporate collateral flow) following PCI was also observed in our study. Indeed, in the current study, a decrease in epicardial resistance (h-SR) achieved by PCI was accompanied by a significant increase in MRcorrected (by 20%). Two very recent studies10,11, concordantly showed that pre-PCI and post-PCI MR values did not differ significantly in patients undergoing PCI. Nevertheless, unlike our study, both of these two studies recruited patients with stable angina and excluded patients who developed periprocedural myocardial infarction. On the contrary, the current study included only patients with NSTEMI, and half of the patients developed periprocedural myocardial infarction. In this different patient population, we observed a significant increase in post-PCI MR values, which was also associated with a rise in troponin T after PCI. In particular, a significant increase in MR after PCI was observed in the group of patients in whom periprocedural MI developed. However, in patients who did not have periprocedural MI, MR did not change periprocedurally. It is known that unstable target lesions causing acute coronary syndromes are fragile and prone to embolise distally, and this may lead to periprocedural MI during PCI. However, the impact of periprocedural myocardial infarction on MR has not been documented so far. In the current study, periprocedural microvascular injury, which was possibly caused by PCI-induced distal embolisation and/or vasoconstriction, may consequently have led to myonecrosis. Since MR reflects the total coronary vascular conductance capacity and thus the cross-sectional area of the coronary vasculature, a significant increase in periprocedural values of MR could only occur in patients who developed significant periprocedural myonecrosis as observed in the current study.
It has previously been demonstrated that post-procedural troponin elevation directly represents the extent of irreversible myocardial injury and is also associated with impaired tissue-level perfusion and adverse outcome in patients with NSTEMI treated with PCI13,14. In addition, a recent magnetic resonance imaging study showed that microvascular obstruction is a common finding and correlates with troponin release and infarct extent in NSTEMI patients undergoing PCI15. These above-mentioned studies concordantly confirm that the clinical consequences and frequency of microvascular dysfunction which develop after PCI in patients with NSTEMI are similar to those which have been observed in the setting of STEMI. Thus, it is obvious that protecting microvascular integrity in patients with NSTEMI undergoing PCI is pivotal. In our study, since increased MR after PCI indicates further microvascular dysfunction, any preventive measures or therapeutic approach to avoid microvascular damage should be considered in the NSTEMI population as well. One step ahead, identification of the lesion, which has a potential to embolise distally and develop myonecrosis after PCI, may facilitate tailoring of interventional therapy, such as using distal protection devices or avoiding predilatation. Taken together, these findings are pathophysiologically and clinically relevant for an appreciation of the role of the microvasculature in determining outcomes of patients presenting with NSTEMI.
Our results also indicated that there were no correlations between pre-procedural MR and both h-SR and FFR. This independence of microvascular resistance from the haemodynamic significance of an epicardial lesion was in line with the findings of recent reports where MR was shown not to be influenced by the severity of epicardial stenosis10,11. Additionally, mean pre-PCI MR value (1.70±0.76 mmHg·cm–1·s–1) found in this study was similar to the mean value of MR (1.73±0.38 mmHg·cm–1·s–1) found in the reference vessel (without any epicardial lesion) in a previous study in which microvascular resistance was calculated by Doppler-derived index5. Although previous studies, which did not incorporate collateral flow into the calculation of MR, suggested that MR was influenced by epicardial stenosis severity5,6,18, recent studies, which took collateral flow into account, concordantly demonstrated that MR was not affected by the haemodynamic significance of the epicardial lesion10,11. In the current study, however, we measured coronary flow velocities directly instead of using derived indices such as mean transit times and we took collateral flow into consideration while calculating MR and showed that MR was not affected by the functional significance of epicardial lesions in acute coronary syndrome settings.Therefore, our findings extend the previous results by providing confirmation that: 1) MR is not affected by epicardial lesion severity in patients with acute coronary syndromes; and 2) although MR did not change after the removal of an epicardial stenosis within an individual who did not develop periprocedural MI, it increased significantly after PCI in those with periprocedural MI.
Study limitations
The present study has some methodological limitations. First, we did not measure central venous pressure. Theoretically, if central venous pressure is significantly elevated, it might affect the calculation of MR. Nevertheless, we assumed that the value of central venous pressure was zero in our patients. Second, vascular volume and epicardial coronary artery diameter remained constant during the study, which was controlled by prior administration of intracoronary nitroglycerine. Third, although we showed a potential causal relationship between an increase in microvascular resistance and troponin release after PCI, we cannot be sure of the exact mechanism of myonecrosis. Owing to the fact that we did not use a Doppler guidewire and its software (FloMap; Volcano Therapeutics), which allows lowering of the intensity threshold for Doppler signals to a minimum, we were not able to detect the embolised particles during PCI as high-intensity transient signals, which would have been useful to explain the reasons for an increase in MR and troponin values after PCI. On the other hand, this would have required the simultaneous use of two guidewires (pressure and Doppler), which would have complicated the procedure. Fourth, since we measured intracoronary flow velocities directly instead of measuring mean transit time and incorporated 1/average peak velocity in the formula instead of mean transit time, the formula we proposed in the current study for calculation of pre-PCI MR may seem to be unfamiliar. Nevertheless, it is known that average peak velocity is perfectly correlated with the inverse of mean transit time7 and, more importantly, measuring of coronary velocity directly instead of using a derived index, such as mean transit time, allows more direct measurement of microvascular resistance. Lastly, it has been demonstrated previously that alpha-adrenergic tone is enhanced in patients with acute coronary syndrome, which might prevent achievement of full hyperaemic response17,19. Therefore, it cannot be excluded that some of the changes in MR might be attributed to insufficient hyperaemic response.
Conclusions
When collateral flow is appropriately accounted for, Doppler-derived microvascular resistance is independent from the haemodynamic significance of an epicardial lesion in patients with NSTEMI. Following elimination of epicardial resistance by PCI, microvascular resistance increases in patients with NSTEMI in whom periprocedural myocardial infarction developed after the procedure.
Funding
This study was funded by the Turkish Academy of Sciences (Dr Murat Sezer).
Conflict of interest statement
The authors have no conflicts of interest to declare.