Abstract
Aims: Restoration of effective myocardial reperfusion by primary percutaneous coronary intervention (PPCI) in patients with ST-elevation myocardial infarction is difficult to predict. A method to assess the likelihood of a suboptimal response to conventional pharmacomechanical therapies could be beneficial. We aimed to derive and validate a scoring system that can be used acutely at the time of coronary reopening to predict the likelihood of downstream microvascular impairment in patients with STEMI.
Methods and results: A score estimating the risk of post-procedural microvascular injury defined by an index of microcirculatory resistance (IMR) >40 was initially derived in a cohort of 85 STEMI patients (derivation cohort). This score was then tested and validated in three further cohorts of patients (retrospective [30 patients], prospective [42 patients] and external [29 patients]). The ATI score (age [>50=1]; pre-stenting IMR [>40 and <100=1; ≥100=2]; thrombus score [4=1; 5=3]) was highly predictive of a post-stenting IMR >40 in all four cohorts (AUC: 0.87; p<0.001-derivation cohort, 0.84; p=0.002-retrospective cohort, 0.92; p<0.001-prospective cohort and 0.81; p=0.006-external cohort). In the whole population, an ATI score ≥4 presented a 95.1% risk of final IMR >40, while no cases of final IMR >40 occurred in the presence of an ATI score <2.
Conclusions: The ATI score appears to be a promising tool capable of identifying patients during PPCI who are at the highest risk of coronary microvascular impairment following revascularisation. This procedural risk stratification has a number of potential research and clinical applications and warrants further investigation.
Introduction
Prompt revascularisation using primary percutaneous coronary intervention (PPCI) has reduced in-hospital and six-month mortality for patients with ST-elevation myocardial infarction (STEMI)1. However, even prompt opening of the epicardial coronary artery may not restore optimal myocardial reperfusion in the infarcted territory2. This condition, referred to as slow flow or no-reflow, is a reflection of residual coronary microvascular injury. Patients who experience no-reflow are likely to have a larger infarct size3, an increased risk of reinfarction and/or heart failure, and a higher in-hospital and long-term mortality rate3-5.
The index of microcirculatory resistance (IMR) is a parameter that is readily measurable in the catheterisation laboratory during the revascularisation procedure. Theoretically, measured IMR can be influenced by a residual epicardial stenosis and will not reflect the true microvascular resistance unless collateral flow is taken into account. However, there is a very strong observed correlation between wedge pressure-corrected IMR and measured IMR in patients with STEMI6. IMR reproducibly reflects the status of coronary microvasculature when measured at the end of PPCI and predicts the final infarct size and extent of microvascular obstruction observed by cardiac magnetic resonance imaging (MRI)7. A post-procedural IMR >40 predicts mortality and/or readmission for heart failure at one year post PPCI8.
Measuring the IMR before stent implantation in STEMI patients documents the heterogeneity of the coronary microvasculature status and how it changes during the procedure. IMR usually falls with improved coronary flow after stent deployment6 during STEMI but, in some patients (especially those with a high thrombotic burden), stent implantation results in an increase in IMR. Understanding these changes and identifying which STEMI patients are at risk of a persistent elevation of IMR >40 despite (or potentially because of) stenting would allow identification of an especially high-risk target population at the time of the emergency revascularisation procedure.
We aimed to derive and validate a simple risk score to predict a final IMR value greater than 40, in a large population of STEMI patients. This would allow identification during treatment in the catheterisation laboratory of high-risk patients who could benefit from additional or alternative therapeutic strategies.
Methods
DERIVATION OF A SIMPLE RISK SCORE
The score was derived from a group of 85 consecutive eligible consenting STEMI patients admitted for PPCI to the Oxford Heart Centre from October 2010 to October 2014 (derivation cohort) who had been recruited as part of the Oxford Acute Myocardial Infarction (Ox-AMI) study (REC number 10/H0408/24). The methods and data relating to this cohort have been published recently6.
Briefly, patients admitted with a diagnosis of STEMI, defined as the occurrence of ongoing chest pain for at least 30 minutes associated with ST-segment elevation 2 mm in at least two contiguous leads, were included. All patients underwent PPCI with stent implantation. Decisions about direct stenting technique, thrombectomy and glycoprotein (GP) IIb/IIIa inhibitor adoption were left to operator discretion. All patients were loaded with aspirin 300 mg and clopidogrel 600 mg or ticagrelor 180 mg. Weight-adjusted unfractionated heparin or bivalirudin was administered.
Angiographic thrombus burden was graded from 0 to 5 by a previously described thrombus score9. Pre-PPCI and final coronary flow were graded using standard TIMI criteria10. Myocardial blush grade (MBG) at the end of the procedure was evaluated according to van’ t Hof et al11. Infarct size was quantified as troponin peak and by troponin area under the curve (AUC)12.
In all patients, IMR was measured before (i.e., after thrombus aspiration and/or predilation, whenever performed) and after stenting, as previously described, with thermodilution using a pressure wire (Pressure Wire™ Certus™; St. Jude Medical, St. Paul, MN, USA)6.
Score derivation and validation were performed in line with the published TRIPOD statement for transparent reporting of a multivariable prediction model for individual prognosis or diagnosis13,14. For the identification of variables to be included in the scoring system we used those factors already reported to be predictors of a final IMR greater than 40 on univariable and multivariable analysis (Table 1)6. Briefly, pre-stenting IMR and thrombus score were independent predictors of final IMR greater than 40 at the multivariable analysis, while age and pain to wire time were only significant at the univariable level6. Pain to wire time was not included in the score as it was significantly related to pre-stenting IMR6. This avoided an overweighting of pre-stenting IMR from an indirect “double counting” if pain to wire time was included. The final score included only age, thrombus score and pre-stenting IMR (ATI score).
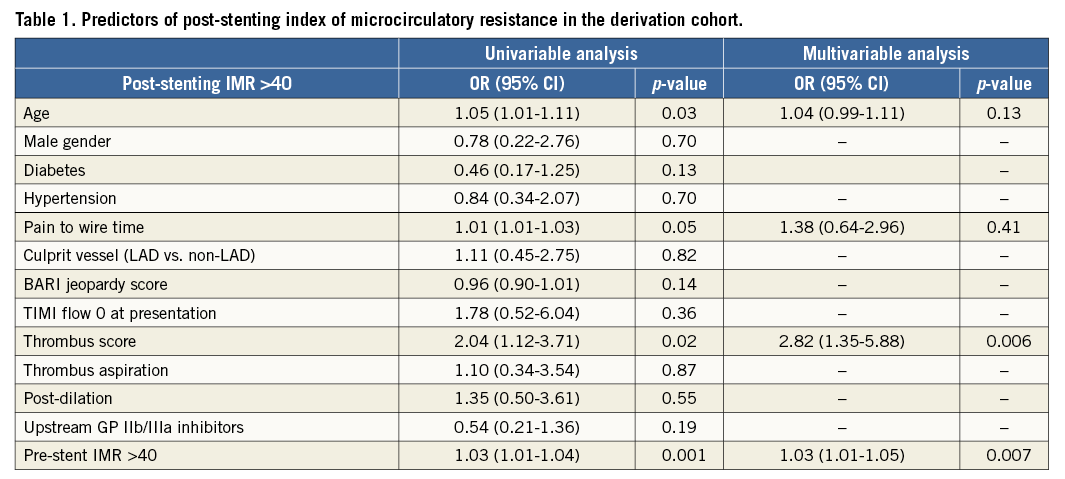
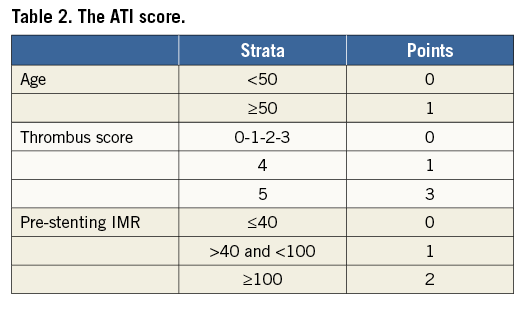
Odds ratios obtained from the univariable and multivariable analysis were used to identify the weight to give to each of the three selected variables, approximating to the nearest integer number. Age at the univariable analysis presented an odds ratio of 1.05 (1.01-1.11) and a weighting score of 1 was allocated. Thrombus score presented an odds ratio of 2.82 (1.35-5.88) and a maximum weight of 3 was given. Finally, pre-stenting IMR with an odds ratio of 1.03 (1.01-1.05) at the multivariable analysis was attributed a weight of 2 as, unlike age, pre-stenting IMR was a predictor of final IMR at both the univariable and multivariable analysis.
Scatter plots were used to assess the distribution of final IMR values, stratified according to each of the three variables included in the ATI score. Cut-offs to categorise each variable were identified by selecting those values associated to a rate of false negative <20% for the lower cut-off value and a rate of false positive <20% for the upper cut-off value.
Since presenting a weight of 1, age was dichotomised at 50 years old (false negative rate: 20%). Since presenting a weight of 2 and 3 respectively, two cut-offs (lower and upper) and consequently three strata were identified for pre-stenting IMR and thrombus score, respectively. Thrombus score was categorised into three strata according to thrombus score less than 4 (false negative rate 19.2%) and thrombus score greater than 4 (false positive rate 0%). A lower cut-off of 40 (false negative rate 17.6%) and an upper cut-off of 100 (false positive rate 20%) were identified for pre-stenting IMR.
The ATI score was calculated by summing the points cumulated for each variable as reported in Table 2.
VALIDATION OF ATI SCORE
The predictive value of the score was estimated by interval based upon the derivation cohort of 85 patients and then by external validation on three independent cohorts of patients. Validation was performed on: 1) a retrospective cohort of 30 patients recruited in Oxford before October 2010 (retrospective cohort); 2) a prospective cohort of 42 patients recruited in Oxford from January 2015 to October 2015 (prospective cohort); 3) an external independent cohort of 29 STEMI patients treated at the Erasmus MC Thoraxcenter in Rotterdam (10 patients) and at the Azienda Ospedaliero-Universitaria S. Anna in Ferrara (19 patients) from April 2011 to June 2014 (external cohort).
Procedural and recruitment methods already described for the derivation cohort also applied to the other three cohorts of patients.
The observed final IMR values were stratified according to the ATI score in each cohort, and receiver operating characteristic (ROC) curves for detection of final IMR value greater than 40 were plotted for each cohort. The scoring system was then re-validated on the whole population.
Statistical analysis
All variables were expressed as mean and (±) standard deviation (SD) or as median accompanied by interquartile range (IQR), as appropriate. Normal distribution of continuous variables was verified by the Shapiro-Wilk test. Frequency comparisons were made using the chi-square test or Fisher’s exact test, as appropriate. Comparisons between continuous variables were performed by t-test or ANOVA, as appropriate, if normally distributed. Mann Whitney or Kruskal-Wallis tests were adopted in case of non-normally distributed variables. ROC curves were compared using the DeLong method. Statistical analysis was performed using SPSS, Version 22.0 (IBM Corp., Armonk, NY, USA) and MedCalc 13.2.1.0 (MedCalc Software, Ostend, Belgium). P-values <0.05 were considered statistically significant.
Results
CLINICAL AND PROCEDURAL CHARACTERISTICS
Clinical and procedural characteristics of patients included in the analysis are summarised in Table 3. The cardiovascular risk profile was comparable in the four cohorts, with the sole exception of diabetes, which was more frequent in the derivation cohort (35.6%, p=0.001).
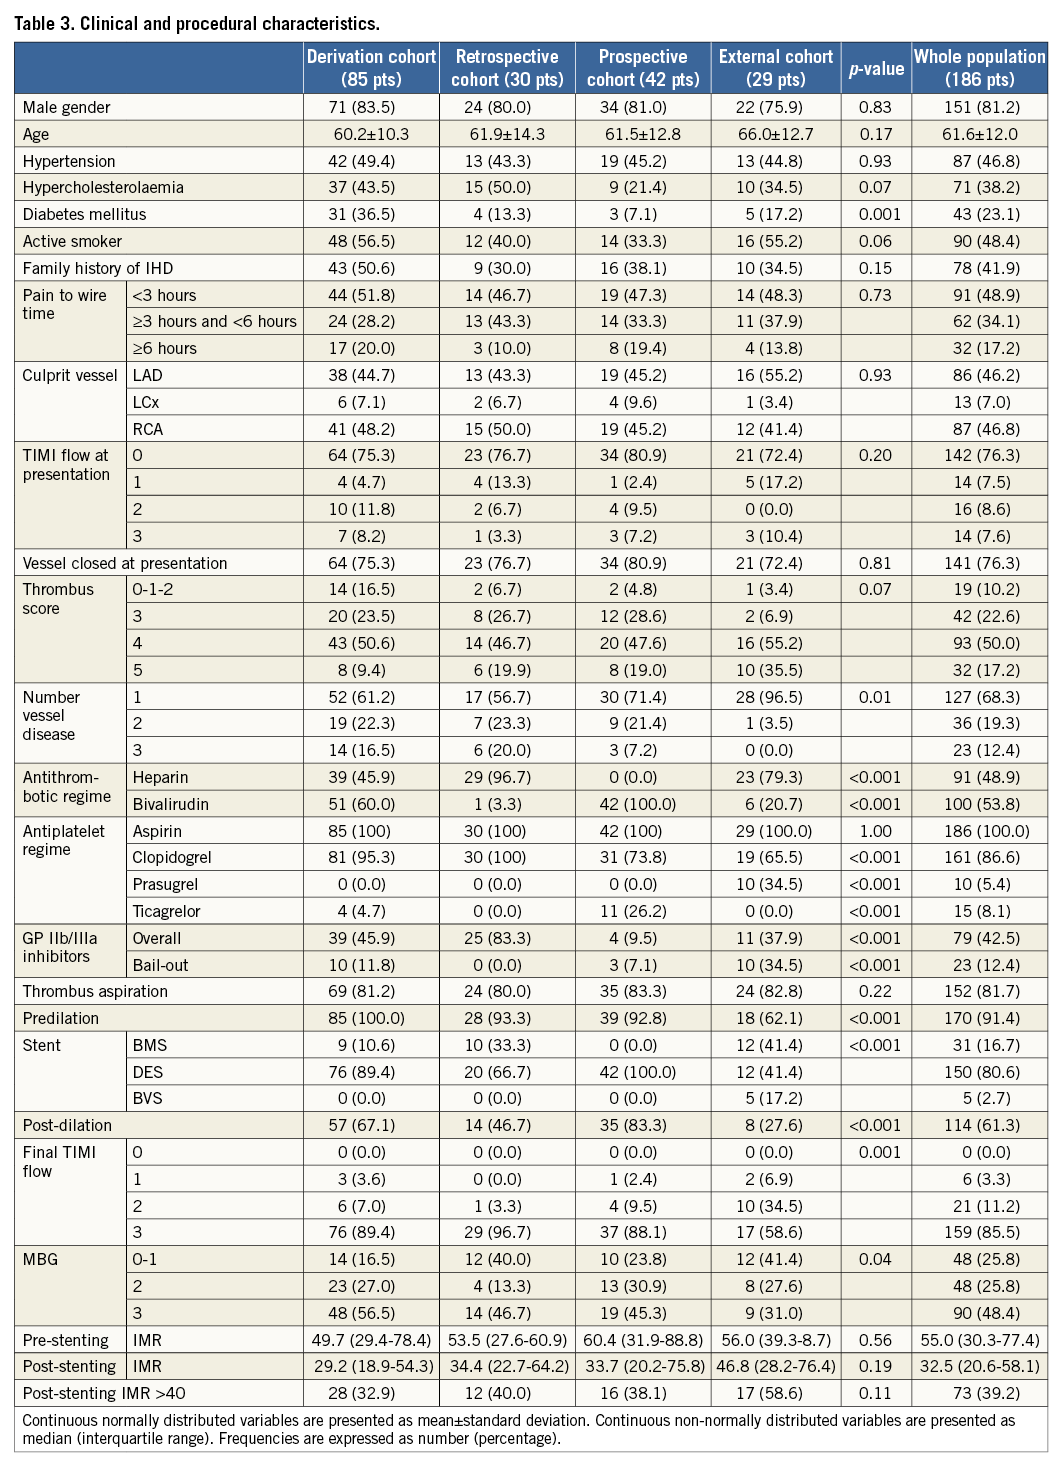
The external cohort differed from the other three groups of patients in terms of rate of direct stenting and post-dilation, reflecting a different attitude towards these two techniques among the three centres. Similarly, a higher rate of TIMI flow <3 (p<0.001) and MBG <3 (p=0.04) was observed in the external cohort compared to the other groups.
Interestingly, a significantly lower rate of drug-eluting stent (DES) and bivalirudin use was recorded in both the external and the retrospective cohorts compared to the more recently recruited patients of the derivation and prospective cohorts.
ATI SCORE PERFORMANCES IN THE FOUR COHORTS
When final IMR values were stratified by ATI score, no cases of final IMR >40 were detected when the score was less than 2, but all patients with an ATI score greater than 4 presented a final IMR value greater than 40. This observation was consistent across the four cohorts (Figure 1).
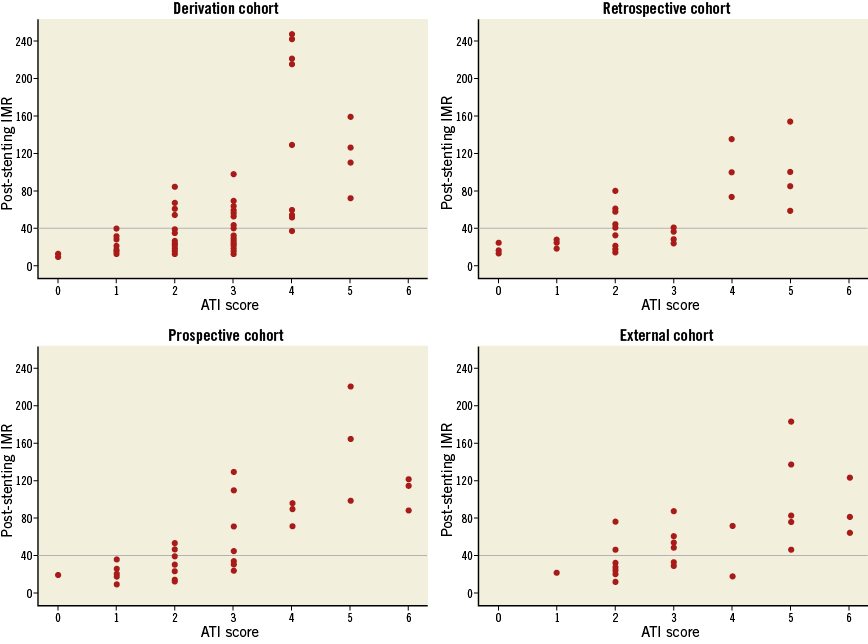
Figure 1. Stratification of the post-stenting IMR values according to the ATI score classes in the derivation and validation cohorts. Scatter plots report the distribution of post-stenting IMR values stratified according to the ATI score.
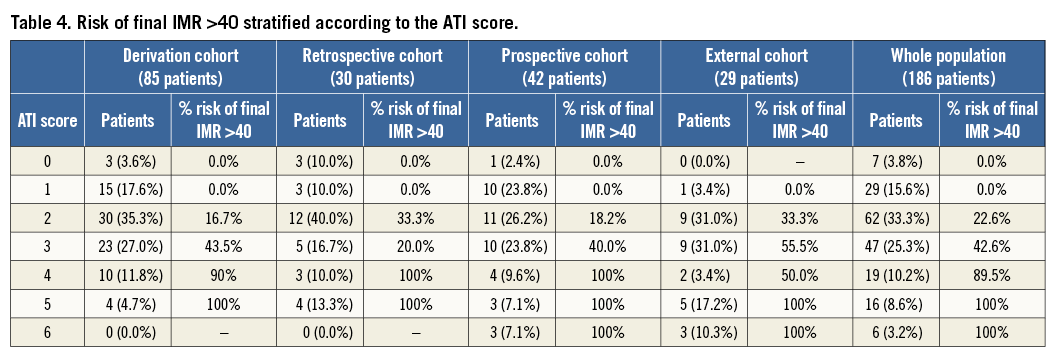
The risk of final IMR greater than 40 associated with each class of ATI score is reported in Table 4.
The predictive accuracy of the score in detecting final IMR >40 was confirmed by the ROC curves analysis. The ATI score presented an AUC of 0.87 (95% CI: 0.79-0.95, p<0.001) in the derivation cohort, 0.84 (95% CI: 0.70-0.99; p=0.002) in the retrospective cohort, 0.92 (95% CI: 0.84-1.00; p<0.001) in the prospective cohort and 0.81 (95% CI: 0.65-0.96; p=0.006) in the external cohort (Figure 2).
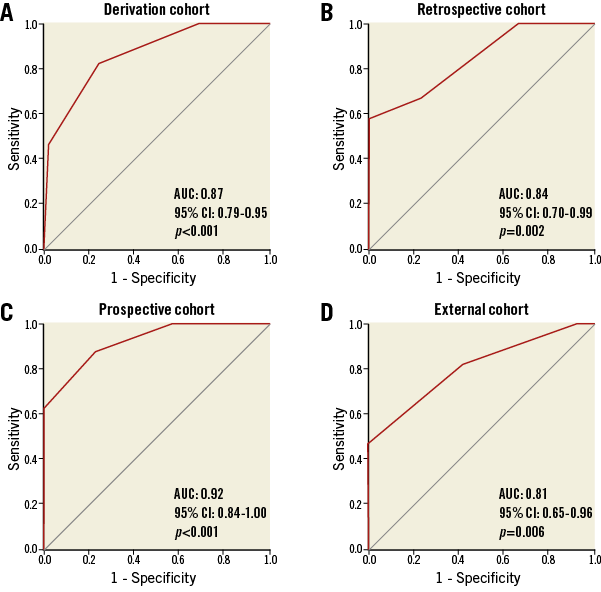
Figure 2. ROC curves for the predictive value of the ATI score in the four cohorts.
ATI SCORE PERFORMANCES IN THE POOLED POPULATION
Initially, the multivariable analysis, performed on the pooled population of the four cohorts, confirmed pre-stenting IMR (OR 3.33 [1.41-7.87], p=0.006) and thrombus score (OR 4.96 [2.73-9.03], p<0.001) as the only independent predictors of final IMR >40 (R2 0.43, c statistic 0.85) with age and pain to wire time still predictors of final IMR >40 in the univariable model only.
In the pooled population, the ATI score provided an accurate identification of patients with final IMR >40 (AUC 0.87 [95% CI: 0.82-0.92], p<0.001) (Figure 3). Patients with an ATI score <2 indeed presented a 0.0% risk of final IMR >40. On the other hand, an ATI score ≥4 was associated with an overall 95.1% risk of final IMR >40 (Table 4).

Figure 3. ROC curves for the predictive value of the ATI score in the overall population. The role of pre-stenting IMR is highlighted by the significant improvement in AUC when it is included in the scoring system.
ATI SCORE AND RELATIONSHIP WITH INFARCT SIZE
The relationship between the ATI score and infarct size was assessed by pooling patients recruited at the Oxford Heart Centre (derivation, retrospective and prospective cohorts). Patients in the external cohort were analysed separately since troponin T was measured in this group instead of troponin I. Infarct size was quantified as troponin peak in both groups and also as troponin AUC in patients recruited at the Oxford Heart Centre. In the group of patients recruited at the Oxford Heart Centre, patients with a high ATI score, defined as ≥4, presented a significantly higher infarct size compared to patients with intermediate (2-3) or low (0-1) ATI score (troponin I AUC 260.8 [69.1-591.6] vs. 115.1 [53.1-120.2] vs. 106.1 [27.6-225.9], p=0.04; troponin I peak 136.5 ng/ml [36.5-325.5] vs. 66.4 ng/ml [31.6-168.4] vs. 46.0 ng/ml [18.5-137.5], p=0.05). A similar trend was detected in peak troponin T values in the smaller external cohort (7.2 ng/ml [4.3-14.2] vs. 4.4 ng/ml [1.2-6.9], p=0.06; notably only one patient in this cohort presented ATI <2).
Discussion
We have derived and validated a procedural scoring system to help predict the likely outcome of conventional treatment with PPCI. Using a pressure wire to measure IMR, combined with one angiographic and one clinical characteristic, we derived and validated the ATI score. This score may potentially be capable of early identification of patients likely to experience a suboptimal outcome during STEMI treatment.
Measuring IMR in STEMI patients after initial restoration of coronary blood flow reveals the heterogeneity of the coronary microvasculature status and the variable impact of stent implantation6. The time course and extent of the recovery of the coronary microvasculature is variable15. However, a threshold of a final IMR >40 appears to differentiate STEMI patients at the highest risk of death and readmission for heart failure8. Notably in our series, pre-stenting IMR alone was unable to predict the final IMR values6; consequently, the ATI score was derived from an initial cohort of 85 patients (derivation cohort). The validity of the ATI score was then confirmed in three further independent cohorts of patients, including an external cohort with slightly different procedural details and a lower rate of final TIMI flow 3 and MBG 3.
As well as predicting final IMR, the ATI score also predicted important markers of infarct size – troponin peak and troponin AUC. Methodological variability precluded a pooled troponin analysis, but a high ATI score (ATI score ≥4) was significantly related to larger infarct size in the pooled group of local patients (derivation+ retrospective+prospective). In our opinion, the failure of the ATI score to reach statistical significance in predicting infarct size in the external cohort is likely to be a type 2 statistical error related to the small sample size.
Each of the three variables identified as predictors within the ATI score in the derivation cohort was confirmed as a significant predictor when the logistic regression analysis was extended to the pooled population. Moreover, no additional variables were found to be predictors of post-stenting IMR >40. Predictably, age had a low overall discriminatory value but it was maintained within the model to remain consistent with the TRIPOD guidelines13.
It is reassuring that the observed variables included within the ATI score have a pathophysiological rationale. Thrombus score is a measure of the observed thrombotic burden and consequently a surrogate measure of the likelihood of subsequent distal embolisation16. Conversely, pre-stenting IMR is a composite of the degree of ischaemia-related pre-procedural injury/dysfunction of the microvasculature and a reflection of established distal embolisation17. Integration of these discrepant elements within the ATI score could logically reflect the complex interaction between distal embolisation and coronary microvasculature in determining the final outcome of PPCI18.
The novelty of the ATI score is its possible future application within the catheterisation laboratory during the revascularisation procedure. Other techniques such as cardiovascular MRI or contrast echo are able to detect an adverse outcome with very high accuracy but they cannot be applied during the revascularisation procedure. IMR, on the other hand, has the advantage of being a parameter easily measurable in the cathlab and, importantly, its measurement does not delay restoration of antegrade flow. Application of parameters derived from a Doppler wire were considered, but the additional technical complexities of wire passage and obtaining a reliable signal favoured use of the thermodilution technique.
Limitations
Although these results are promising, the relatively small size of the study group is acknowledged along with the lack of core lab angiographic analysis. Validation of the ATI score in further large infarct populations is required. The possibility of case selection bias is acknowledged as completely consecutive cases were not consistently recruited within the four cohorts, with non-consenting or otherwise ineligible patients not available for study. This selection is inevitable within this field of research but major bias is unlikely. Operator and site bias may be evident but there was no significant association between the occurrence of final IMR greater than 40 and differences in the pharmacological and procedural strategies described within the four cohorts.
Conclusions
We have shown that patients with an ATI score ≤2 have only a 14% risk of final IMR >40 (14/98 patients), whereas patients with an ATI score ≥3 have an overall 67% risk of final IMR >40 (59/88 patients) (Table 4). The specificity of the ATI score in identifying patients with minimal microvascular injury may be immediately applicable within clinical practice. Early identification of patients at high risk of post-procedural microvascular impairment in the catheterisation laboratory could allow triage of alternative or additional treatment strategies such as stenting deferral, GP IIb/IIIa inhibitor use or adenosine infusion. On the other hand, confident provision of post-myocardial infarction outcome on the cathlab table would allow designation as a low-risk patient with a rapid step down from high-intensity nursing surveillance and potentially early mobilisation and discharge.
| Impact on daily practice Earlier recognition of which patients experiencing STEMI might benefit from additional or alternative therapeutic strategies may improve outcomes. The ATI score, based on a clinical parameter (age), an angiographic parameter (thrombus score) and on the index of microcirculatory resistance measured once coronary flow has been restored, can predict suboptimal reperfusion at an early stage of the revascularisation procedure. It can be assessed easily and safely prior to stenting and may have an application in allowing reproducible triage for novel therapeutic strategies designed to improve the outcome of patients at the highest risk of suboptimal reperfusion. |
Funding
Supported by the National Institute for Health Research (NIHR) Oxford Biomedical Research Centre.
Conflict of interest statement
A. Banning has received an institutional research grant from Boston Scientific. The other authors have no conflicts of interest to declare.
