Abstract
Background: Coronary blood flow in humans is known to be predominantly diastolic. Small studies in animals and humans suggest that this is less pronounced or even reversed in the right coronary artery (RCA).
Aims: This study aimed to characterise the phasic patterns of coronary flow in the left versus right coronary arteries of patients undergoing invasive physiological assessment.
Methods: We analysed data from the Iberian-Dutch-English Collaborators (IDEAL) study. A total of 482 simultaneous pressure and flow measurements from 301 patients were included in our analysis.
Results: On average, coronary flow was higher in diastole both at rest and during hyperaemia in both the RCA and LCA (mean diastolic-to-systolic velocity ratio [DSVR] was, respectively, 1.85±0.70, 1.76±0.58, 1.53±0.34 and 1.58±0.43 for LCArest, LCAhyp, RCArest and RCAhyp, p<0.001 for between-vessel comparisons). Although the type of RCA dominance affected the DSVR magnitude (RCAdom=1.55±0.35, RCAco-dom=1.40±0.27, RCAnon-dom=1.35; standard deviation not reported as n=3), systolic flow was very rarely predominant (DSVR was greater than or equal to 1.00 in 472/482 cases [97.9%] overall), with equal prevalence in the LCA. Stenosis severity or microvascular dysfunction had a negligible impact on DSVR in both the RCA and LCA (DSVR x hyperaemic stenosis resistance R2 =0.018, p=0.03 and DSVR x coronary flow reserve R2 <0.001, p=0.98).
Conclusions: In patients with coronary artery disease undergoing physiological assessment, diastolic flow predominance is seen in both left and right coronary arteries. Clinical interpretation of coronary physiological data should therefore not differ between the left and the right coronary systems.
Introduction
Physiological assessment of coronary stenoses and the microcirculation, which is recommended by current clinical guidelines12, does not currently differ whether the measurements are performed in the right or left coronary arteries. It remains largely unknown whether differences in haemodynamic patterns between the right and left coronary territories in patients with coronary disease should affect interpretation of physiological data.
In contrast to the systemic circulation, human coronary blood flow is predominantly diastolic3. This reversed phasic pattern is caused by the systolic compression of the microcirculation by the myocardium - which impedes perfusion to its own tissue during systole - as well as by an active suction of blood from the aorta in diastole, which occurs as a result of myocardial recoiling3456. The diastolic predominance of coronary perfusion is believed to apply mostly to epicardial arteries which penetrate the left ventricular myocardium and are therefore subject to phasic compression forces under systemic pressures789.
Although this is widely acknowledged to be the case for the human left coronary artery (LCA)10111213, the extent to which this phasic pattern applies to the right coronary artery (RCA) is less clearly understood. Small animal and human studies have suggested that systolic flow in the RCA is equal to or even greater than diastolic flow3914151617. This pattern has never been convincingly proven with larger cohorts of human subjects, including those with coronary artery disease. It has also been demonstrated that the magnitude of diastolic predominance of coronary flow is influenced by other factors such as the presence of epicardial stenoses, aortic valve disease or the relative amount of myocardium subtended818192021.
In the present study, we systematically quantified the phasic patterns of flow in the right and left coronary arteries of patients undergoing clinical invasive physiological interrogation of coronary disease, as part of the Iberian-Dutch-English Collaborators (IDEAL) study22. We also explored the extent to which stenosis severity and other systemic and microvascular haemodynamic parameters influence phasic patterns of flow (Central illustration).
Central illustration. In patients with coronary artery disease undergoing physiological assessment, diastolic flow predominance is seen in both the left and right coronary arteries. cm/s: centimetres per second; DSVR: diastolic-to-systolic coronary flow velocity ratio; LCA: left coronary artery; RCA: right coronary artery
Methods
Study population
The IDEAL study incorporates prospectively collected data from a total of 567 combined pressure and Doppler flow velocity measurements in 301 patients at the Academic Medical Center Amsterdam, the Netherlands (n=161), Imperial College London, UK (n=160), Hospital Clinico San Carlos, Madrid, Spain (n=21), and VU University Medical Center, Amsterdam, the Netherlands (n=225). All patients recruited were scheduled for elective coronary angiography with physiological stenosis assessment and gave written informed consent for acquisition of additional physiological data for study purposes.
Data collection
Detailed methods of data collection for the IDEAL study have been published previously22. Briefly, patients attended the catheter laboratory and angiography was performed; IV heparin was given and cardiac catheterisation was performed. Pressure and Doppler flow sensor-tipped wires (ComboWire; Philips) were positioned in the coronary arteries (beyond the most distal stenosis if any were present) and continuous meaurements of proximal (aortic) pressure (Pa), distal coronary pressure (Pd) and coronary flow velocity (flow) were made (Supplementary Figure 1). To induce hyperaemia, intravenous (140 mcg/kg/min) or intracoronary (60-150 mcg) adenosine was given. In those RCA vessels where wire position could be ascertained, this was scored by multiple authors (H. Seligman, G. de Waard, T. van de Hoef, H. Mejia-Renteria) to compare phasic flow patterns for different wire positions. Both culprit and non-culprit arteries were assessed.
Data analysis
In this post hoc analysis the original pressure and flow data from the locked database were retrospectively analysed. Angiograms were independently reviewed (H. Seligman, T. van de Hoef, H. Mejia-Renteria, G. de Waard) to decide vessel dominance by assessors blinded to the physiological data. The dominant vessel was defined as that from which the posterior descending artery originated and, in cases where the posterior left ventricular wall was dually supplied, this was described as co-dominant. Where between-vessel comparisons were made, the term LCA refers to those measurements that were taken in either the left anterior descending artery (LAD), left circumflex artery (LCx) or any of their major branches. Dedicated software within the MATLAB (Mathworks Inc.) computer programming environment was used to extract and quantify pressure and flow data files.
Aortic and distal pressures as well as peak Doppler flow velocity were analysed in a beat-to-beat fashion, with a minimum of five cardiac cycles used for each analysis. Average pressures were defined as the N beat average. Phasic identification of systole and diastole in each cardiac beat was performed with electrocardiography (ECG) and pressure-gating. Mid-diastole was defined as the time period occurring 25% into diastole (after dicrotic notch) up to 5 ms before the next systolic upstroke. Systole was defined as the period between the beginning of the systolic upstroke up to the dicrotic notch22. As previously reported, diastolic-to-systolic velocity ratio (DSVR) was calculated as the N beat average of mid-diastolic average peak velocity divided by systolic average peak flow velocity18. Microvascular resistance was defined as the average distal coronary pressure (Pd) divided by the average peak flow velocity (flow) over a cardiac cycle time averaged over multiple beats according to the hydraulic expression of Ohm’s law.
Statistical analysis
Continuous variables are presented as mean±standard deviation. Categorical variables are presented as fractions and percentages. An independent samples or paired samples t-test was used for continuous variables. A chi-squared test was used for comparison of proportions. Log transformation was applied to independent and dependent variables in order to achieve linearity of the relationship, as required for linear regression analysis. A two-sided p-value of 0.05 was considered statistically significant. Statistical analyses were performed using SPSS, Version 22.0 (IBM), Microsoft Excel v 16.3 and the R statistical programming environment (R Foundation for Statistical Computing).
Results
Patient and vessel characteristics
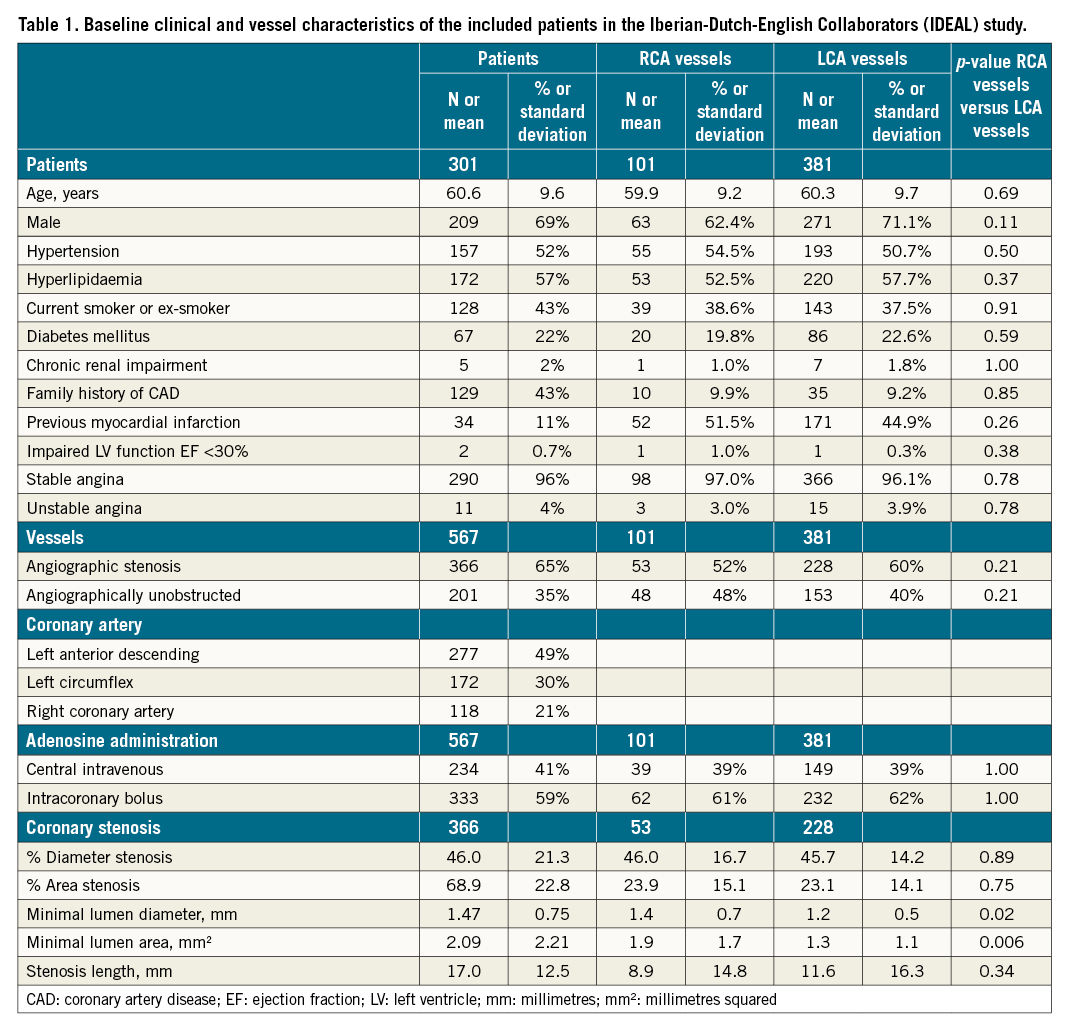
The original data set included 567 coronary assessments from 301 patients (age 60.6±9.6 years, 69% male). Characteristics of the included patients, vessels and stenoses are shown per participating centre in the original article22 and reproduced in summary here in Table 1. A total of 366 vessels (65%) had a visible anatomical stenosis (Supplementary Figure 2), and 201 vessels (35%) were free from angiographic disease, serving as reference vessels. In total, 482 vessels were included in our final analysis of coronary flow (101 RCA, 147 Cx and 234 LAD). Of all included RCAs, 89 (88%) were dominant, 9 (9%) were co-dominant and only 3 (3%) were non-dominant. RCA or Cx were deemed to be dominant if they supplied the posterior descending artery, and co-dominant if they contributed equally.
Phasic coronary haemodynamic patterns in right versus left coronary arteries
Coronary flow profiles are presented in detail in Table 2 and summarised in Figure 1. Across the entire sample, resting diastolic flow velocity was higher than systolic flow velocity (23.5±11.8 cm/s vs 13.9±6.7 cm/s, p<0.0001, respectively), leading to an overall resting diastolic-to-systolic velocity ratio (DSVRrest) of 1.78±0.66. Mean resting diastolic flow velocity was statistically lower in the RCA when compared to the LAD (20.9±8.5 cm/s vs 24.1±13.1 cm/s, p=0.02, respectively) and Cx (24.4±11.3 cm/s, p<0.0001) arteries. Mean resting systolic flow velocity was not significantly different between vessels (RCA 14.4±6.6 cm/s, LAD 13.4±6.7 cm/s and Cx 14.2±6.8 cm/s, p=0.21 for comparison between vessels). The magnitude of diastolic dominance was 17% lower for the RCA (RCA DSVR 1.53±0.34, versus LCA DSVR 1.85±0.70, p<0.0001, respectively), a pattern driven by different magnitudes of diastolic flow (Figure 1). Systolic flow was rarely greater than diastolic flow: DSVR was less than or equal to 1.00 in 13/482 cases (2.7%) overall, 2/234 (0.9%) in the LAD, 7/147 (4.8%) in the Cx and 4/101 (4.0%) in the RCA (p=0.38 for comparison between vessels) (Figure 2, Central illustration). Across all vessels, mean hyperaemic DSVR (DSVRhyp) was 3% lower than DSVRrest (1.72±0.56 versus 1.78±0.66, p=0.02) (Figure 1), hence for all three arteries the pattern of diastolic flow predominance was not largely affected by hyperaemia. Figure 3 shows a typical resting flow profile for RCA and LAD vessels selected from the sample. In a subset of the 101 RCA vessels in which Doppler sensor position was available (n=70), we found that the majority of interrogations were performed distally (n=56, versus n=14 for proximal or mid vessel). However, the magnitude of diastolic predominance was higher in distal segments compared to proximal and mid segments (distal DSVR=1.55±0.36, n=56 vs mid or proximal DSVR 1.39±0.31, n=14, p<0.001). Systolic flow was, on average, never predominant regardless of wire position within the mid to distal portion of each coronary artery. Microvascular resistance was lower in diastole when compared to systole across all vessels (4.0±1.9 mmHg.s/cm vs 9.2±4.6 mmHg.s/cm, p<0.001, respectively). This pattern was observed both in the LCA (3.9±1.9 mmHg.s/cm vs 9.3±4.5 mmHg.s/cm, p<0.001) and the RCA (4.6±2.1 mmHg.s/cm vs 9.0±5.0 mmHg.s/cm, p<0.001) (Table 2). As a result of lower resistance and higher coronary flow, coronary pressure ratio (Pd/Pa) was lower in diastole than in systole in both LCAs (0.83±0.20 vs 0.91±0.11, p<0.001) and RCAs (0.88±0.18 vs 0.93±0.14, p<0.001). In 21/281 (7.5%) vessels, Pd/Pa was lower during systole and was observed strictly in non-flow-limiting lesions (fractional flow reserve [FFR]=0.97±0.04). This was also seen in both LCAs (15/228 [6.6%]) and RCAs (6/53 [11.3%]).
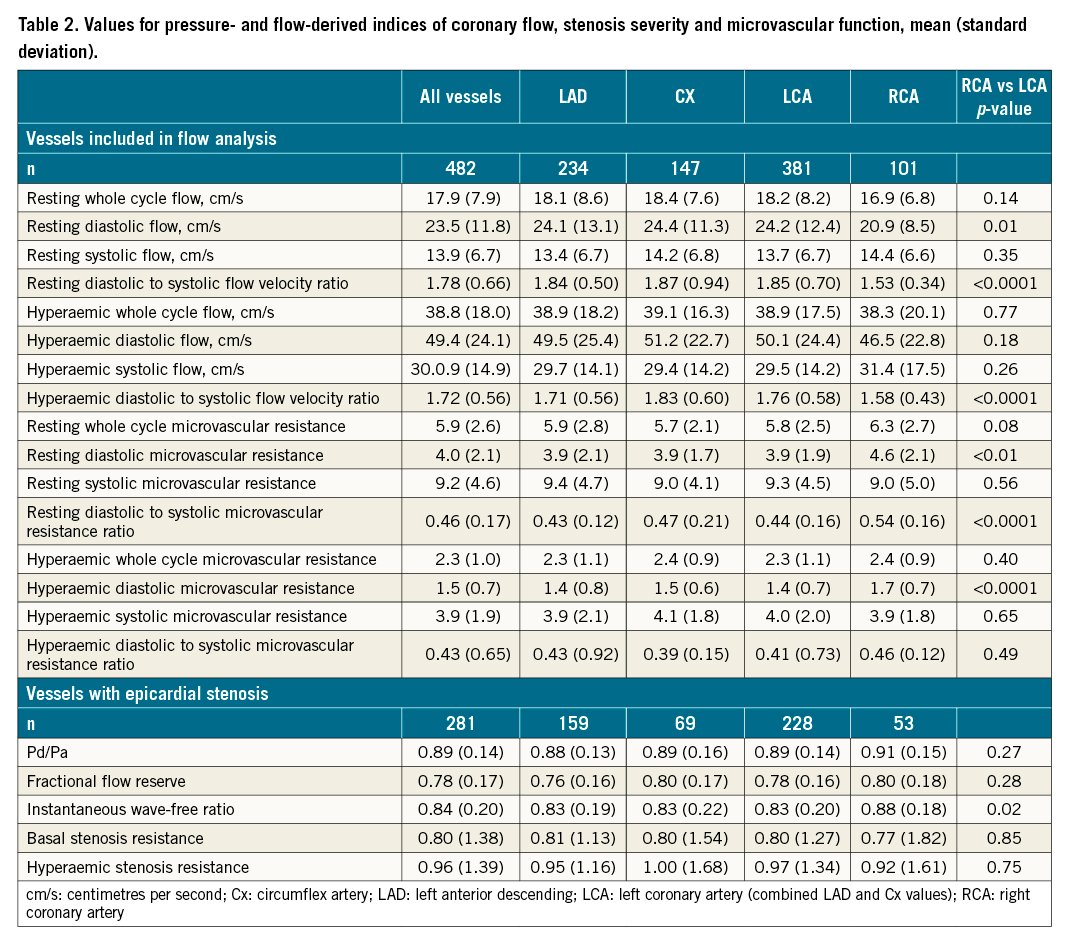
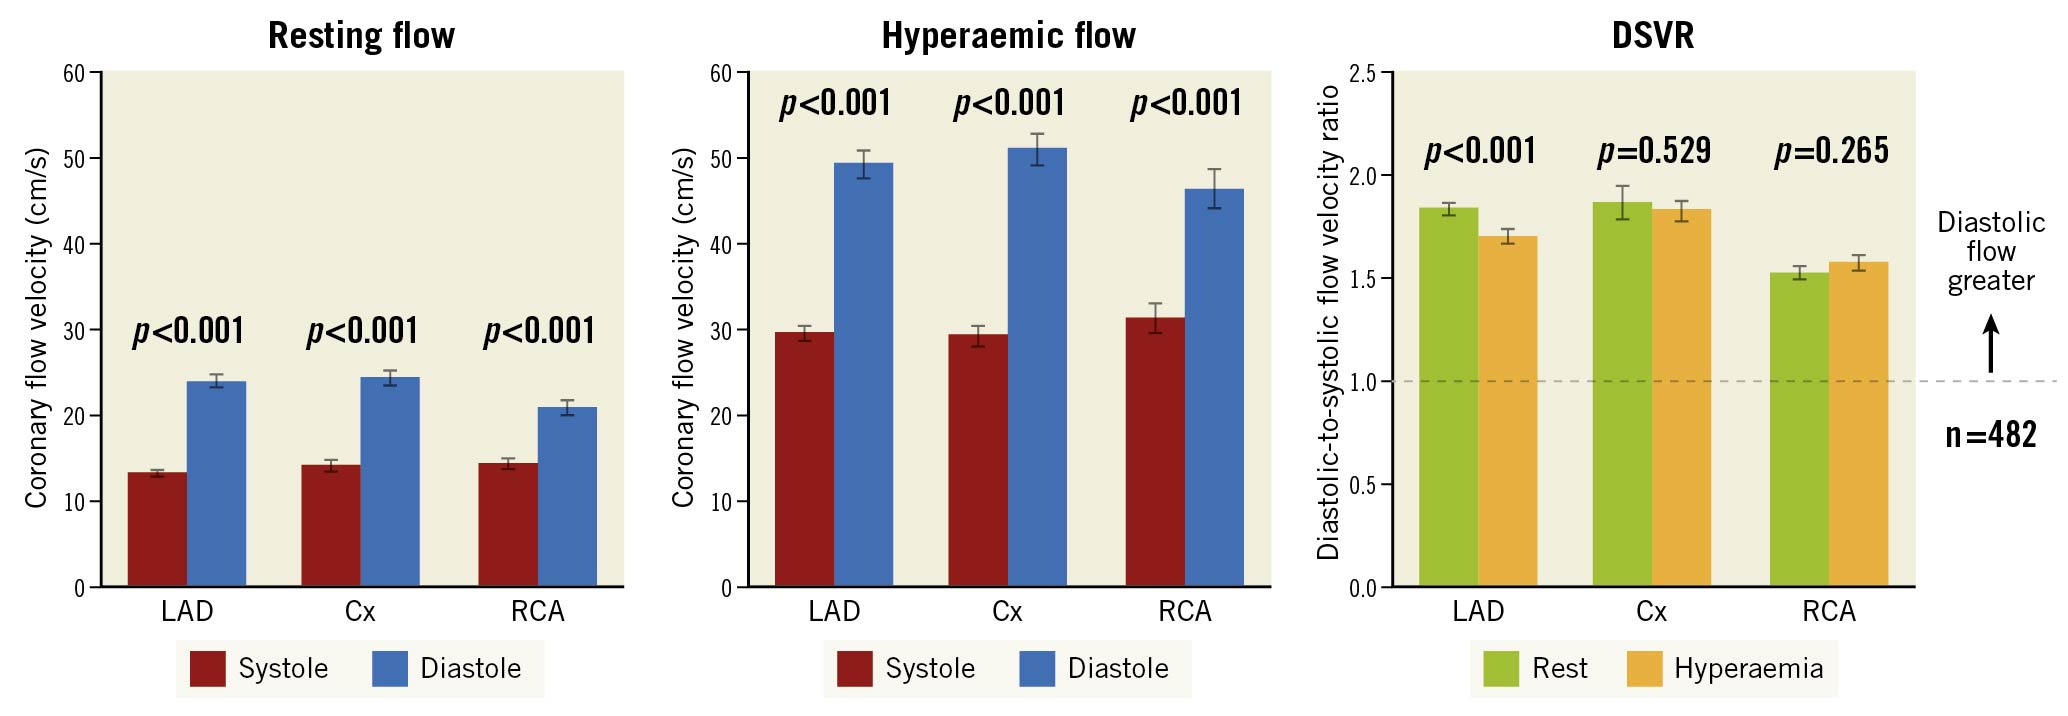
Figure 1. Phasic flow patterns in all coronary territories. The left and centre panels show the coronary flow velocity in each of the coronary arteries during systole (in red) and diastole (in blue). The error bars denote the standard error. The left panel shows resting values and the centre panel shows values during hyperaemia. Mean diastolic flow in all vessels was greater than mean systolic flow. In the RCA, the resting diastolic-to-systolic flow velocity ratio is less than in the LAD and Cx but is still clearly positive. This pattern is consistent during hyperaemia. The right-hand panel shows the ratio between flow in diastole and systole which is greater than 1 in all three territories at rest (in green) and hyperaemia (in orange). cm/s: centimetres per second; Cx: circumflex; DSVR: diastolic-to-systolic coronary flow velocity ratio; LAD: left anterior descending; RCA: right coronary artery
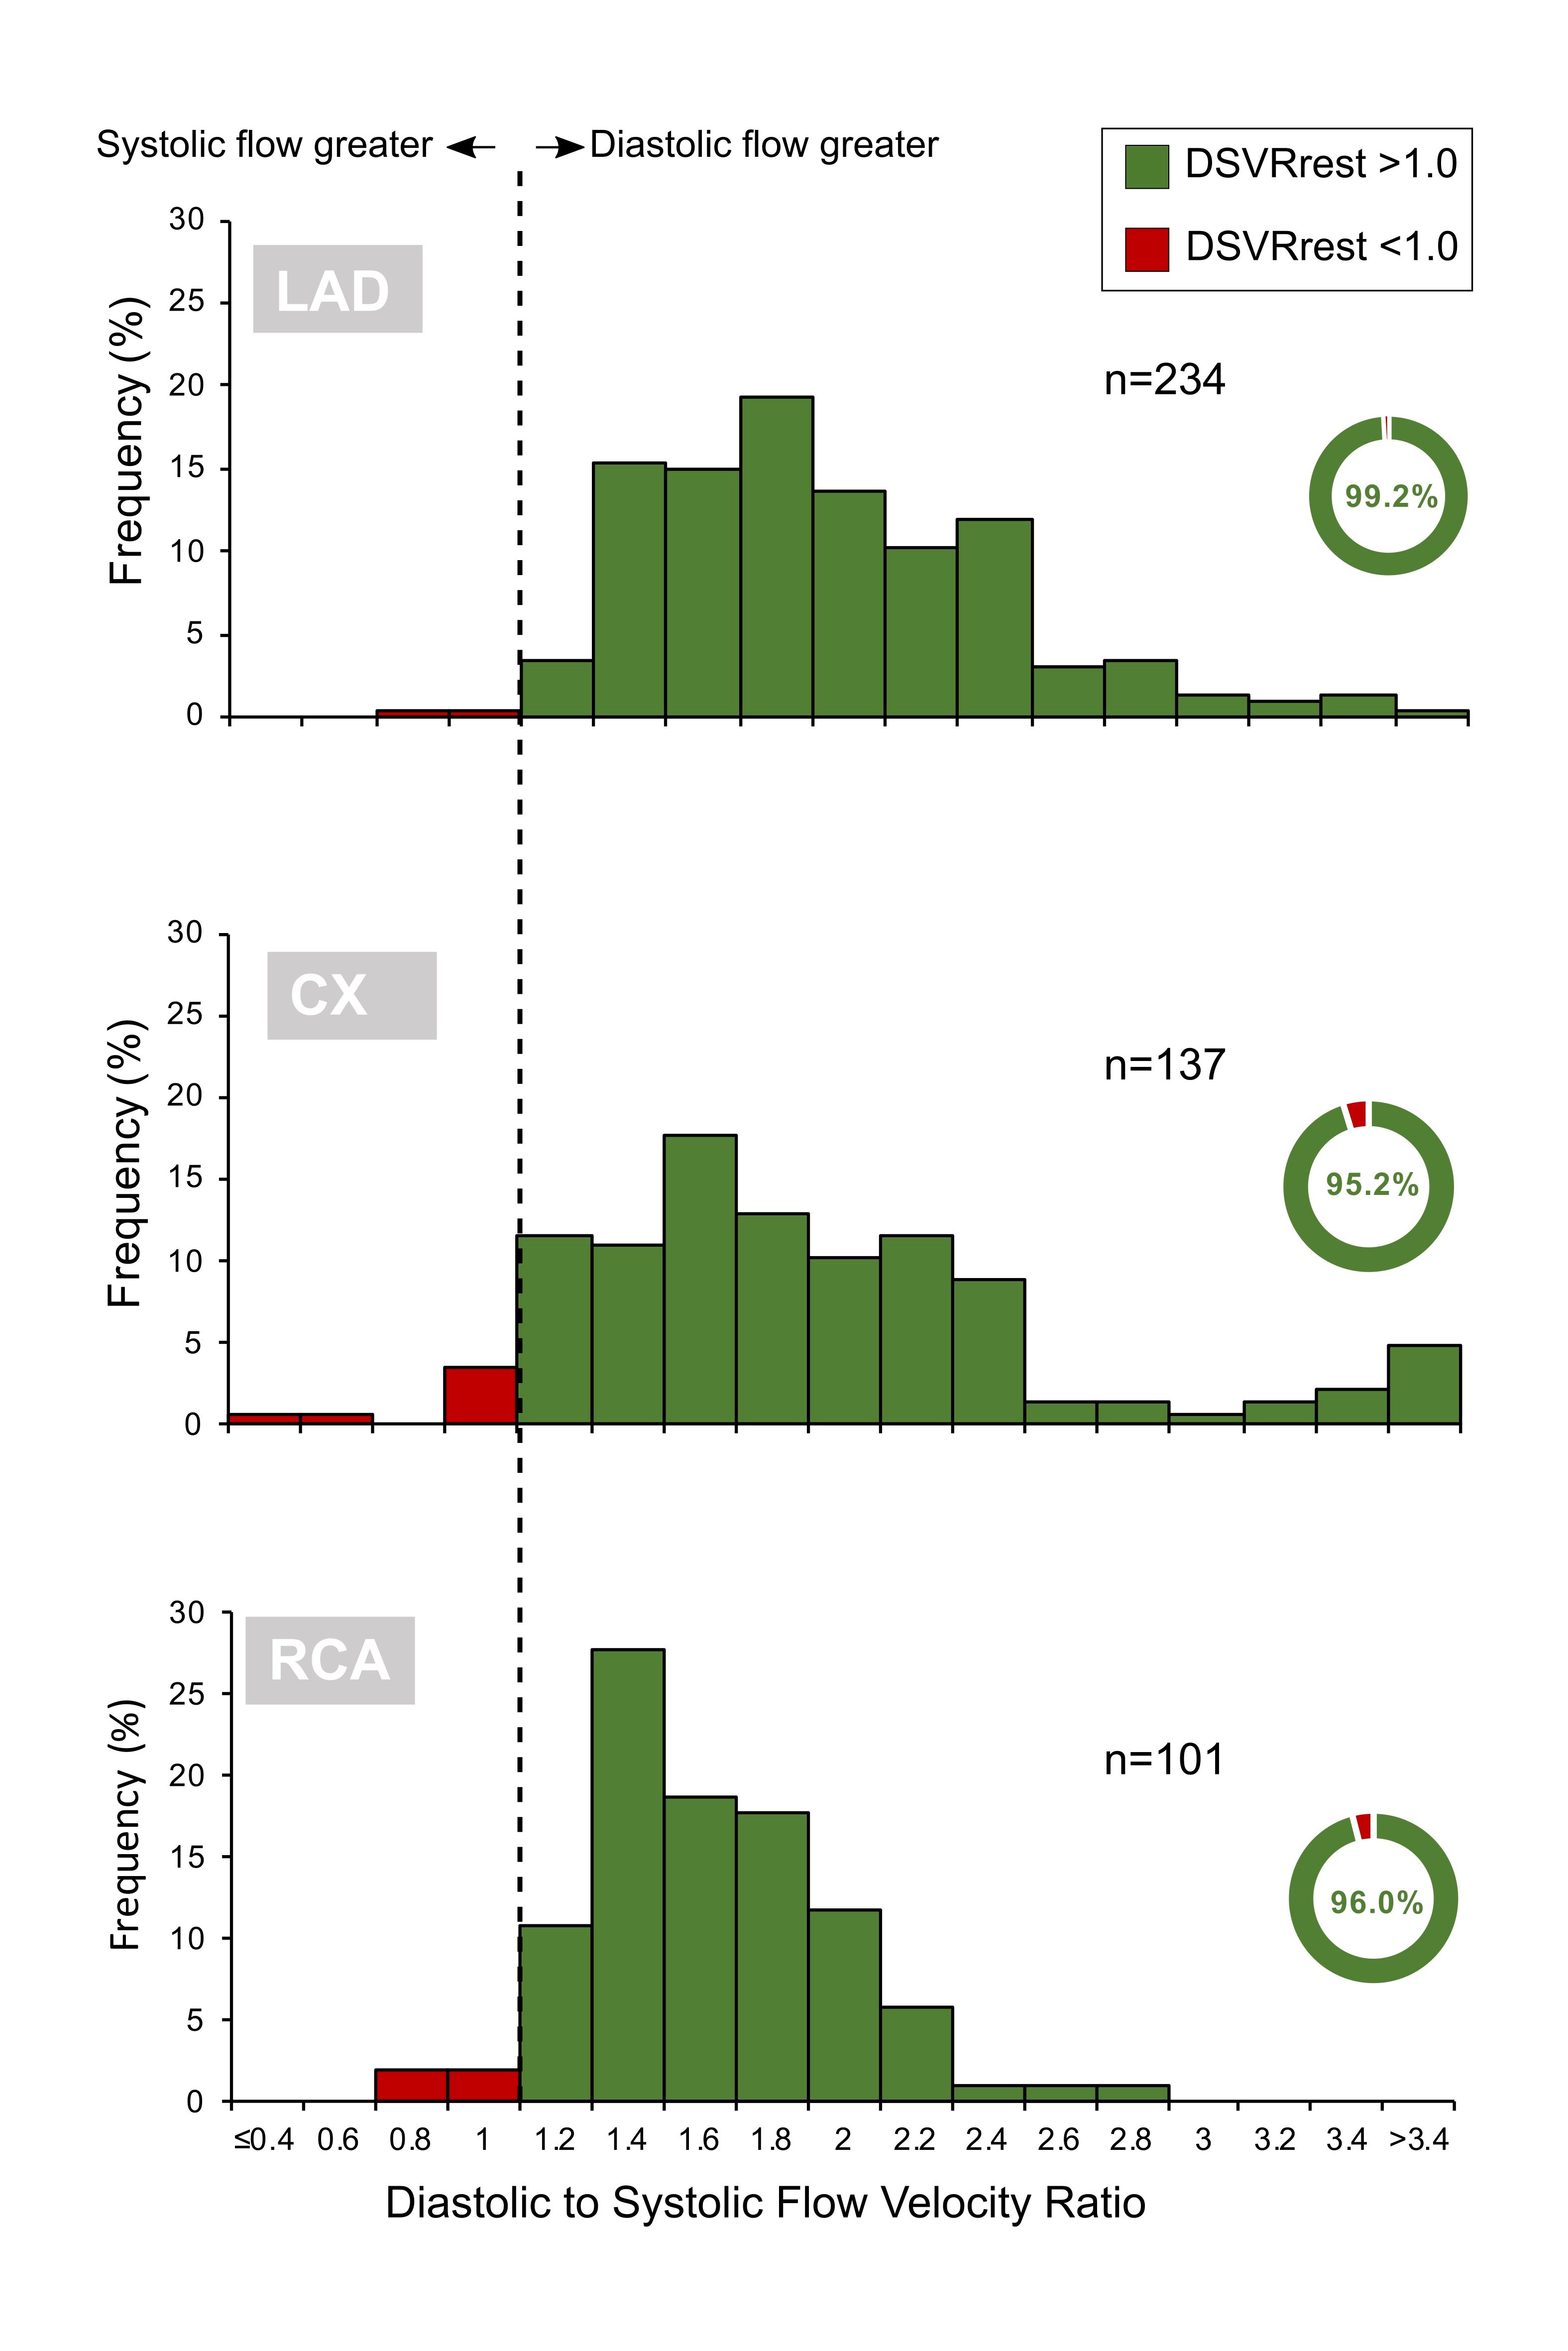
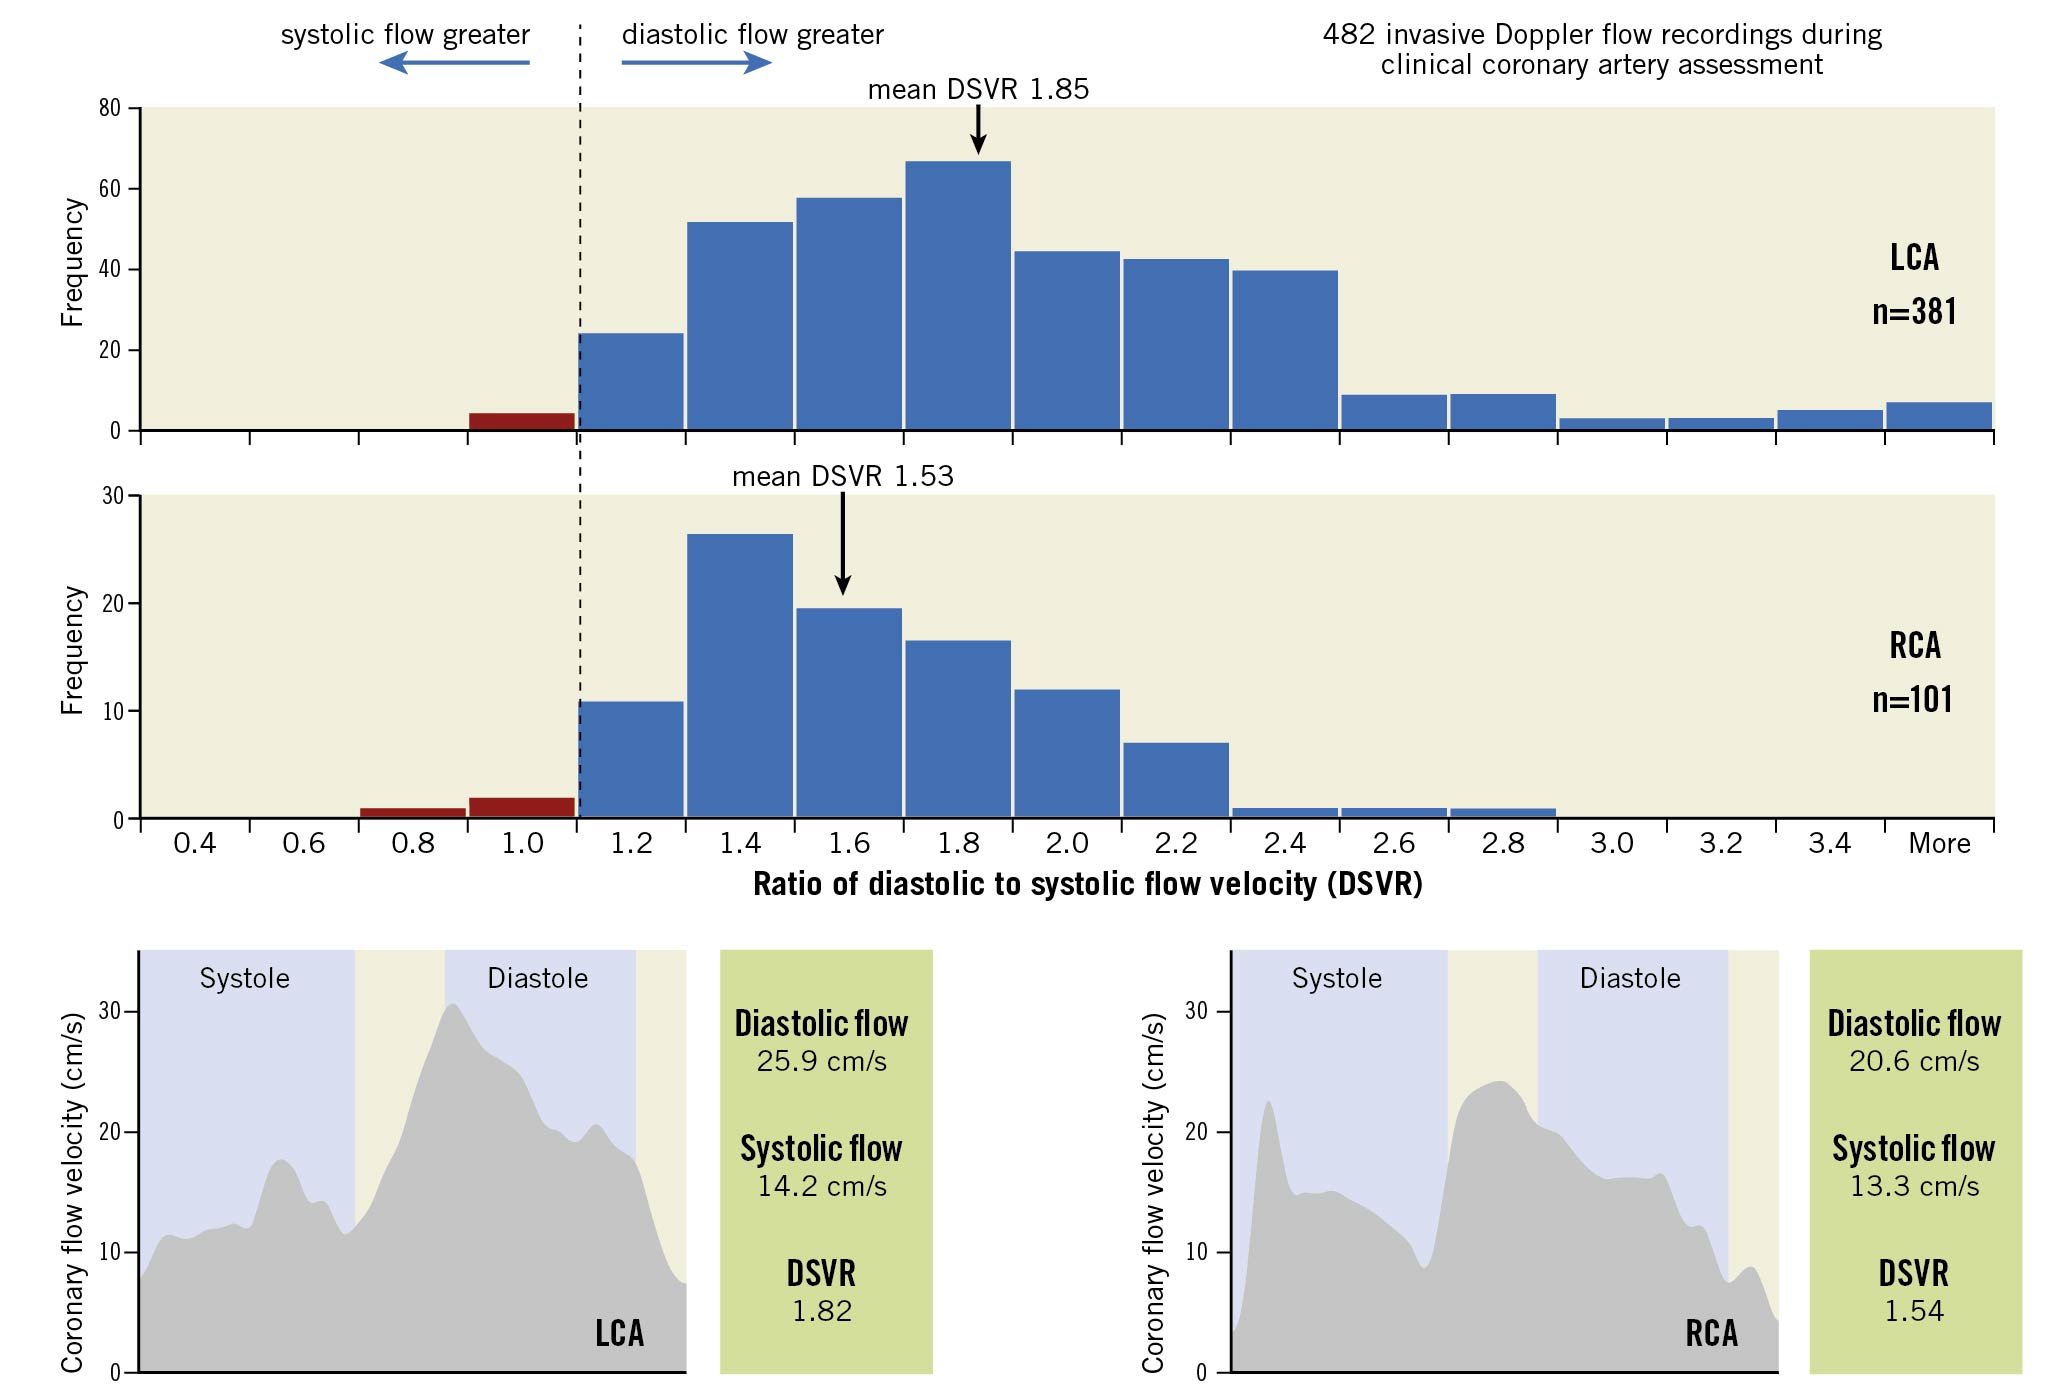
Figure 2. Distribution of DSVR values. These histograms show the distribution of DSVR values recorded in the three coronary arteries. Values above 1 are shown in blue and values below 1 are shown in red. Almost all the readings are ≥1 as shown in the percentage wheels for each vessel. Cx: circumflex; DSVR: diastolic-to-systolic coronary flow velocity ratio; LAD: left anterior descending; RCA: right coronary artery
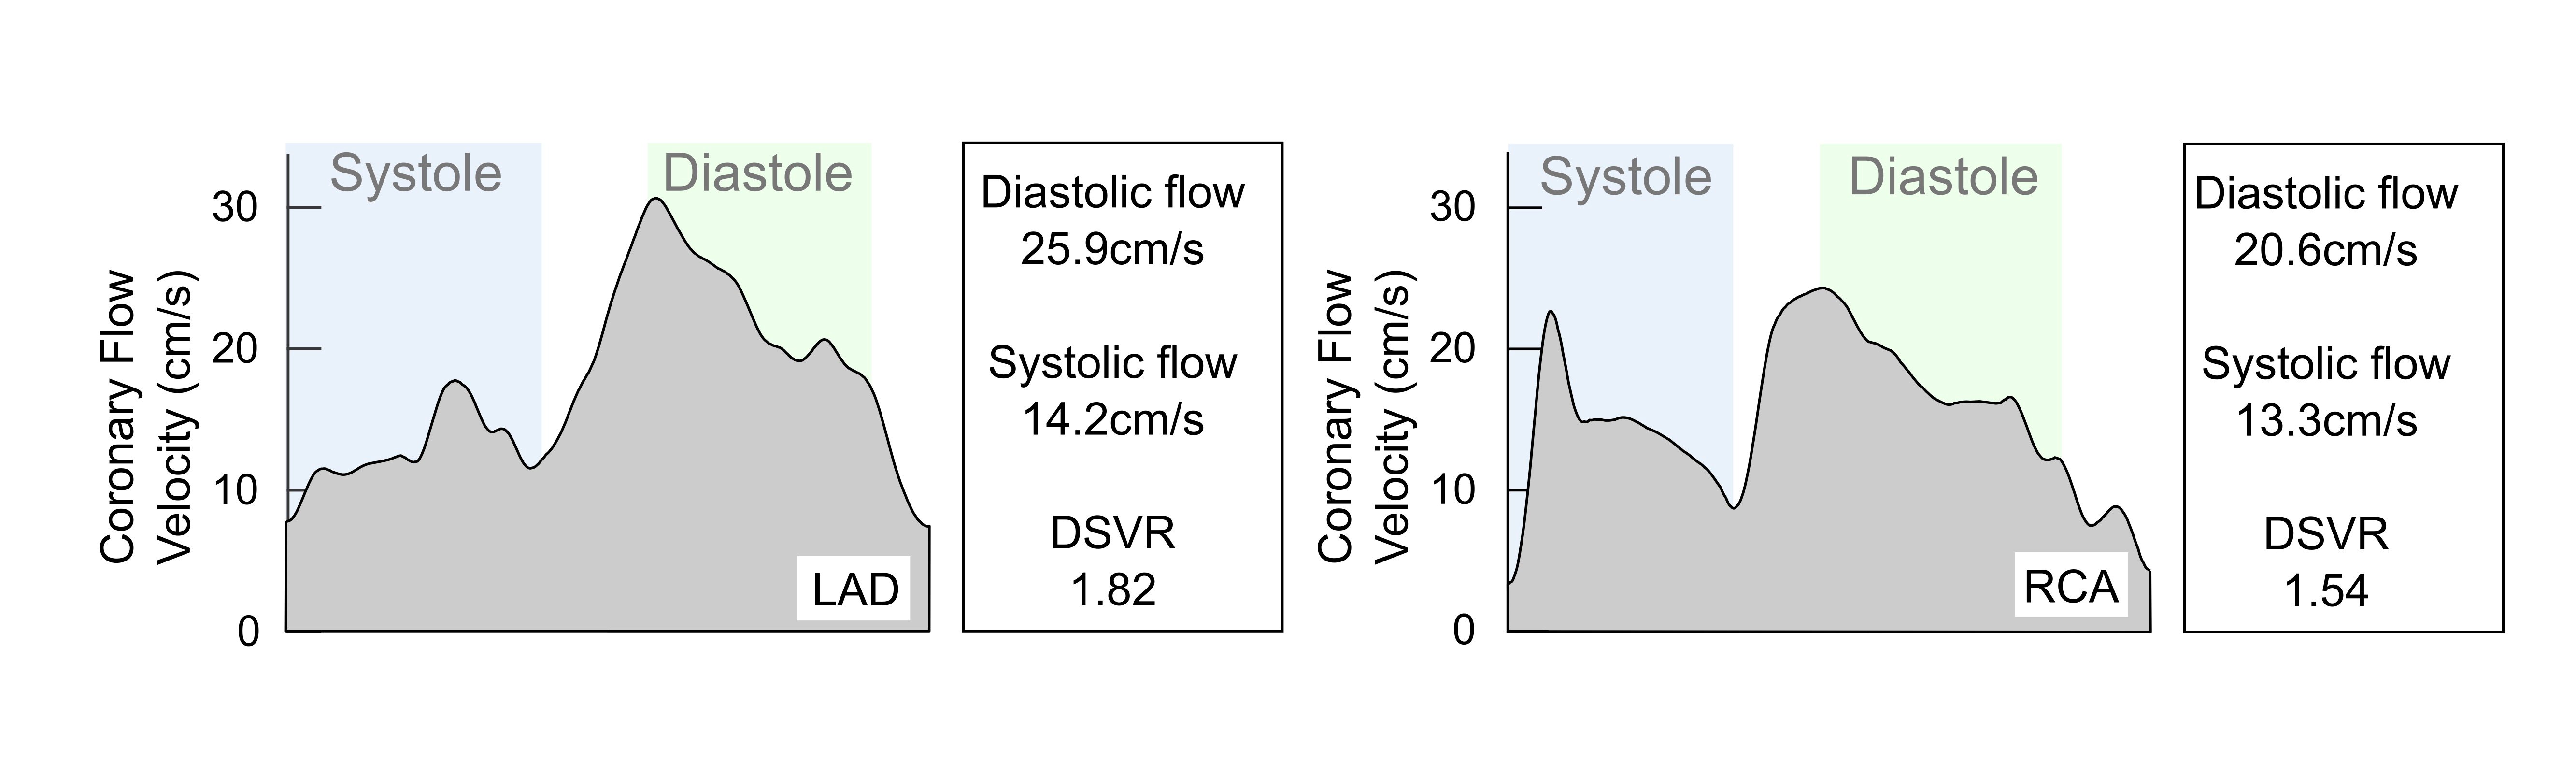
Figure 3. Typical flow velocity traces. Typical flow velocity traces are shown for one cardiac cycle in the LAD and RCA. These show average values for mean peak flow velocity in systole and diastole and the diastolic-to-systolic flow velocity ratio (DSVR). These are from two real vessels in the sample that approximate the population means and are thus representative. The DSVR is higher in the LAD, chiefly as a result of higher mean diastolic flow velocity. cm/s: centimetres per second; DSVR: diastolic-to-systolic coronary flow velocity ratio; LAD: left anterior descending artery; RCA: right coronary artery
Impact of right coronary dominance on phasic haemodynamics
In this study population, diastolic flow predominance was maintained for all types of RCA arteries, including dominant (RCAdom), co-dominant (RCAco-dom) and non-dominant (RCAnon-dom). DSVR in RCAnon-dom was not significantly lower than for RCAco-dom (1.35±0.53, n=3 vs 1.40±0.27, n=9, p=0.83) or RCAdom (1.55±0.35, n=89, p=0.34) (Figure 4). A single factor analysis of variance (ANOVA) for the three patterns of RCA dominance did not display a significant relationship (F[2, 98]=1.18, p=0.31). Supplementary Table 1 shows the linear regression of all baseline characteristics against DSVR.
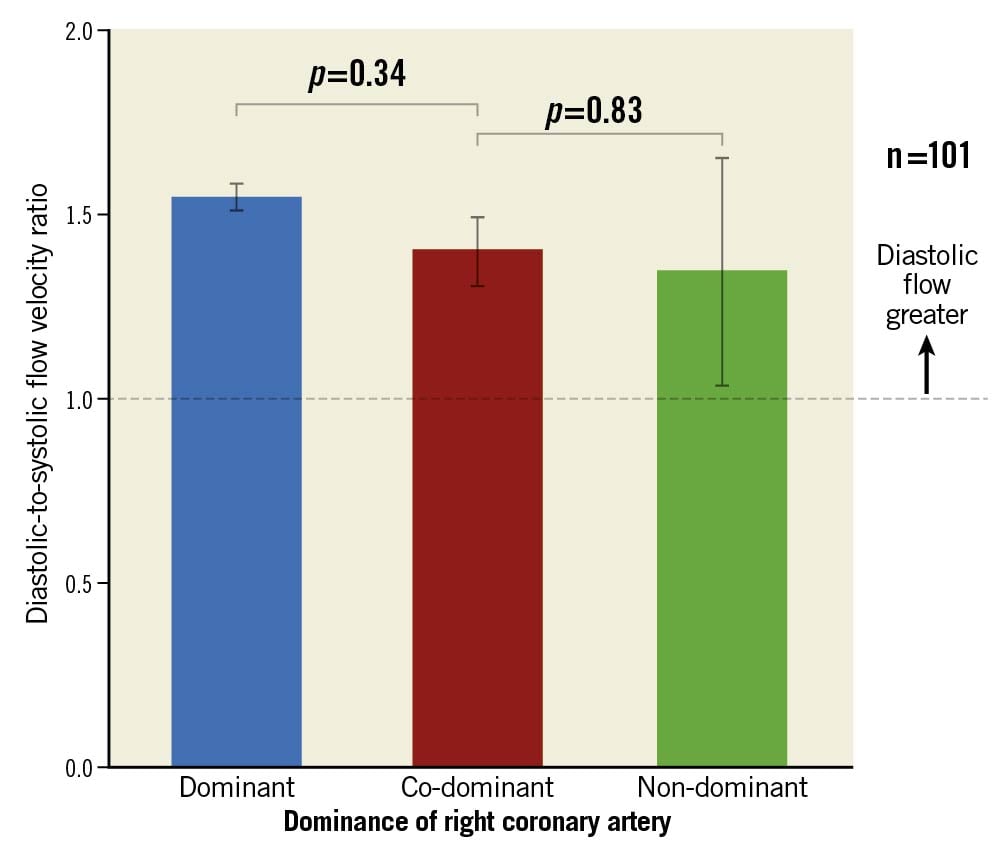
Figure 4. DSVR in different dominance patterns. Bar chart showing the ratio of coronary flow velocity in diastole to that in systole stratified by dominance of the RCA. Although flow in diastole is always greater, it is not significantly greater between dominant and non-dominant or dominant and co-dominant vessels. Error bars denote standard error. LCA: left coronary artery; RCA: right coronary artery
Impact of stenosis severity and other haemodynamic parameters on DSVR
Amongst all vessels, 281/482 (58.3%) had at least one moderate angiographic stenosis. In the LAD, DSVR was higher for vessels with angiographic disease than those without (1.72±0.47 versus 2.05±0.92, p<0.001); however, the pattern was reversed in the RCA (1.62±0.35 versus 1.42±0.31, p=0.003). Overall, DSVR was lower in those vessels with angiographic stenosis than in those without (1.70±0.45 versus 1.90±0.86, p<0.001). For both the RCA and LCA, we found no meaningful relationship between DSVR and underlying physiological stenosis severity (R2 against log of hyperaemic stenosis resistance [HSR] = 0.0064, p=0.16 [Figure 5, Figure 6]; R2 against FFR=0.016, p=0.03 [Supplementary Figure 3]; and R2 against instantaneous wave-free ratio [iFR]=0.011, p=0.07). Across all RCA vessels, mean DSVR was slightly higher in flow-limiting lesions, with HSR ≥0.80 mmHg/cm/s (Figure 5). Distribution of FFR across the sample as well as diameter stenosis for patients with angiographic stenosis and visually moderate stenosis are shown in Supplementary Figure 2 and Supplementary Figure 4.
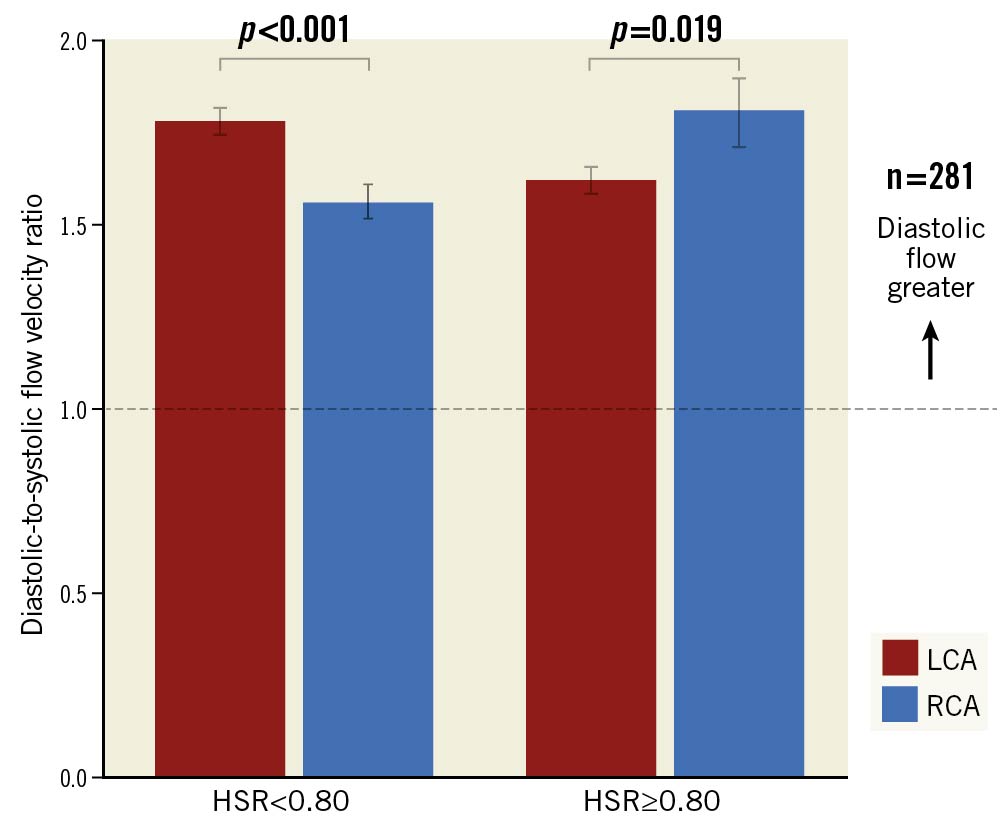
Figure 5. Effect of epicardial stenosis on DSVR. Comparison of right and left coronary artery DSVR between physiologically significant and non-significant stenoses. DSVRrest values are shown for the LCA (red) and the RCA (blue) stratified by a clinical HSR cut-off of 0.8. These relationships are reversed depending on physiological lesion severity. FFR: fractional flow reserve; HSR: hyperaemic stenosis resistance; LCA: left coronary artery; RCA: right coronary artery
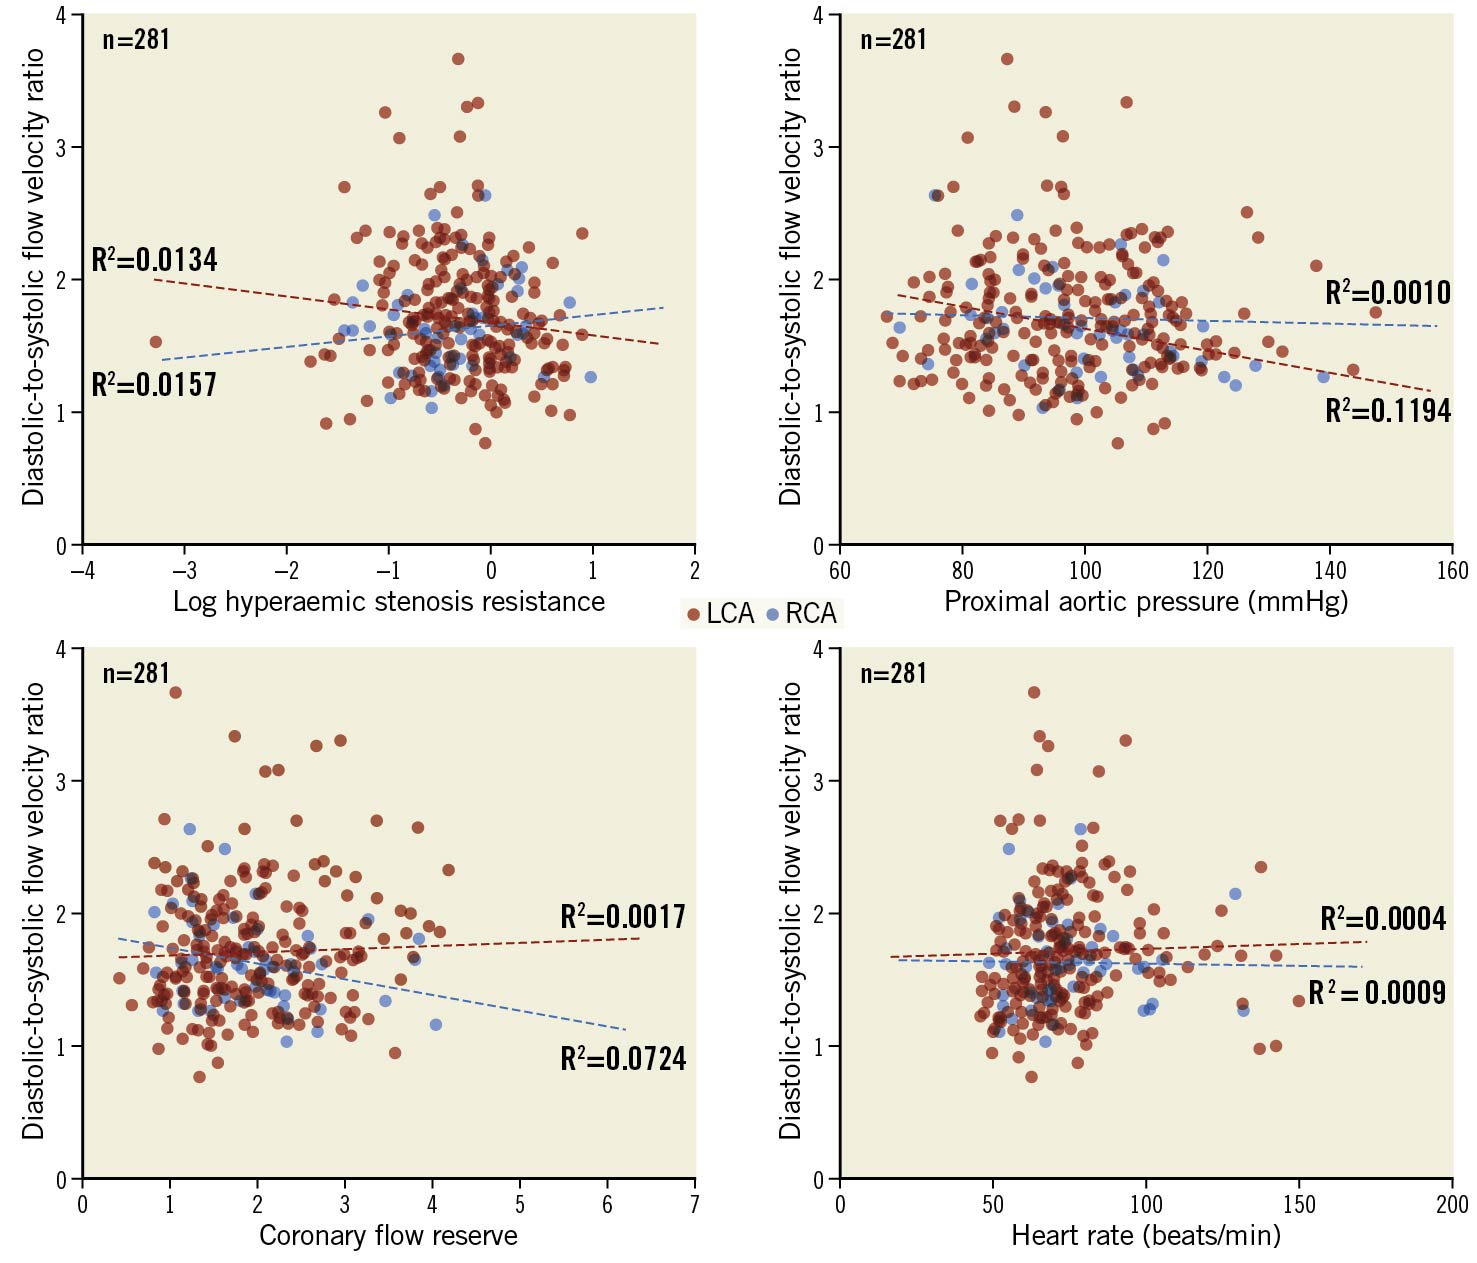
Figure 6. Effect of haemodynamic parameters on DSVR. Scatter plots of DSVR plotted against log HSR, proximal aortic pressure, coronary flow reserve and heart rate with LCA values in red and RCA values in blue. None of these parameters is strongly predictive of DSVR. LCA: left coronary artery; min: minute; mmHg: millimetres of mercury; RCA: right coronary artery
In a subset of 85 vessels with a severe stenosis which underwent percutaneous revascularisation (PCI), DSVR increased modestly post-intervention in comparison to baseline both at rest (1.58±0.37 vs 1.71±0.43, p<0.005) and during hyperaemia (1.55±0.52 vs 2.01±1.99, p=0.04). The FFR distribution in these vessels is shown in Supplementary Figure 5.
Across all vessels, there was no significant relationship between DSVR and other systemic (blood pressure and heart rate) as well as coronary microvascular haemodynamic parameters (Figure 6).
Discussion
In this study we quantified the phasic haemodynamic patterns in the right and left coronary arteries of patients undergoing coronary physiological assessment in routine clinical practice. We found that (1) both resting and hyperaemic flow in all three major coronary arteries are predominantly diastolic, with the magnitude of such diastolic predominance being greater in the LCA when compared to the RCA; (2) diastolic flow predominance was observed in all types of RCA (dominant, non-dominant and co-dominant), although the study sample was mostly formed of at least co-dominant RCAs; (3) microvascular resistance and Pd/Pa is consistently lower in diastole both in LCA and RCA; (4) neither stenosis severity nor coronary microvascular parameters significantly affected diastolic flow predominance for both RCA and LCA, although a significant increase in DSVR at rest and during hyperaemia was found after PCI.
Phasic coronary haemodynamics in patients with coronary artery disease
In this analysis we found that, in patients undergoing invasive coronary physiological assessment in clinical practice, an overall pattern of diastolic flow predominance was consistent both at rest and during hyperaemia across all coronary territories (Figure 1). We also found that the drive for such flow predominance is a lower diastolic microvascular resistance, which led to consistently lower diastolic values for Pd/Pa, when compared to systole. This was also observed across all vessels.
Previous smaller animal and human studies suggested that there may be important universal differences in phasic haemodynamic patterns between RCAs and LCAs391523. Relative systolic predominance has even been proposed by some as the predominant flow pattern for RCAs specifically1517. However, such early studies were small, with samples not representative of patients with coronary disease. In our large clinically representative sample, although the magnitude of diastolic predominance was lower for RCAs when compared to LCAs (DSVR of 1.53±0.34 versus 1.85±0.70, respectively) (Figure 1), systolic flow predominance (DSVR <1.00) was rare (2.7% of all cases) and observed equally in all three vessels (Figure 2). Such a narrow range of mean DSVR values in RCAs and LCAs (1.5-2.0, meaning a diastolic flow 50% to 100% higher than systolic) has been consistently reported in other recent studies79. Although Wilson et al3 found very similar diastolic dominance values for RCAs (DSVR of 1.49), in his small sample DSVR for the LAD was 5.9 (diastolic flow nearly six times higher than systolic), an extremely high value not replicated since by Hadjiloizou et al9 or Ofili et al7.
We also report a comparison of phasic flow between different types of RCA vessels and wire position. We found that diastolic flow predominance in the RCA was observed even for co-dominant and non-dominant vessels (Figure 4), although overall numbers for such vessels were small – because it is not routine clinical practice to place a pressure wire in small, non-dominant vessels. The magnitude of diastolic predominance of coronary flow appears to be related to the proportion of left ventricular myocardium supplied by the vessel. Firstly, we found DSVR to be lower in non-dominant RCAs (1.35±0.53), compared to dominant or co-dominant RCAs (1.53±0.26) and LCAs (1.85±0.70). Secondly, we observed that DSVR is higher in distal RCAs (supplying predominantly left ventricle [LV] mass), compared to proximal and mid RCAs (supplying more right ventricle [RV] territories; 1.55±0.36 vs 1.39±0.31, respectively). Also, it has previously been observed that coronary flow is predominantly systolic in atrial branches of the Cx (which supplies no left ventricular myocardium)24. Finally, Akasaka et al found that diastolic predominance of flow is increased in RV branches of patients with pulmonary hypertension25, supporting the concept that DSVR increases with increased cavity pressures.
Haemodynamic drivers of phasic flow patterns
In our study, detailed phasic haemodynamic analysis showed that the increased flow seen in diastole is caused by a reduction in microvascular resistance (Table 2), following ventricular relaxation and suction. This finding was also observed in the RCA and confirms that diastole is, across all vessels and territories, the period within the cardiac cycle which offers the minimal distal resistance for physiological assessment.
We also found that the magnitude of diastolic flow predominance both in the left and right coronary arteries is not meaningfully affected by the underlying severity of the stenosis being interrogated or by the presence of microvascular dysfunction. This is in contrast to previous studies which have generally focused on the LAD artery where a numerical correlation can be demonstrated81821. We have found a very weak or non-existent relationship between DSVR and lesion FFR and resistance (Figure 6). However, in a subset of 85 lesions which underwent revascularisation, we found that PCI led to a small but statistically significant increase in DSVR values both at rest (1.58±0.37 to 1.71±0.42, p=0.005) and during hyperaemia (1.55±0.51 to 2.02±0.99, p=0.03) in comparison with baseline. When we compared those vessels with angiographic stenosis to those without, we found a difference overall; however, the difference was reversed depending on the vessel territory being assessed. These findings suggest that DSVR cannot be used as an independent marker of stenosis severity in isolation, although further work is needed to characterise this relationship. De Waard et al18, looking at LAD-only vessels, reported a stronger relationship between DSVR and underlying FFR and demonstrated that such a relationship is driven largely by changes in diastolic haemodynamics. The methods used were identical, suggesting that this was a true biological difference when only the LAD is assessed. Ahmad et al26 recently showed that changes in DSVR pre- and post-transcatheter aortic valve implantation (TAVI) are, on the other hand, driven by changes in systolic flow. Diastole therefore appears to be a more epicardial or stenosis-specific period of the cardiac cycle, whilst systole appears to be more sensitive to changes in distal compression forces and haemodynamics.
Practical clinical implications of our findings
Our findings strongly suggest that, in clinical practice, invasive coronary stenosis and microvascular assessment should be performed and interpreted in the same way in both the left and the right coronary systems. This is particularly relevant to stenosis assessment and the application of phasic indices which utilise diastolic pressure ratios to identify flow-limiting lesions272829. Our data sugest that sampling a systolic window to increase sensitivity of ischaemia detection in the RCA is not necessary for the vast majority of cases.
An exception to that rule could potentially be made for small, non-dominant RCAs, which do not connect to any part of the left ventricular myocardium, as our sample of such vessels was very small. However, non-dominant RCAs are rarely (if ever) interrogated physiologically in the clinical setting, either for lesion or for microvascular function, which makes the haemodynamic patterns of such vessels largely clinically irrelevant.
Limitations
In this analysis we used values from the locked IDEAL study database to test our hypothesis. The study was not designed to answer the question we posed and so some data were not of the type that would have been ideal for this purpose. We compared phasic values for mean coronary artery flow velocity and not flow rate. However, because we used a ratio of velocities as a means of quantifying diastolic dominancy and, given that vessel area is unlikely to change significantly within the cardiac cycle, we believe our findings can be extrapolated to volumetric flow rate. This assumption of constant volume may not hold during hypereamia where there is vasodilatation; however, we suspect that this change would further favour diastolic flow due to systolic compression. We also used the portion of mid to late diastole corresponding to the wave-free period to count for diastolic pressure and flow because, again, this is what was collected in the original study. Having said this, the majority of flow occurs in this portion of diastole and therefore the most important information is contained therein.
We were only able to analyse a small number of non-dominant and co-dominant RCA vessels in this study because our sample was drawn from clinical application of invasive physiology (3 and 9, respectively, out of 101). If more were included it would give us a better indication of the effect of vessel dominance on coronary flow parameters. Furthermore, as suggested by the findings of Akasaka and colleagues25, it is possible that a more detailed map of DSVR at different positions inside the main vessels, and within their branches, would show more variation. Our sample was limited by selection bias as not all patients with RCA lesions would have been interrogated. Those with non-dominant RCAs are probably under-represented. This, however, is reflective of clinical practice. Also, the sensor position was not documented in all cases. Previous studies have suggested that proximal versus distal location of the sensor is important in determining the phasic pattern of flow79. A study to investigate changes prospectively in within-patient DSVR pullback with assessment of subtended left ventricular mass is being planned to clarify this issue further.
Conclusions
Coronary flow in patients with coronary artery disease is predominantly diastolic. This pattern applies to both left and right coronary arteries. Diastolic flow predominance was observed in non-dominant, co-dominant and dominant right coronary arteries, and was not affected by the underlying degree of stenosis or microvascular disease severity.
Impact on daily practice
Our findings suggest that DSVR cannot be used as an independent marker of stenosis severity in isolation and that, in routine clinical practice, invasive coronary stenosis and microvascular assessment should be performed and interpreted in the same way in both the left and the right coronary systems. This is particularly relevant to stenosis assessment and the application of phasic indices which utilise diastolic pressure ratios to identify flow-limiting lesions.
Funding
The authors are grateful for the infrastructural support from the National Institute of Health Research (NIHR) Biomedical Research Centre based at Imperial College Healthcare NHS Trust and Imperial College London.
C. Rajkumar is a PhD Training Fellow at the Medical Research Council (Grant Number MR/S021108/1). J.P Howard is a PhD Training Fellow at the Wellcome Trust (Grant number 212183/Z/18/Z). A. Nowbar is supported by the NIHR Imperial Biomedical Research Centre (BRC).
Conflict of interest statement
Outside of the submitted work J. Mayet has a patent for iFR technology for assessment of coronary stenoses with royalties paid to Imperial Innovations, C.M. Cook has received personal fees from Philips, and S.S. Nijjer reports that he has received honoraria for speaking on Coronary Physiology from Philips. H. Seligman has received educational funding from Amgen. J.E. Davies reports grants and personal fees from Philips Volcano and has a patent IP pertaining to iFR technology with royalties paid to Philips Volcano. R. Al-Lamee has received speaking fees from Philips Volcano. R. Petraco has acted as consultant to Philips. T.P. van de Hoef has served as a speaker at educational events organised by Philips Volcano, St. Jude Medical (now Abbott), and Boston Scientific. J.J. Piek reports personal fees and non-financial support from Philips Volcano. S. Sen reports speaking fees from Philips, Pfizer and AstraZeneca and an educational grant from Medtronic. N. van Royen reports grants from Philips, Abbott, and Biotronik and personal fees from Medtronic. The other authors have no conflicts of interest to declare.
Supplementary data
To read the full content of this article, please download the PDF.