Abstract
Background: Absolute hyperaemic coronary blood flow (Q, in mL/min) and resistance (R, in Wood units [WU]) can be measured invasively by continuous thermodilution.
Aims: The aim of this study was to assess normal reference values of Q and R.
Methods: In 177 arteries (69 patients: 25 controls, i.e., without identifiable coronary atherosclerosis; 44 patients with mild, non-obstructive atherosclerosis), thermodilution-derived hyperaemic Q and total, epicardial, and microvascular absolute resistances (Rtot, Repi, and Rmicro) were measured. In 20 controls and 29 patients, measurements were obtained in all three major coronary arteries, thus allowing calculations of Q and R for the whole heart. In 15 controls (41 vessels) and 25 patients (71 vessels), vessel-specific myocardial mass was derived from coronary computed tomography angiography.
Results: Whole heart hyperaemic Q tended to be higher in controls compared to patients (668±185 vs 582±138 mL/min, p=0.068). In the left anterior descending coronary artery (LAD), hyperaemic Q was significantly higher (293±102 mL/min versus 228±71 mL/min, p=0.004) in controls than in patients. This was driven mainly by a difference in Repi (43±23 vs 83±41 WU, p=0.048), without significant differences in Rmicro. After adjustment for vessel-specific myocardial mass, hyperaemic Q was similar in the three vascular territories (5.9±1.9, 4.9±1.7, and 5.3±2.1 mL/min/g, p=0.44, in the LAD, left circumflex and right coronary artery, respectively).
Conclusions: The present report provides reference values of absolute coronary hyperaemic Q and R. Q was homogeneously distributed in the three major myocardial territories but the large ranges of observed hyperaemic values of flow and of microvascular resistance preclude their clinical use for inter-patient comparison.
Introduction
Coronary blood flow is essential for proper myocardial function1,2. Microvascular resistance constantly matches coronary flow to the needs of the myofilaments3,4,5.
Fractional flow reserve (FFR) derived from pressure measurements6,7 determines the contribution of epicardial stenoses to alterations of myocardial perfusion, and has therefore been recognised as the standard of reference to guide “revascularisation” of epicardial lesions8.
In contrast, assessing the coronary microcirculation requires measurements of microvascular resistances. The index of microcirculatory resistance (IMR)9, a bolus thermodilution-based technique, has been shown to be useful for predicting clinical outcome in patients immediately after an acute myocardial infarction10. It recently received a level IIa recommendation in the European Society of Cardiology Guidelines for the investigation of patients with suspected microvascular dysfunction and in patients with chronic coronary syndromes11. So far, there has been no direct invasive measurement tool to quantify the function of the microcirculation in absolute terms in humans. This is the main reason why there has been limited clinical interest in the study and the treatment of coronary microcirculatory dysfunction12.
We described and validated a method based on continuous thermodilution that enables the quantification of absolute coronary blood flow (expressed in mL/min) and absolute microvascular resistance (expressed in mmHg/L/min or Wood units [WU])13. Recent technical improvements have made this approach reproducible14 and easy to implement in the catheterisation laboratory15,16. The accuracy of thermodilution-derived myocardial flow and resistance measurements was confirmed by comparison with [15O]H2O PET-derived flow and resistance17.
A necessary prerequisite for its clinical application is to define a range of normal values.
Accordingly, the goals of the present study were to establish ranges of absolute flow and resistance by continuous coronary thermodilution in normal individuals and in patients with mild, non-obstructive coronary atherosclerosis.
Methods
The study was a prospective registry performed in two hospitals. The study protocol was approved by the institutional review boards.
PATIENTS
Patients were included in one of two groups. Group 1 comprised individuals with normal coronary arteries (n=25). These individuals were considered to have a truly normal coronary circulation if they had a strictly normal coronary angiogram, normal left ventricular (LV) function, no valvular disease, an FFR >0.80 in all coronary arteries and, when available, a normal coronary computed tomography angiography (CTA) with an Agatston score of zero. These patients were referred to as “normals”.
Patients in Group 2 had mild, non-obstructive coronary atherosclerosis (n=44). Such patients were included if they had proven coronary atherosclerosis (either at CT or at coronary angiography, or both) but no focal stenosis more than 30% by visual estimation.
In 20 out of 25 normals and in 29 out of 45 patients with atherosclerosis, flow and resistance measurements were performed in all three major coronary arteries in case of a right dominant arterial system, or only in the left anterior descending coronary artery (LAD) and the left circumflex coronary artery (LCX) in case of a non-dominant right coronary artery (RCA). In these patients, flow and resistance of the whole heart could be assessed.
CT SCANNING FOR CALCULATION OF MYOCARDIAL MASS
Forty patients (15 normals and 25 patients with mild atherosclerosis) underwent a coronary CT angiogram performed on a 256-slice scanner (Brilliance iCT [Philips Healthcare, Best, the Netherlands], or SOMATOM Flash [Siemens Healthineers, Forchheim, Germany]) which allowed calculation of the subtended myocardial mass for each coronary territory18,19 by an independent core lab (HeartFlow Inc, Redwood City, CA, USA) blinded to the results of the invasive measurements. The methods have been detailed elsewhere20.
CATHETERISATION
A 6 Fr arterial sheath was introduced into the radial or femoral artery, 100 U of heparin/kg of body weight was administered intravenously and intracoronary nitroglycerine (0.2 mg) was administered. A pressure/temperature sensor-tipped guidewire (PressureWire™ X; Abbott Vascular, Santa Clara, CA, USA) was zeroed, passed through the guiding catheter and, after proper equalisation with central aortic pressure, advanced into the distal part of the coronary artery. First, the FFR value was measured. Then, a dedicated monorail infusion catheter (RayFlow®; Hexacath, Paris, France) was connected to an infusion pump (Medrad Stellant; Medrad Inc, Warrendale, PA, USA), and flushed with saline at room temperature. The RayFlow catheter was advanced over the guidewire into the proximal segment of the artery to be measured. Details of the procedure have been described previously16. A typical tracing is shown in Figure 1. All coronary pressure and temperature tracings are wirelessly transmitted and analysed by a dedicated console equipped with a software (CoroFlow™; Coroventis, Uppsala, Sweden) that automatically calculates coronary blood flow (Q) and microvascular resistance (Rmicro).
![Figure 1. Example of simultaneous pressures (upper tracings, Pa in red, Pd in green) and temperature recording (lower tracing, in blue) in a coronary artery. First, the temperature is “zeroed” (arrow A). This means that the body temperature prior to the measurement is considered as the zero. Soon after the start of the infusion of saline at room temperature (arrow B), the temperature measured in the distal artery (T) decreases and stabilises at −0.50°C below the zero line and the Pd starts to decrease slightly, indicating the presence of a higher coronary flow. Then, the sensor is pulled back (arrow C) and placed just in front of the inner holes of the RayFlow catheter (i.e., 2.5 mm distal to the marker on the RayFlow). This translates into a sharp decline of the temperature that stabilises at −4.36°C. This value corresponds to the difference between body temperature and the saline at the location where saline enters the coronary artery (Ti). Simultaneously, an increase in Pd is noted exceeding Pa. This is related to the fact that the pressure sensor is now located in the lumen of the infusion catheter and is influenced by the pressure delivered by the infusion pump. Finally, the infusion is stopped (arrow D), allowing both the pressure and the temperature to return to baseline. All relevant physiologic parameters (FFR, Pd, Pa, infusion rate of saline, distal coronary temperature [T], infusion temperature [Ti], actual flow [Q], normalised flow [Qnorm] and minimal microvascular resistance [Rmicro]) are displayed instantaneously on the screen of any monitor by the CoroFlow software.](https://eurointervention.pcronline.com/storage/issues/EIJ191e/053_EIJ-D-20-00684_Fournier_191e/medias/221546/01_Fournier_191e.jpg)
Figure 1. Example of simultaneous pressures (upper tracings, Pa in red, Pd in green) and temperature recording (lower tracing, in blue) in a coronary artery. First, the temperature is “zeroed” (arrow A). This means that the body temperature prior to the measurement is considered as the zero. Soon after the start of the infusion of saline at room temperature (arrow B), the temperature measured in the distal artery (T) decreases and stabilises at −0.50°C below the zero line and the Pd starts to decrease slightly, indicating the presence of a higher coronary flow. Then, the sensor is pulled back (arrow C) and placed just in front of the inner holes of the RayFlow catheter (i.e., 2.5 mm distal to the marker on the RayFlow). This translates into a sharp decline of the temperature that stabilises at −4.36°C. This value corresponds to the difference between body temperature and the saline at the location where saline enters the coronary artery (Ti). Simultaneously, an increase in Pd is noted exceeding Pa. This is related to the fact that the pressure sensor is now located in the lumen of the infusion catheter and is influenced by the pressure delivered by the infusion pump. Finally, the infusion is stopped (arrow D), allowing both the pressure and the temperature to return to baseline. All relevant physiologic parameters (FFR, Pd, Pa, infusion rate of saline, distal coronary temperature [T], infusion temperature [Ti], actual flow [Q], normalised flow [Qnorm] and minimal microvascular resistance [Rmicro]) are displayed instantaneously on the screen of any monitor by the CoroFlow software.
CALCULATIONS OF FLOW AND RESISTANCE
Absolute volumetric coronary blood flow (Q) can now be calculated and expressed in mL/min. This has been described previously and validated in vitro16, in animals13 and in humans13. The simplified equation of continuous thermodilution-derived coronary blood flow (Q) is as follows:

where Qi is the infusion rate of saline through the RayFlow catheter in mL/min; T is the difference in temperature between the blood mixed with saline in the distal part of the artery and the blood temperature before infusion of saline, and Ti is the difference in temperature between saline when it enters the coronary circulation and the temperature of blood. The constant 1.08 relates to the difference between the specific heats and densities of blood and saline21.
Absolute resistances are calculated by analogy of Ohm’s law as the ratio of pressure and flow and expressed in mmHg/L/min, or WU. As further explained in Supplementary Appendix 1 and Supplementary Figure 1-Supplementary Figure 3, in each coronary artery the resistance can be calculated for the entire circulation (Figure 2), i.e., the sum of the epicardial and microvascular compartments (Rtot), and separately for the epicardial segment (Repi) and for the microcirculation (Rmicro) as follows (abbreviations as here above):
Total coronary resistance: 
Epicardial resistance: 
Microvascular resistance: 
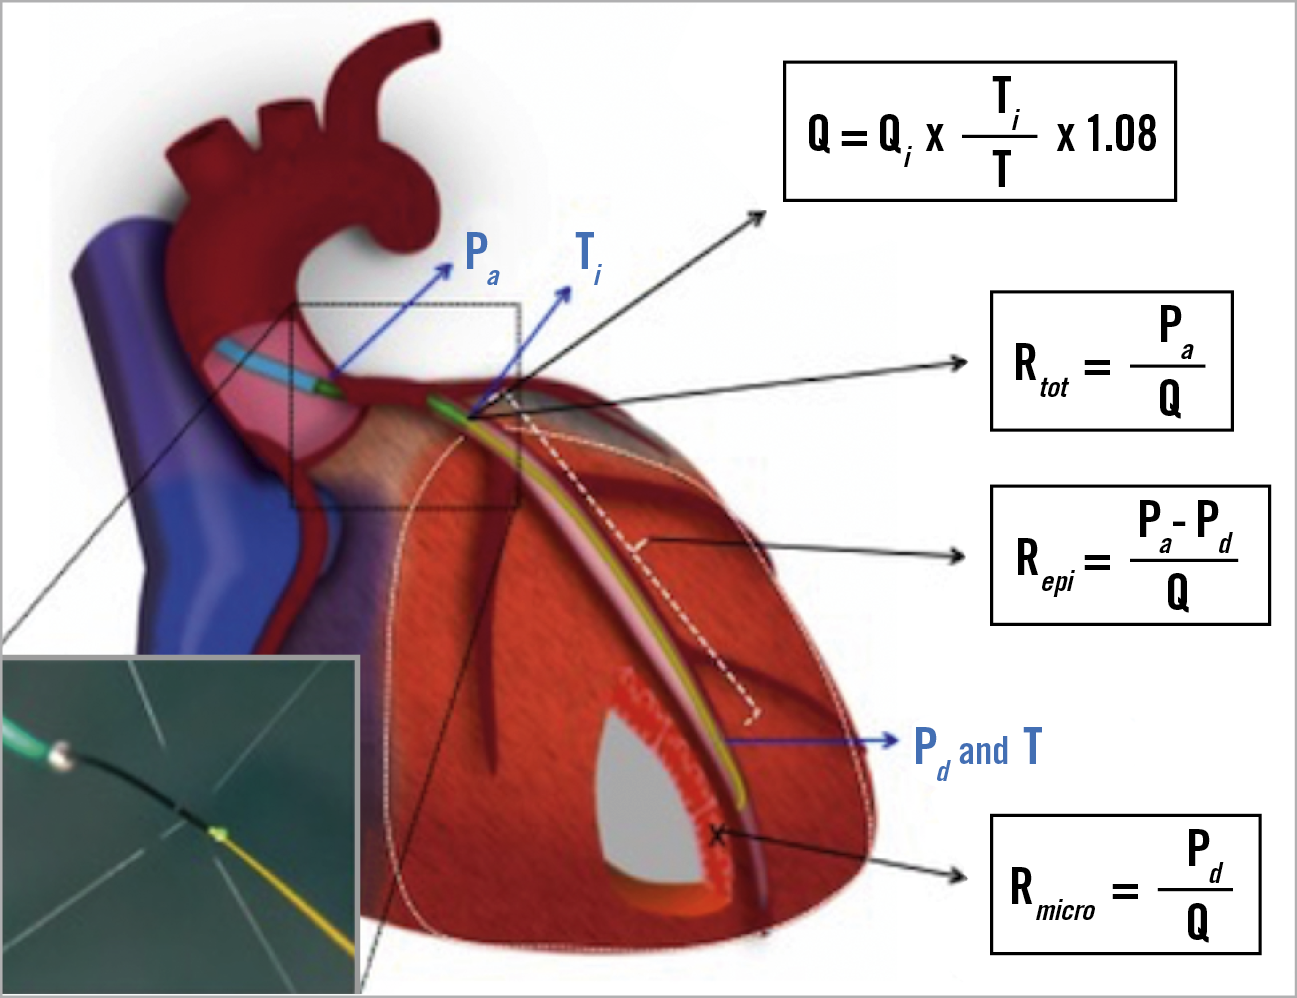
Figure 2. Comprehensive physiological framework of the entire coronary circulation. In the lower left corner, the infusion of saline through the dedicated catheter is shown.
STATISTICAL ANALYSIS
Continuous variables with normal distribution are expressed as the mean±standard deviation and non-normally distributed variables as median and interquartile range. The normal ranges of Q and R are presented as the 5th and 95th percentiles. Categorical variables are expressed as counts and percentages. Continuous variables were compared using analysis of variance (ANOVA) or Kruskal-Wallis tests according to their distribution. Categorical variables were compared with the chi-square or Fisher’s test, as appropriate. All analyses were performed using SPSS software, Version 24.0 (IBM Corp., Armonk, NY, USA) and figures were realised with Prism Mac 6.0h (GraphPad Software, La Jolla, CA, USA).
Results
PATIENT CHARACTERISTICS
A total of 177 arteries in 69 patients (25 normals and 44 patients with mild atherosclerosis) were studied. The baseline characteristics are detailed in Supplementary Table 1. There were no complications associated with the procedure.
The values of FFR were higher in angiographically normal arteries than in mildly atherosclerotic arteries (0.95±0.03 versus 0.91±0.06, respectively, p=0.001). These differences were driven mainly by the FFR values in the LAD.
ABSOLUTE CORONARY FLOW VALUES
Details of all values of coronary flow in normals and in patients with mild atherosclerosis as stratified by artery are displayed in Supplementary Table 2.
Hyperaemic coronary flow for the whole heart, i.e., the sum of the flow in all three major coronary arteries, tended to be higher in normals than in patients with mild atherosclerosis (668±185 mL/min versus 582±138 mL/min, respectively, p=0.068) (Figure 3A).
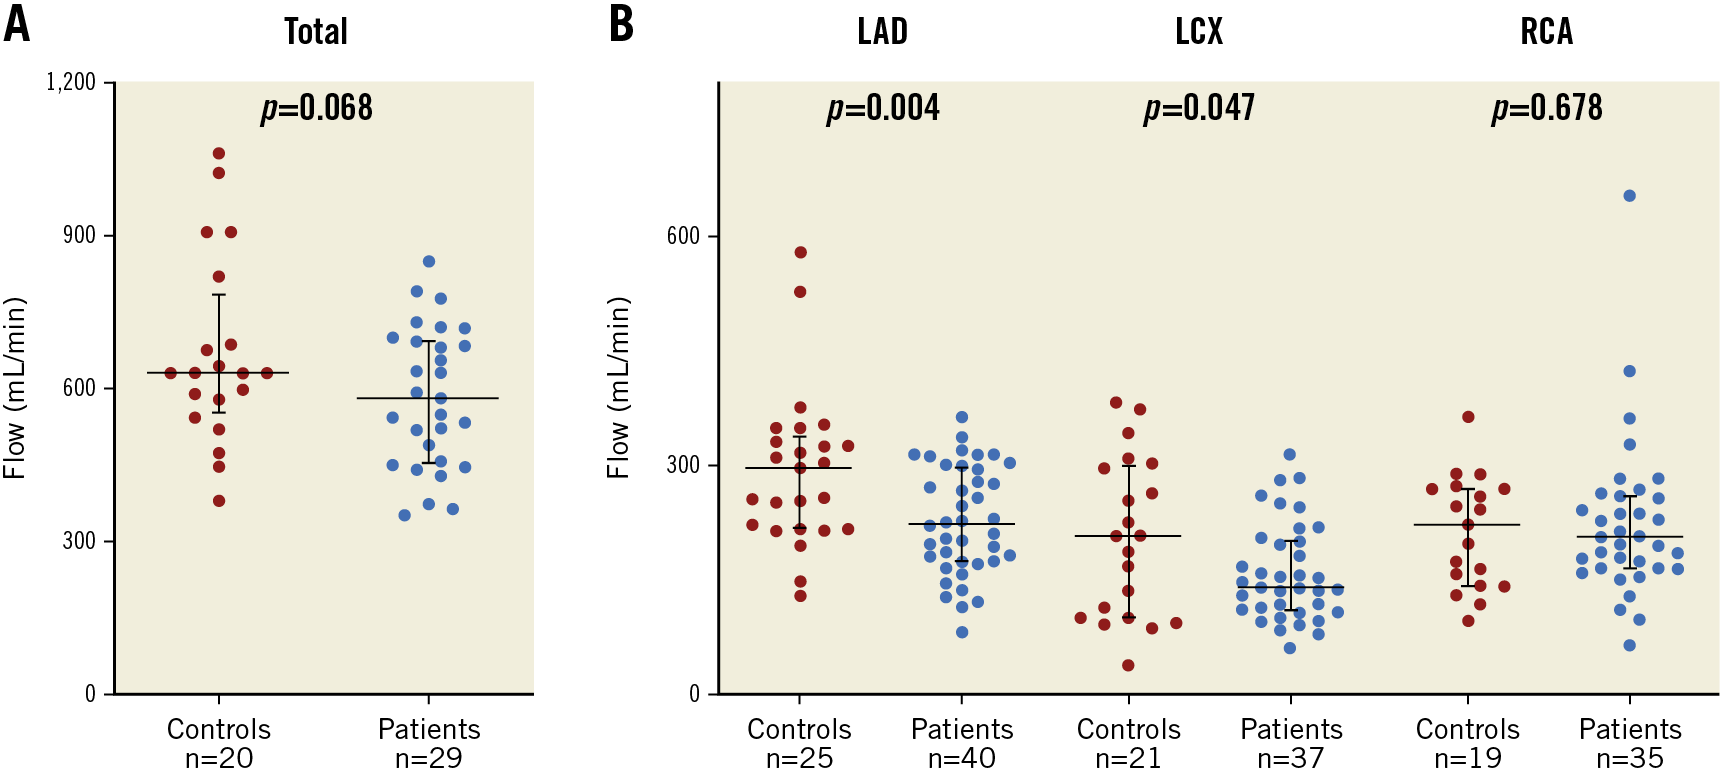
Figure 3. Absolute coronary artery blood flow. A) Individual values of whole heart coronary blood flow in normals and in patients with mild, non-obstructive atherosclerosis, i.e., sum of the flow in the LAD, the LCX and the RCA. B) Individual values of flow as stratified by coronary artery in normals and in patients with mild atherosclerosis.
Values of absolute coronary blood flow stratified by arteries are shown in Figure 3B. In the LAD, absolute hyperaemic flow was higher in normals than in patients with atherosclerosis (293±102 mL/min, versus 228±71 mL/min, respectively, p=0.004) as was the case in the LCX (p=0.047). Large ranges of flow values were observed when stratified by vessel.
TOTAL CORONARY RESISTANCE
Details are displayed in Supplementary Table 2.
Hyperaemic total resistance for the whole heart was numerically, but not significantly, lower in normals than in patients with mild atherosclerosis (161±45 WU versus 177±48 WU, respectively, p=0.244) (Figure 4A). In the LAD, absolute total coronary resistance was lower in normals than in patients with mild atherosclerosis (379±147 WU versus 462±169 WU, respectively, p=0.048), while the difference did not reach statistical significance for the LCX and the RCA. Large ranges of hyperaemic flow and resistance values were observed when stratified by vessel (Figure 4B, Supplementary Table 2).
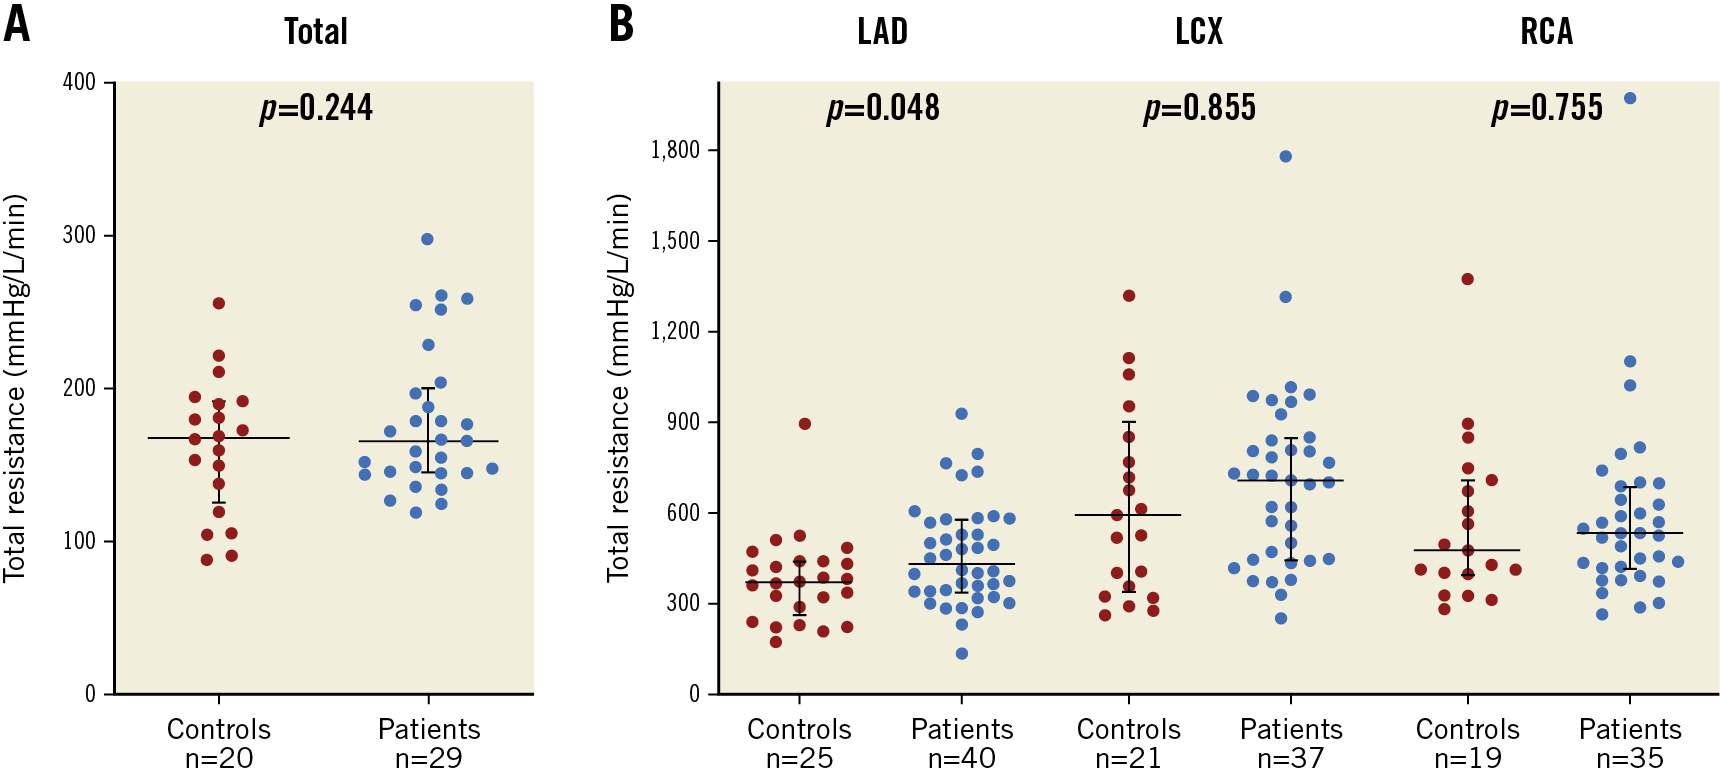
Figure 4. Absolute coronary artery total resistance. A) Whole heart total coronary resistance in normals and in patients with mild, non-obstructive atherosclerosis. B) Individual values of total resistance as stratified by coronary artery in normals and in patients with atherosclerosis (mean±SD).
EPICARDIAL AND MICROVASCULAR RESISTANCE
Rtot, Repi and Rmicro calculated for the LAD in normals and in patients with atherosclerosis are displayed in Figure 5. Repi was significantly lower in normals than in patients with mild atherosclerosis (p<0.001), which also reflects the higher FFR values measured in normals. There was no significant difference in Rmicro. In both groups of patients, Rmicro was markedly higher than Repi.
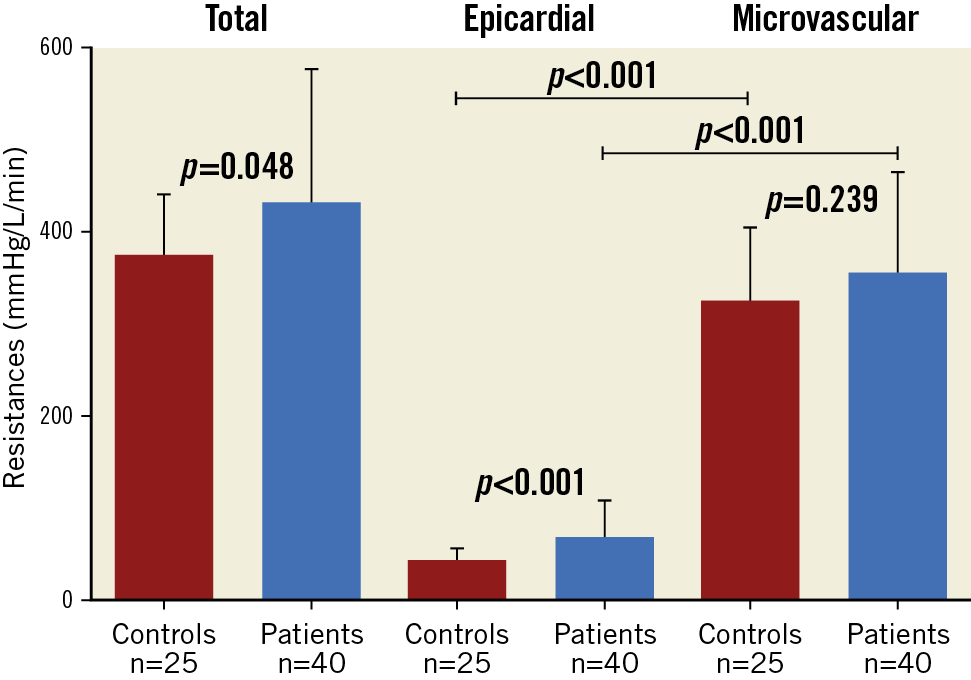
Figure 5. Total, epicardial, and microvascular resistances for the LAD in normals (red bars) and in patients with mild, non-obstructive atherosclerosis (blue bars) (mean±SD).
ABSOLUTE CORONARY FLOW AND RESISTANCE VALUES NORMALISED FOR MYOCARDIAL MASS (Supplementary Table 2)
In normals, after adjustment for the mass, the average values of Q observed in the three different vascular territories were similar (5.9±1.9, 4.9±1.7, and 5.3±2.1 mL/min/g, for the LAD, the LCX and the RCA, respectively, p=NS). Rmicro was lower in the anterior wall than in the two other territories (15.5±5.6, 20.6±5.1, and 21.7±6.4 mL/min/g, for the LAD, the LCX and the RCA, respectively, p<0.05).
Discussion
SUMMARY OF FINDINGS
The present report provides ranges of absolute values of hyperaemic Q and R assessed by continuous thermodilution in the coronary circulation in controls and in patients with mild, non-obstructive atherosclerosis. The main findings are as follows. 1) Hyperaemic flow of the whole heart is approximately 670 mL/min and total minimal microvascular resistance approximately 150 WU. 2) After normalisation for myocardial mass, absolute hyperaemic flow (mL/min/g) was similar among the three vascular territories. In contrast, Rmicro was slightly lower in the LAD territory as compared to the LCX and RCA. 3) Total coronary hyperaemic Q was slightly lower and R slightly higher in patients with mild atherosclerosis as compared to controls. 4) Confirming earlier experimental studies by Gould22 and by Chilian23, the major part of coronary resistance in humans is located in the microvasculature, even during hyperaemia. 5) The wide range of hyperaemic flow and minimal Rmicro precludes their use for inter-patient comparison, indicating that a more unequivocal index of Rmicro is needed.
THERMODILUTION-DERIVED FLOW
Absolute volumetric coronary flow (in mL/min) can be measured by continuous thermodilution using the hypothermic effect of saline at room temperature (negative temperature as compared to body temperature) as an indicator13. Recent technical improvements allow swift, safe, reproducible and accurate measurements14,16,24,25. These measurements can be obtained in the setting of coronary angiography and require a pressure/temperature sensor-tipped wire and a dedicated infusion catheter.
NORMALS VERSUS PATIENTS WITH MILD ATHEROSCLEROSIS
Flow was slightly lower and resistance slightly higher in patients with mild atherosclerosis. At the level of the whole heart, these differences were not statistically significant as the sample size was underpowered to detect such differences. In addition, there was a large range of values of Q and R, as expected from the large variation in size of the coronary artery and the perfusion territory. In the LAD, hyperaemic flow was significantly larger in normals than in patients with atherosclerosis. Microvascular and epicardial resistances were higher in patients with mild atherosclerosis than in normals.
Our data suggest that epicardial atherosclerosis is not necessarily associated with the presence of microvascular dysfunction. Melikian et al26 found a higher value of the IMR in patients with coronary artery disease compared to patients without coronary stenoses. However, a large overlap between IMR values of both groups was found, as was the case for absolute flow and resistance in the present study. These data and other data27 suggest that, in many patients, a functional disconnect between epicardial atherosclerosis and microvascular dysfunction can be found.
VARIABILITY OF ABSOLUTE HYPERAEMIC FLOW AND RESISTANCE
The main factor which may explain the large ranges in flow and resistance values is their dependence on myocardial mass. A unique advantage of positron emission tomography (PET)-derived flow and resistance is to express these measurements per unit of tissue mass (i.e., mL/min/g of tissue). Indeed, when adjusting Q and R for mass, similar values were found for the three different myocardial territories within the same patients. Yet, inter-individual values for Q and R, even when adjusted for mass, showed a considerable range28,29. In our study, the inter-individual variability of hyperaemic flow values was in the same order of magnitude as with PET. Therefore, it is likely that the large ranges of hyperaemic flow values also found in the present study do correspond to a naturally occurring large variability of normal hyperaemic values. Further confirming the hypothesis of a natural variation of hyperaemic myocardial perfusion, rather than that of measurement inaccuracies, Everaars et al found hyperaemic flow values ranging from approximately 50 to 450 mL/min in arteries with mild atherosclerosis. These values of flow and microvascular resistance correlated very closely with the corresponding values obtained by PET. These data suggest that thermodilution-derived measurements are indeed accurate and therefore not responsible for this variability, and that hyperaemic coronary flow and microvascular resistance are highly variable from one individual to another. Driving coronary pressure is another factor that may explain the variability of flow values. During hyperaemia, flow is directly related to driving pressure6,30. The unique advantage of thermodilution-derived resistance measurements is to account for distal coronary pressure. This makes it possible to calculate separately microvascular resistance per territory even in the presence of decreased driving pressure. This is particularly important in patients with diffuse atherosclerosis in whom distal coronary pressure may be markedly lower than central aortic pressure, especially during hyperaemia.
Limitations
The present study has a number of limitations. First, despite the fact that thermodilution-derived flow values have been validated in vitro16, in animals13 and in humans17, hyperaemic perfusion values in the present study exceeded those derived from PET. Although speculative, several factors might play a role. Hyperaemia induced by saline infusion through the RayFlow catheter has been found to be consistently more potent than that induced by IV or IC adenosine15. In addition, it might be necessary to add the volume of saline that is infused as an indicator to the actual blood flow (even though in a fully dilated vascular system it is less likely to accommodate this additional volume). Also, the calculation of LV mass is based on a different principle than with PET. In the present study, we measured per territory mass derived from CT LV mass calculation, whereas with PET the measurement is performed per unit of volume of tissue which is then converted to mass using constant equations. The abovementioned factor may contribute to help to explain the relatively higher values of thermodilution-derived flow compared to PET.
Second, measurements were performed in arteries without focal stenoses, and should therefore not be extrapolated to territories perfused by significantly stenotic arteries. In practice, however, severe focal stenoses should be treated first before searching for microvascular disease as they often represent the main clinical problem for the patients.
Third, patients with atherosclerosis in the present study had a mild form of disease that might explain the absence of significant difference in Rmicro between the groups. It is likely that, in more severe forms of atherosclerotic disease, the values of Rmicro might have been higher.
Fourth, the presence of the RayFlow catheter in the proximal part of the artery tends to create a small gradient, especially during high coronary blood flow. Therefore, in this study, the actual flow has been slightly underestimated. The haemodynamic impact of the RayFlow catheter on the measured flow is corrected by the Qnorm, a metric that normalises the measured flow for the FFR.
Fifth, it should be realised that, when applying continuous thermodilution to measure absolute resistance, Q is measured at the tip of the infusion catheter, whereas Pd is measured more distal in the coronary artery. Therefore, small mistakes can be made in the calculation of resistances in case of atherosclerotic disease between the tip of the infusion catheter and the location where Pd is measured or when an epicardial stenosis is present in a side branch (Supplementary Figure 2).
Conclusions
The present study is the first direct invasive quantification of total as well as vessel-specific coronary blood flow and resistance in the human heart. The data show that whole heart hyperaemic Q equals approximately 670 mL/min and tended to be higher in controls as compared to patients with mild, non-obstructive atherosclerosis. In normal individuals, total resistance of the coronary circulation was approximately 150 WU. Q was homogeneously distributed over the three territories.
The wide range of flow and microvascular resistance values – even after correction for myocardial mass – suggests that further correction for resting flow and resistance values is needed to allow meaningful inter-patient comparisons. However, the ease and the accuracy of invasive flow and resistance measurements make them particularly well suited for intra-patient clinical follow-up and to assess the effect of interventions on the coronary microvasculature within the same patient.
|
Impact on daily practice Using continuous coronary thermodilution to quantify absolute coronary flow, the present study provides, for the first time, ranges of reference values for hyperaemic coronary flow (in mL/min) and microvascular resistance (in Wood units). Overall flow was lower and microvascular resistance higher in patients with mild atherosclerosis than in normal individuals. Yet, the wide range of hyperaemic flow and microvascular resistance precludes their use for inter-patient comparison and indicates that a more unequivocal index of microvascular resistance is needed. |
Funding
S. Fournier was supported by grants from CardioPath, Fondation Vaudoise de Cardiologie, and Fondation Vaudoise de Cardiologie Interventionnelle. G. Di Gioia was supported by a grant from CardioPath.
Conflict of interest statement
S. Fournier reports personal fees from Bayer and CathWorks. B. De Bruyne reports grants from Abbott, Boston Scientific, and Biotronik AG, personal fees from Abbott, Opsens, and Boston Scientific, and other from Siemens, GE, Bayer, Philips, HeartFlow, Edwards Lifesciences, and Ceyliad, during the conduct of the study. C. Collet reports grants from HeartFlow, Abbott Vascular, Biosensors, and Pie Medical, and consultancy fees from Abbott Vascular, HeartFlow, Opsens and Philips. He serves as a member of the advisory board of Abbott Vascular, Pie Medical and Opsens. N. Pijls reports grants from Abbott, and Hexacath, personal fees from Abbott, Opsens, GE, and Biosensors, and other from GE, Philips, HeartFlow, and ASML, during the conduct of the study. The other authors have no conflicts of interest to declare.
Supplementary data
To read the full content of this article, please download the PDF.
