Abstract
Background: A bolus thermodilution-derived index of microcirculatory resistance (IMR) has emerged as the standard for assessing coronary microvascular dysfunction (CMD). Continuous thermodilution has recently been introduced as a tool to quantify absolute coronary flow and microvascular resistance directly. Microvascular resistance reserve (MRR) derived from continuous thermodilution has been proposed as a novel metric of microvascular function, which is independent of epicardial stenoses and myocardial mass.
Aims: We aimed to assess the reproducibility of bolus and continuous thermodilution in assessing coronary microvascular function.
Methods: Patients with angina and non-obstructive coronary artery disease (ANOCA) at angiography were prospectively enrolled. Bolus and continuous intracoronary thermodilution measurements were obtained in duplicate in the left anterior descending artery (LAD). Patients were randomly assigned in a 1:1 ratio to undergo either bolus thermodilution first or continuous thermodilution first.
Results: A total of 102 patients were enrolled. The mean fractional flow reserve (FFR) was 0.86±0.06. Coronary flow reserve (CFR) calculated with continuous thermodilution (CFRcont) was significantly lower than bolus thermodilution-derived CFR (CFRbolus; 2.63±0.65 vs 3.29±1.17; p<0.001). CFRcont showed a higher reproducibility than CFRbolus (variability: 12.7±10.4% continuous vs 31.26±24.85% bolus; p<0.001). MRR showed a higher reproducibility than IMR (variability 12.4±10.1% continuous vs 24.2±19.3% bolus; p<0.001). No correlation was found between MRR and IMR (r=0.1, 95% confidence interval: −0.09 to 0.29; p=0.305).
Conclusions: In the assessment of coronary microvascular function, continuous thermodilution demonstrated significantly less variability on repeated measurements than bolus thermodilution.
Introduction
Even in the absence of epicardial stenosis, coronary microvascular dysfunction (CMD) is associated with anginal complaints, reduced quality of life, and a worse prognosis1. The reported prevalence of CMD is highly variable23. Arguably, this variability may relate to the heterogeneous clinical definitions of CMD and to the absence of specific, quantitative, and accurate tools for assessing coronary microvascular resistance.
The quintessential metric of coronary microcirculation is its absolute resistance (Rμ). In current practice, microvascular resistance is estimated by combining distal coronary pressure and indirect indices of flow, such as mean transit time456. For its ease of application and its outcome prediction capacity in the setting of acute coronary syndromes7, the index of microcirculatory resistance (IMR) obtained from bolus thermodilution has emerged as one of the reference standards to define CMD.
More recently, continuous intracoronary thermodilution has been proven to precisely quantify volumetric coronary flow (in mL/min) and absolute microcirculatory resistance (in Wood units [WU])8910. Consequently, the microvascular resistance reserve (MRR) obtained with this technique has been proposed as a specific metric for assessing microvascular function independently from epicardial resistance11. The accuracy of continuous thermodilution-derived coronary flow and resistance measurements have been validated in vitro9 and in vivo12. Before any measurement tools can be used for research or in a clinical setting, their test-retest reliability must be established. The objective of the present study was to perform a head-to-head comparison of the reproducibility of bolus and continuous thermodilution for functional assessment of coronary microcirculation.
Materials and methods
Study design
From January 2021 to January 2022, patients with angina and non-obstructive coronary artery (ANOCA) at coronary angiography were included in the study. Exclusion criteria were clinical signs or symptoms of congestive heart failure, severe valvular heart disease requiring either surgical or percutaneous intervention, a history of coronary artery bypass graft, the presence of an angiographically significant epicardial stenosis (diameter stenosis [DS] >50% by visual assessment) and a tortuous coronary anatomy in which wire manipulation could be complex. In all patients, microvascular function was assessed in the left anterior descending coronary artery (LAD) with bolus and continuous thermodilution. All the measurements were performed in duplicate. Patients were randomly assigned in a 1:1 ratio to undergo a bolus thermodilution first or a continuous thermodilution first. After each measurement, a 2-minute waiting period was mandated before the next measurement. The study design and the main findings are summarised in the Central illustration.
The protocol was approved by the institutional review board (IRB of the Onze-Lieve-Vrouw Clinic in Aalst, Belgium, Registration number: 2020/033). All patients provided informed consent. The data supporting the findings of this study are available upon reasonable request.
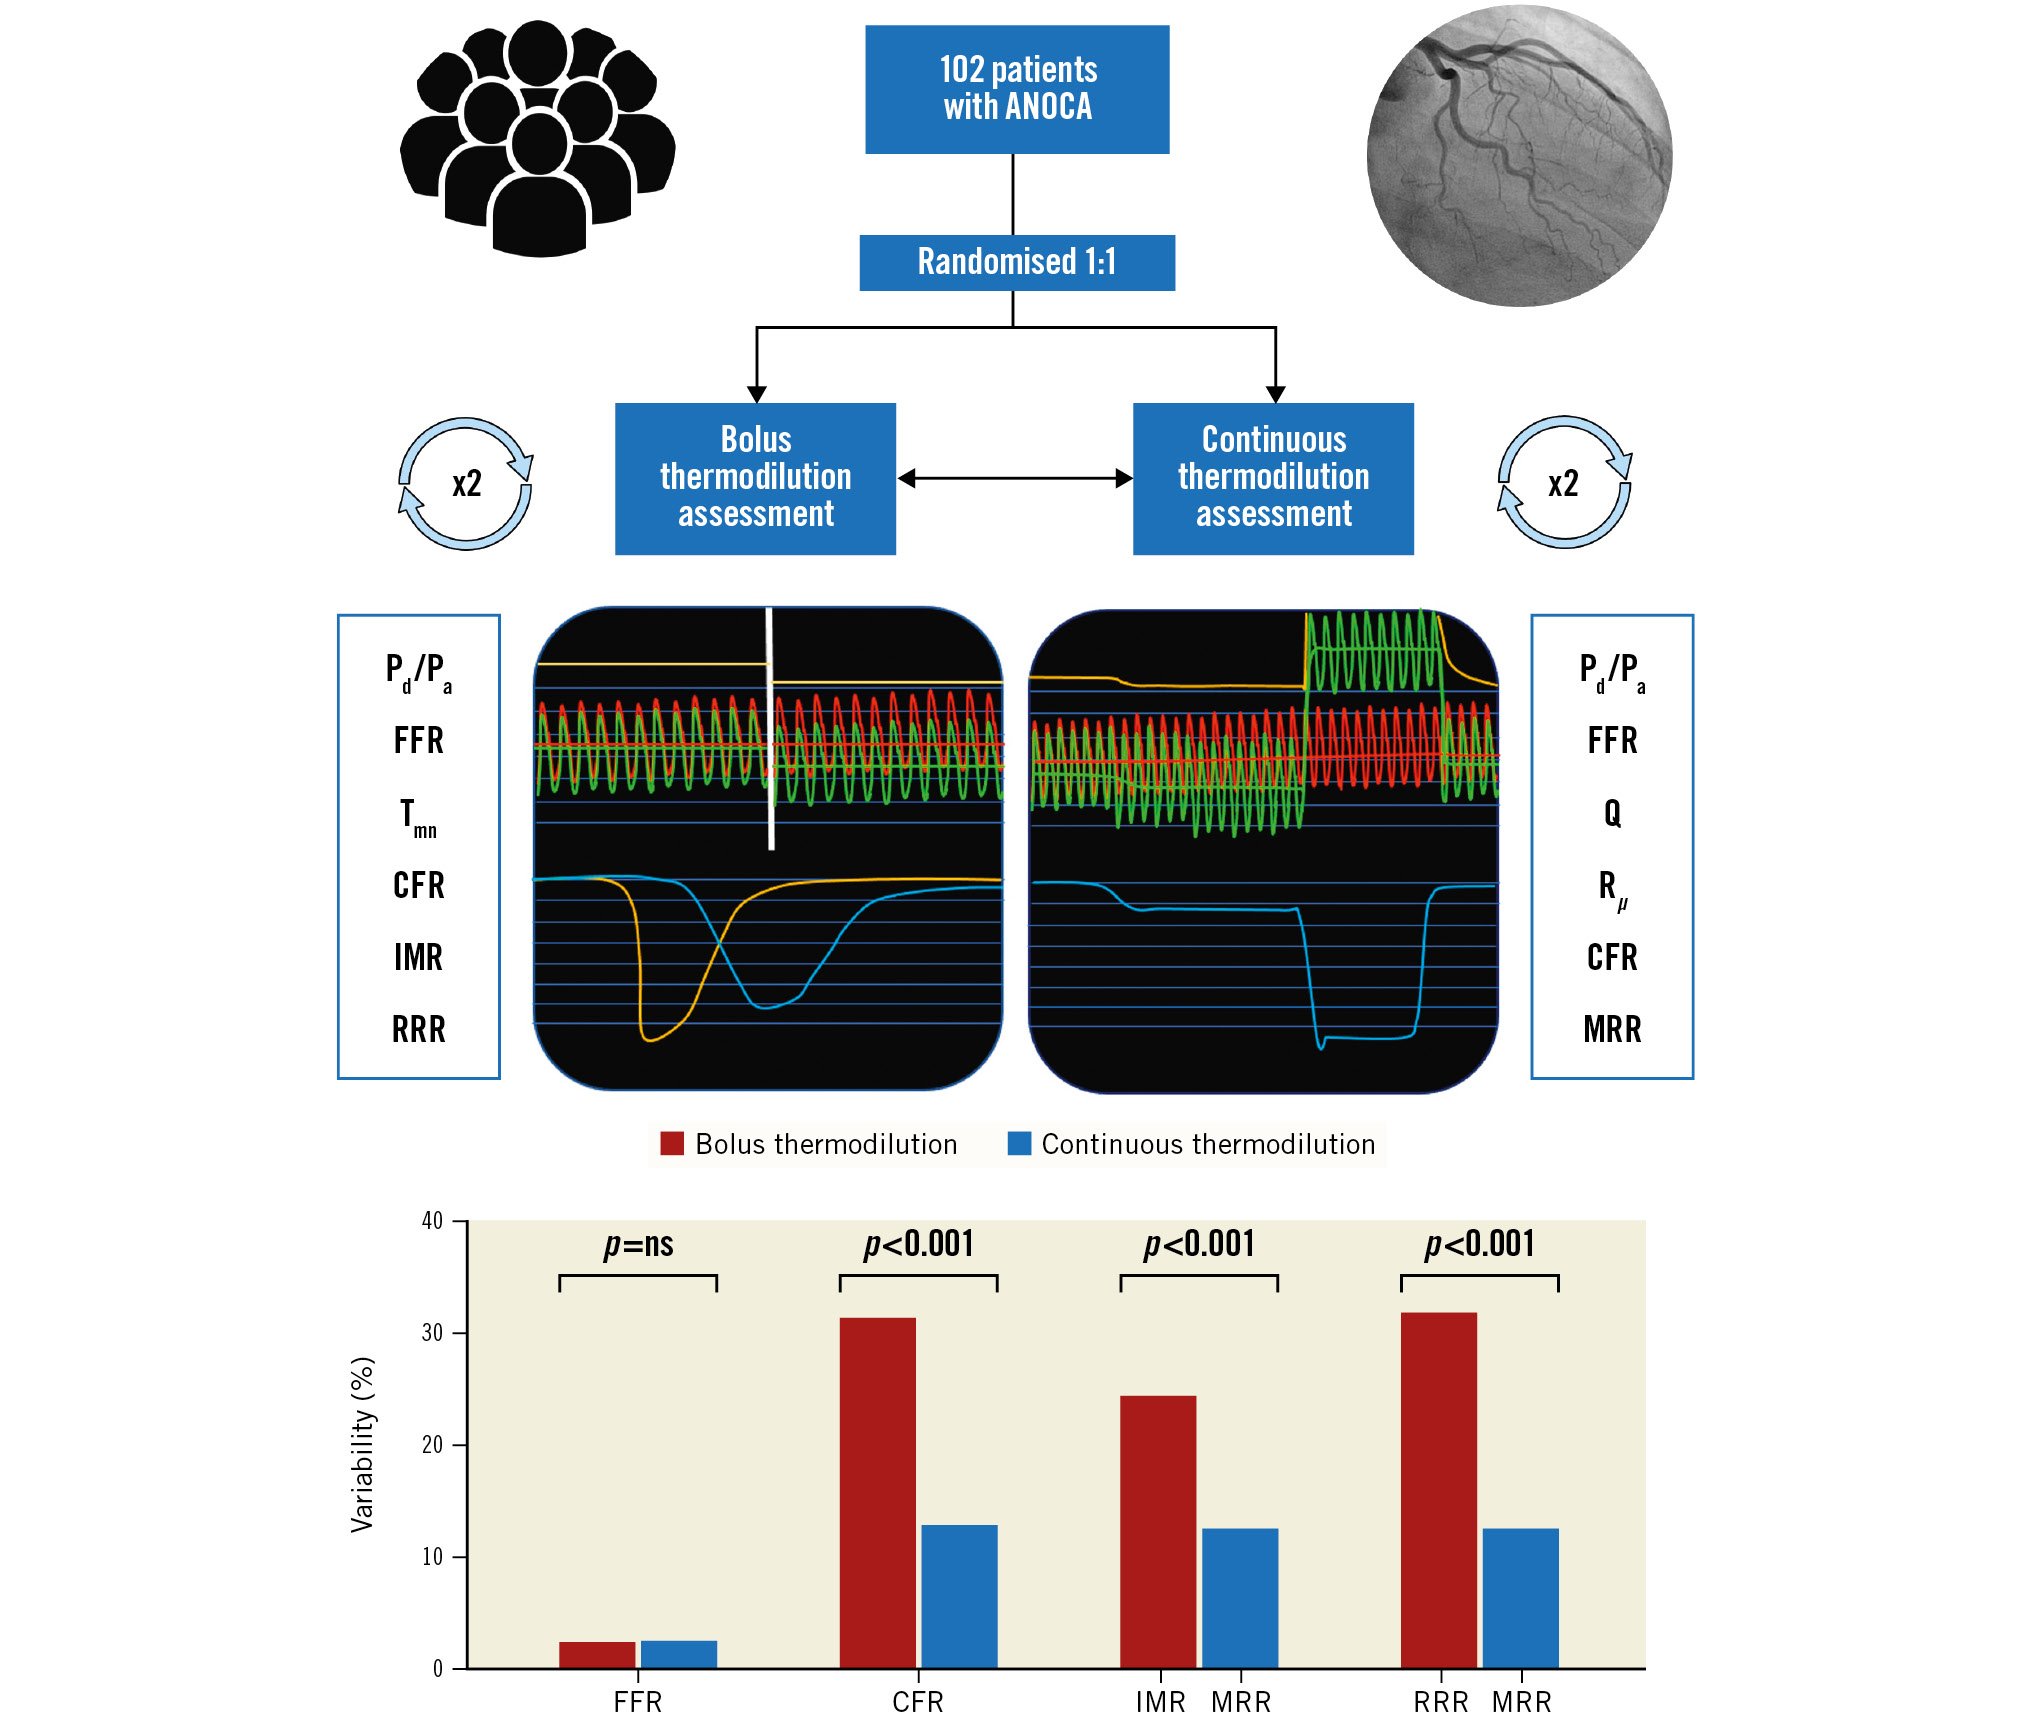
Central illustration. Study design and main results. CFR: coronary flow reserve; FFR: fractional flow reserve; IMR: index of microvascular resistance; MRR: microvascular resistance reserve; ANOCA: angina and non-obstructive coronary artery; Pa: aortic pressure; Pd: distal coronary pressure; Q: absolute coronary blood flow; RRR: resistance reserve ratio; Rµ: absolute microvascular resistance; Tmn: mean transit time
Coronary angiography
Coronary angiography was performed through either radial or femoral arterial access. A 6 Fr guiding catheter was used, and 0.2 mg of intracoronary isosorbide dinitrate was administered. A guidewire equipped with a pressure/temperature sensor (PressureWire X; Abbott) was connected to dedicated software for tracings analysis (CoroFlow Cardiovascular System; Coroventis) and, after zeroing, was advanced through the guiding catheter. The pressures recorded by the pressure/temperature wire and by the fluid-filled guide catheter were equalised close to the tip of the guiding catheter. Next, the wire was advanced into the distal part of the coronary artery, and the temperature zeroed.
Continuous thermodilution measurement
For absolute coronary flow measurement, a dedicated monorail infusion 2.52 Fr microcatheter with 4 distal side holes (RayFlow; HEXACATH) was advanced over the pressure/temperature wire and connected to the 200 cc motorised syringe of an automated injection system (Medrad Stellant; Medrad Inc. [now Bayer]) filled with room temperature saline (typically between 20 and 23°C). The infusion catheter was advanced into the artery being investigated, and its tip was positioned into the first millimetres of the vessel. Absolute resting (Qrest) and hyperaemic (Qhyp flow measurements were obtained using saline infusion rates of 10 and 20 mL/min, respectively. The infusion pump was automatically programmed to (i) infuse saline at 10 mL/min for 2 minutes to obtain the measurement of the temperature of blood mixed with infused saline (T); then (ii) to switch automatically to 20 mL/min for 1.5 minutes to obtain the measurement of the temperature of blood mixed with infused saline (T) as well as – after a swift pullback of the temperature sensor – the measurement of hyperaemic saline infusion temperature (Ti); and (iii) to switch back to 10 mL/min for 1 minute for the measurement of resting Ti. These techniques allowed for the calculation of resting and hyperaemic flow and resistance in one single procedure13.
Absolute coronary flow (Q, mL/min) as derived from continuous thermodilution was calculated by the previously validated equation14:
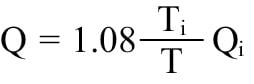
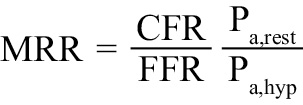
where Qi is the infusion rate of saline. Absolute resistance at rest (Rμ,rest) and during hyperaemia (Rμ,hyp) in WU were calculated as the ratio between the distal coronary pressure (Pd) during each infusion and Qrest or Qhyp, respectively. An Rμ,hyp >400 WU was considered abnormal15. Coronary flow reserve, as derived from continuous thermodilution (CFRcont), was calculated as the ratio between Qhyp and Qrest. MRR was calculated as previously described11:
The formulas used for the calculation of the functional metrics derived from bolus and continuous thermodilution are summarised in Supplementary Table 1.
Bolus thermodilution measurement
The basics of CFR and IMR calculation with bolus thermodilution has been described elsewhere416. Briefly, three bolus injections of 3 ml of room temperature saline were performed to assess the mean transit time (Tmn) at rest. The three values were averaged. Next, 12 mg of intracoronary papaverine was administered1718. After reaching steady-state hyperaemia, three bolus injections of 3 ml of saline were repeated to assess the mean transit times at hyperaemia. The software automatically flagged any Tmn value that deviated by more than 30% from the average value. These values were replaced with an additional bolus injection. The total number of bolus injections and their respective values were captured in the database. Supplementary Figure 1 illustrates the total number of bolus injections (accepted and rejected) needed to obtain the final average Tmn value. Coronary flow reserve, as derived from bolus thermodilution (CFRbolus), was calculated as the ratio between the mean transit time at rest (Tmn,rest) and the mean transit time during hyperaemia (Tmn,hyp). The IMR was calculated as the product of Pd,hyp and Tmn,hyp. The resistance reserve ratio (RRR) expresses the ratio between basal and hyperaemic microvascular resistance and is calculated as (Pd,rest/Tmn,rest)/(Pd,hyp/Tmn,hyp)19. After a 2-minute waiting period, the bolus thermodilution-derived measurements were repeated. An IMR >25 was considered abnormal. The measurement time was defined as the time from the start of the first bolus thermodilution at rest until the completion of the last bolus thermodilution during hyperaemia.
Statistics
The distribution of continuous variables was assessed visually by histograms and Q-Q plots. Continuous variables with normal distribution are expressed as mean±standard deviation and non-normally distributed variables as median and interquartile range (IQR). Categorical variables are expressed as count and percentages. Normal ranges are presented as the 5th and 95th percentiles. The Student’s t-test and the chi-square test were used to compare differences between continuous and categorical variables, respectively. Pearson’s correlation coefficient was used to quantify the associations between individual values for continuous variables. The intraclass correlation coefficient (ICC) was computed using a 2-way mixed-effect model with measures of absolute agreement. A statistical comparison of correlation coefficients was made by using the modified Dunn and Clark's z test for dependent nonoverlapping variables. Variability between two measurements (named A and B) was assessed as relative difference and expressed as a percentage according to the formula:
Bland-Altman analysis was used to quantify the agreement between duplicated measurements. Sample size was calculated based on an expected within-subject standard deviation (sw) of 15%; with a 95% confidence interval and considering 2 measurements (m) performed in each subject (for each method), the minimum required sample size (n) was 85 subjects according to the formula :
All analyses were performed using R statistical software (R Foundation for Statistical Computing). A p-value <0.05 was considered statistically significant.
Results
Baseline and procedural data
A total of 105 patients were included. In 2 patients, the procedure was aborted due to difficult vessel wiring; in 1 patient, the tracings were not reliable due to kinking of the pressure-wire. The mean age was 66±9 years, and 73 (71.6%) patients were male. The mean left ventricular ejection fraction (LVEF) was 60±10%. The clinical indications for coronary angiography and for the microvascular function test were anginal chest pain and/or exercise-induced dyspnoea in all patients. Patient characteristics are shown in Supplementary Table 2.
Fifty-one patients were randomly assigned to receive bolus thermodilution measurements first and the other 51 to receive continuous thermodilution measurements first. Table 1 displays bolus and continuous thermodilution-derived measurements. In 15 (14.7%) patients, fractional flow reserve (FFR) was below 0.80 in the distal part of the LAD. The IMR was higher than 25 in 23 (22.5%) patients, and Rμ,hyp was above 400 WU in 45 (44.1%) patients. In 71 (69%) patients, more than three bolus injections were required either for resting or hyperaemic measurements. The number of bolus injections required for each measurement is reported in Supplementary Figure 1. The average duration of bolus thermodilution measurements was shorter than continuous thermodilution (2’20’’±1’12’’ vs 4’31’’±1’30’’, respectively; p<0.001).
Table 1. Mean and SD values of bolus and continuous thermodilution measurements performed in duplicates. The order of the measurements was randomly assigned.
| 1st measurement | 2nd measurement | Average | R (95% CI) | Variability (%) | Bias (SD) | ICC (95% CI) | |
|---|---|---|---|---|---|---|---|
| Continuous thermodilution | |||||||
| Pd/Pa | 0.91±0.04 | 0.90±0.05 | 0.91±0.04 | 0.81 (0.73-0.86) | 1.79±3.39 | 0.008 (0.03) | 0.77 (0.67-0.84) |
| FFR | 0.82±0.07 | 0.81±0.07 | 0.82±0.07 | 0.91 (0.87-0.94) | 2.39±2.75 | 0.008 (0.03) | 0.90 (0.85-0.93) |
| Qrest (mL/min) | 80±27 | 87±33 | 83±29 | 0.80 (0.72-0.86) | 17.98±13.99* | −7.35 (19.63) | 0.77 (0.64-0.85) |
| Qhyp (mL/min) | 203±66 | 218±79 | 211±71 | 0.89 (0.85-0.93) | 11.89±11.54* | −13.92 (35.48) | 0.87 (0.78-0.91) |
| Rµ,rest (WU) | 1,142±355 | 1,104±403 | 1,121±359 | 0.78 (0.69-0.85) | 16.58±13.51¶ | 38.34 (252.48) | 0.78 (0.68-0.84) |
| Rµ,hyp (WU) | 411±139 | 393±132 | 401±132 | 0.89 (0.84-0.92) | 11.10±10.84¶ | 14.80 (65.29) | 0.88 (0.83-0.92) |
| CFRcont | 2.65±0.69 | 2.60±0.70 | 2.62±0.65 | 0.78 (0.70-0.85) | 12.74±10.41† | 0.05 (0.45) | 0.78 (0.70-0.85) |
| MRR | 3.18±0.84 | 3.19±0.85 | 3.19±0.80 | 0.81 (0.73-0.87) | 12.44±10.06‡§ | −0.006 (0.52) | 0.81 (0.74-0.87) |
| Bolus thermodilution | |||||||
| Pd/Pa | 0.92±0.04 | 0.92±0.04 | 0.92±0.04 | 0.79 (0.71-0.86) | 1.74±2.28 | 0.007 (0.02) | 0.78 (0.69-0.85) |
| FFR | 0.86±0.06 | 0.86±0.06 | 0.86±0.06 | 0.88 (0.82-0.92) | 2.34±2.95 | 0.004 (0.03) | 0.87 (0.82-0.91) |
| Tmn,rest (s) | 0.86±0.38 | 0.80±0.36 | 0.83±0.35 | 0.77 (0.68-0.84) | 22.81±20.06 | 0.05 (0.25) | 0.76 (0.67-0.83) |
| Tmn,hyp (s) | 0.27±0.14 | 0.29±0.17 | 0.28±0.15 | 0.83 (0.75-0.88) | 23.09±18.46 | −0.01 (0.09) | 0.81 (0.74-0.87) |
| CFRbolus | 3.47±1.44 | 3.11±1.27 | 3.27±1.18 | 0.50 (0.34-0.63) | 31.26±24.85† | 0.36 (1.36) | 0.48 (0.32-0.62) |
| IMR | 19.42±10.54 | 20.79±11.64 | 20.10±10.54 | 0.81 (0.73-0.86) | 24.24±19.27‡ | −1.34 (6.97) | 0.80 (0.71-0.86) |
| RRR | 4.25 (1.74) | 3.76 (1.63) | 4.00 (1.45) | 0.49 (0.33-0.62) | 31.75±26.27§ | 0.48 (1.70) | 0.47 (0.30-0.61) |
| †comparison between CFRcont and CFRbolus, p<0.001;*comparison between Qrest and Qhyp, p<0.001; ¶comparison between Rμ,rest and Rμ,hyp, p=0.002; ‡comparison between MRR and IMR, p<0.001; §comparison between MRR and RRR, p<0.001. CI: confidence interval; CFRbolus: coronary flow reserve calculated with bolus thermodilution; CFRcont: coronary flow reserve calculated with continuous thermodilution; FFR: fractional flow reserve; ICC: intraclass correlation coefficient; IMR: index of microvascular resistance; MRR: microvascular resistance reserve; Pa: aortic pressure; Pd: distal coronary pressure; Qhyp: absolute hyperaemic coronary flow; Qrest: absolute coronary flow at rest; Rμ,rest: absolute microvascular resistance at rest, Rμ,hyp: absolute microvascular resistance during hyperemia; RRR: resistance reserve ratio; Rπ: absolute microvascular resistance; s: seconds; Tmn,hyp: mean transit time during hyperaemia; Tmn,rest : mean transit time at rest; WU: Wood units | |||||||
Reproducibility of the measurements
Reproducibility data from duplicated measurements of bolus and continuous thermodilution are reported in Table 1. Figure 1, Figure 2, and Figure 3 illustrate the individual scatter plots, the correlations, and the Bland-Altman analysis of the repeated measurements of Qrest and Qhyp, the repeated measurements of CFRcont and CFRbolus, and the repeated measurements of MRR and IMR, respectively. Multivariable regression analysis showed that none of the clinical factors included in the model influenced the higher variability of CFRbolus (Supplementary Table 3). Supplementary Figure 2-Supplementary Figure 6 display the individual scatter plots, the correlation, and the Bland Altman analysis of all other indices listed in Table 1.
Overall, the reproducibility of the hyperaemic values of Q and Rμ were significantly better than the corresponding resting values (Table 1).
When taking into account only the first Tmn for the calculation of IMR and CFR, the reproducibility did not improve (first Tmn vs average of the 3 bolus injections: IMR variability=27.3±22.1% vs 24.2±19.3%; p=0.278; CFR variability=34.3±26.8% vs 31.3±24.8%; p=0.407).
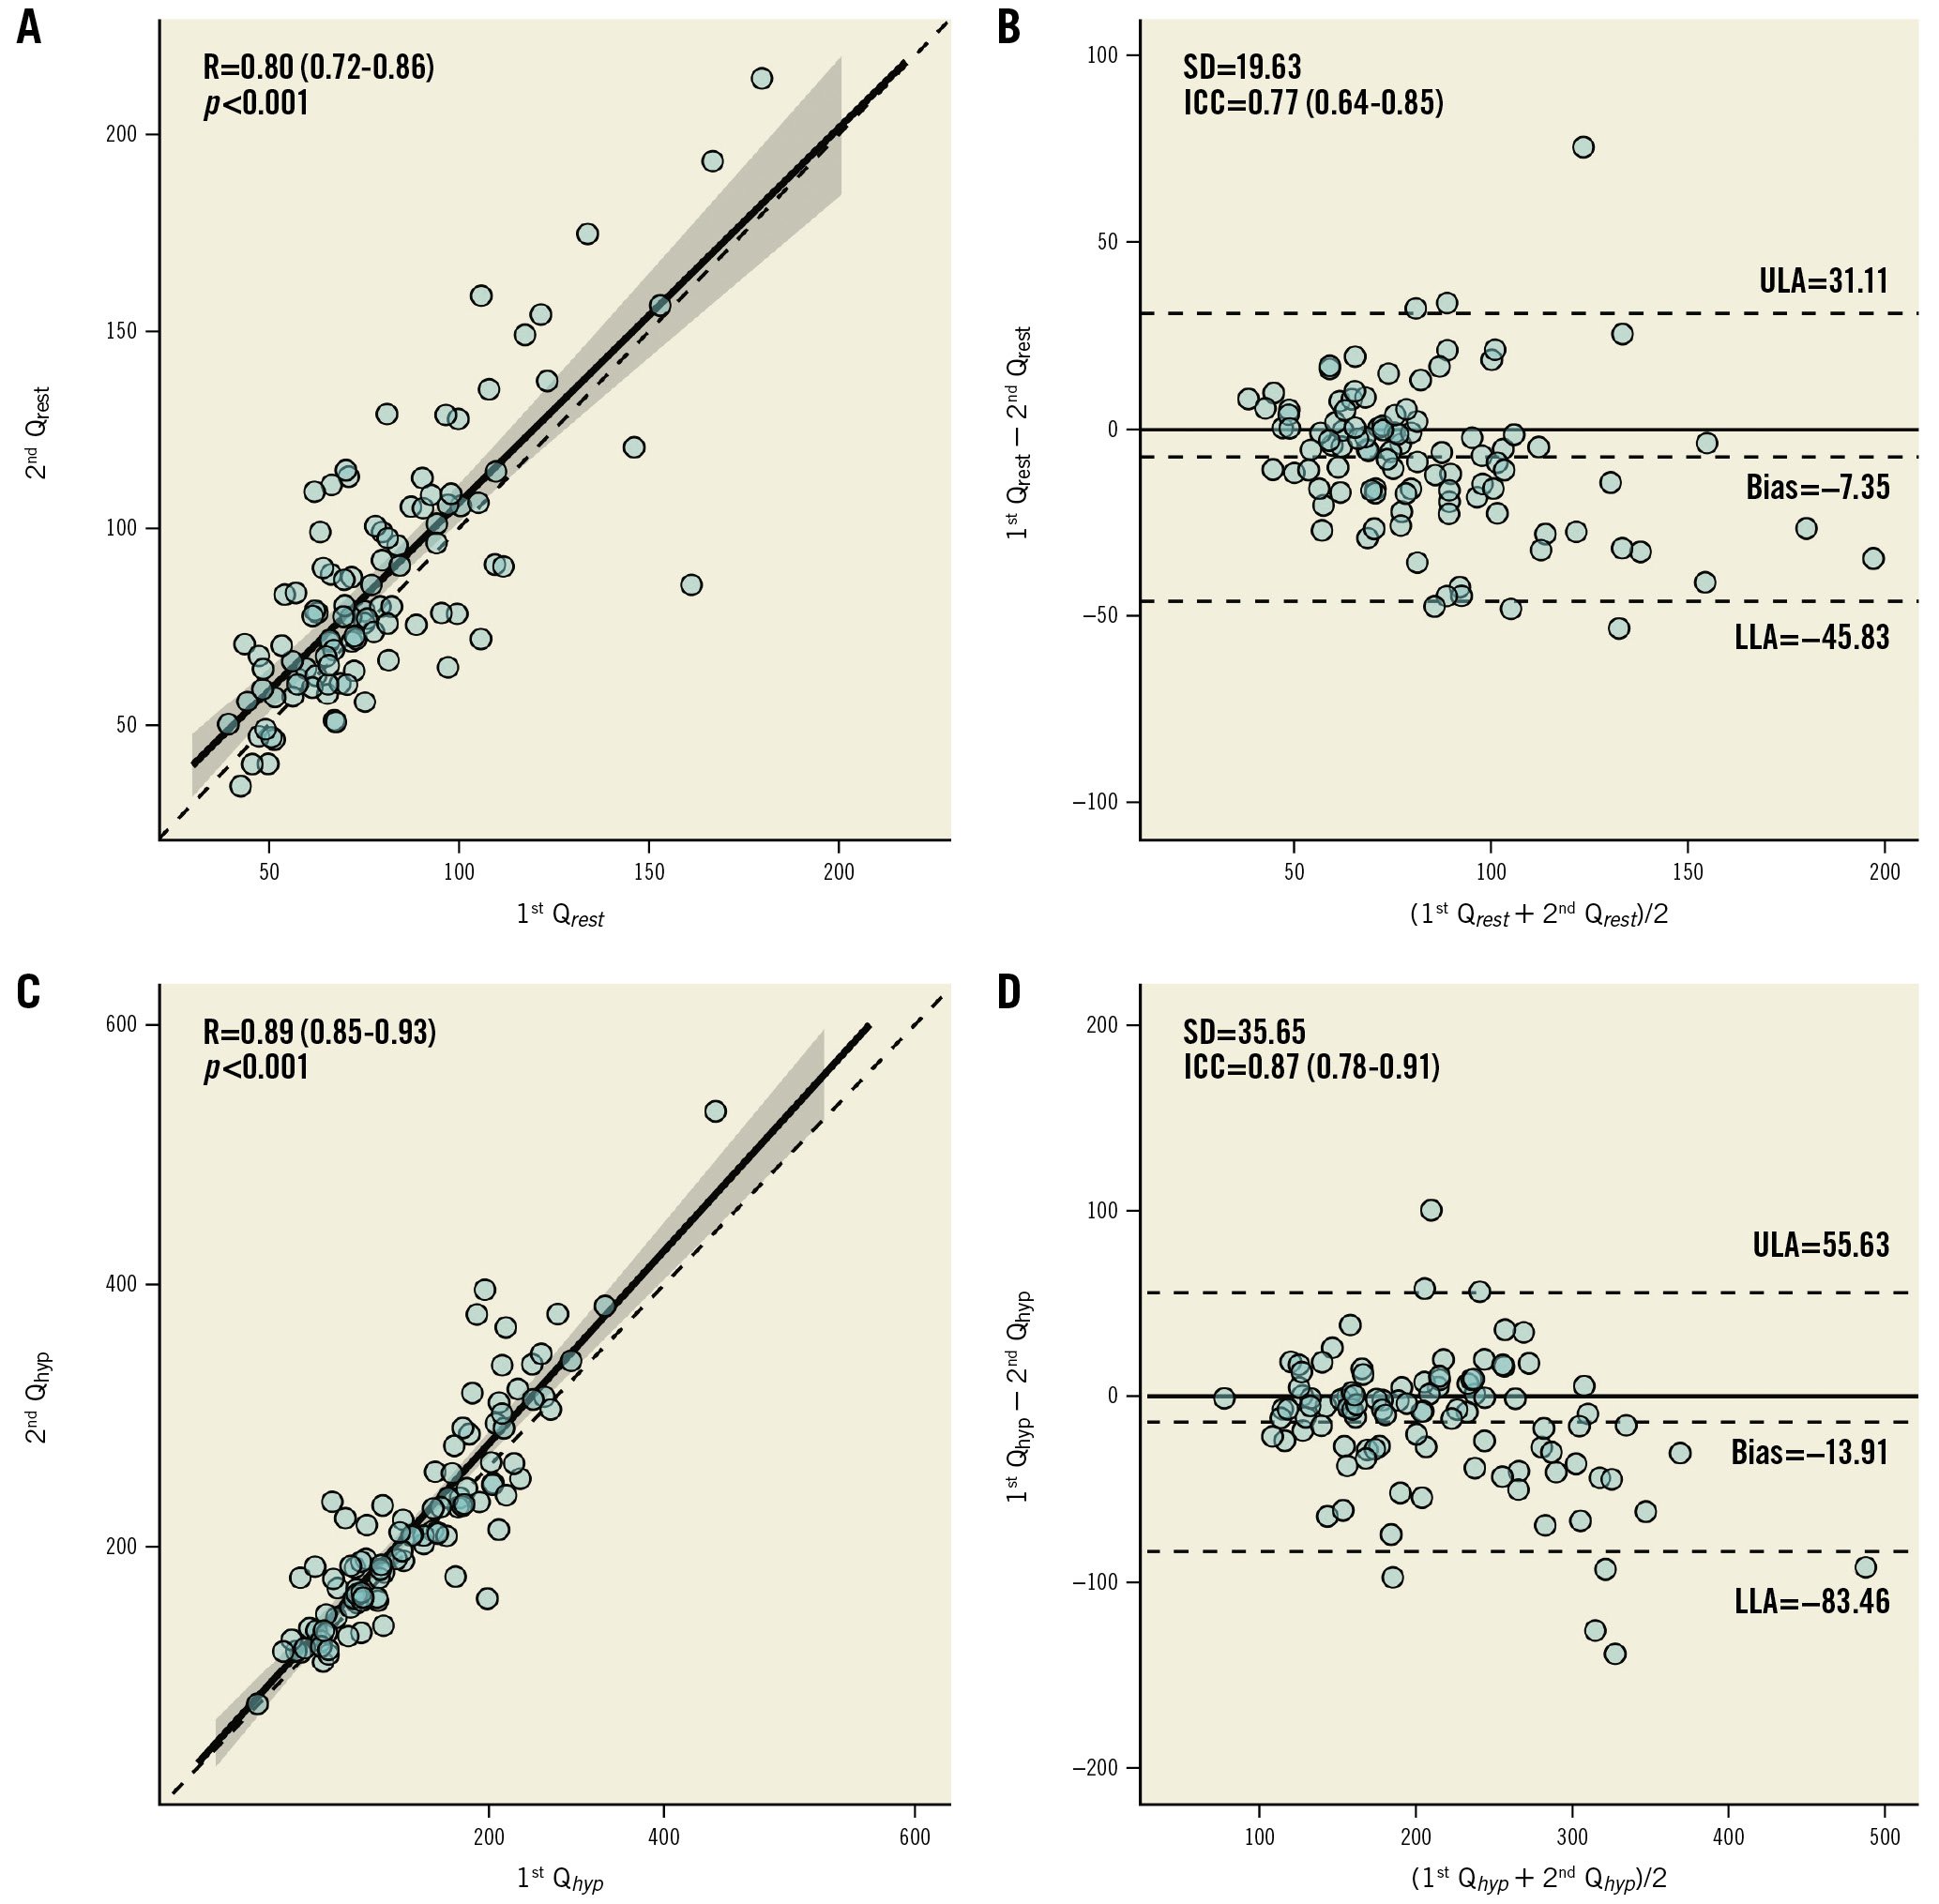
Figure 1. Reproducibility of Qrest and Qhyp. Scatter plots (A,C) and Bland-Altman plots (B,D) for repeated measurements of Qrest and Qhyp. ICC: intraclass correlation coefficient; LLA: lower limit of agreement; Qhyp: absolute hyperaemic coronary flow; Qrest: absolute coronary flow at rest; R: Pearson correlation coefficient; SD: standard deviation; ULA: upper limit of agreement
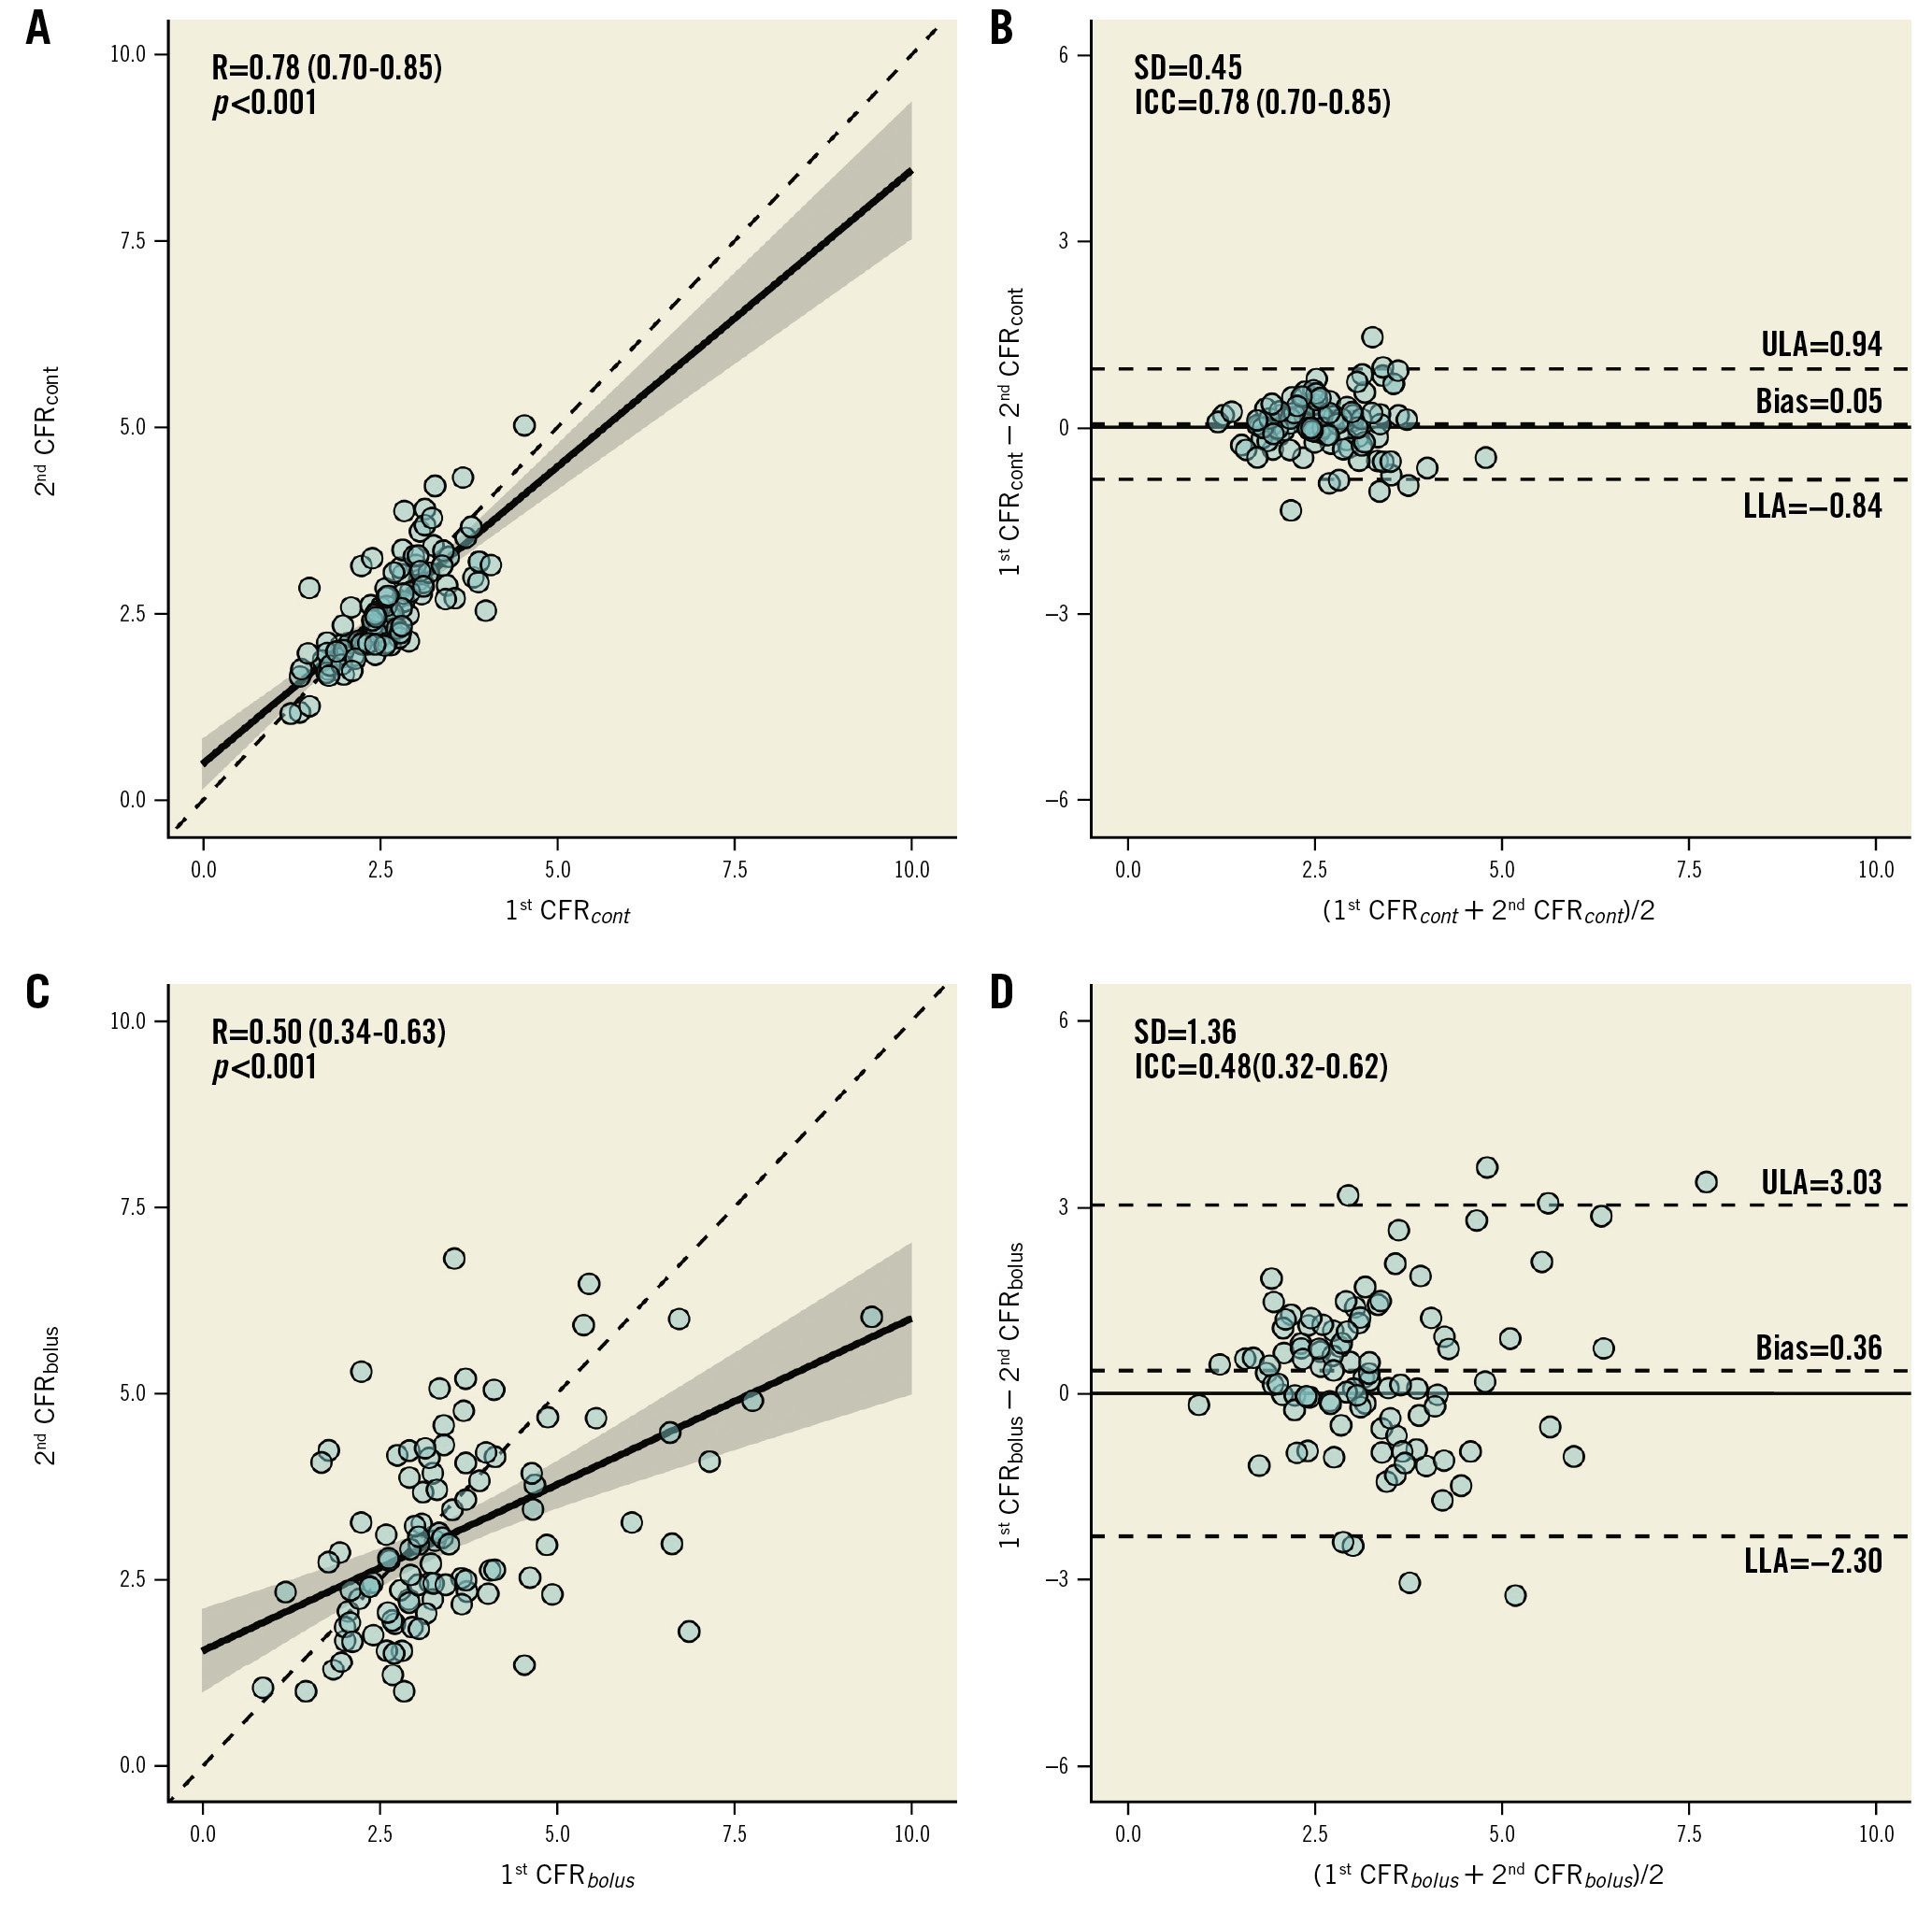
Figure 2. Reproducibility of CFRcont and CFRbolus. Scatter plots and Bland-Altman plots for repeated measurements of CFRcont (A,B) and CFRbolus (C,D). CFRcont: coronary flow reserve calculated with continuous thermodilution; CFRbolus: coronary flow reserve calculated with bolus thermodilution; ICC: intraclass correlation coefficient; LLA: lower limit of agreement; R: Pearson correlation coefficient; SD: standard deviation; ULA: upper limit of agreement
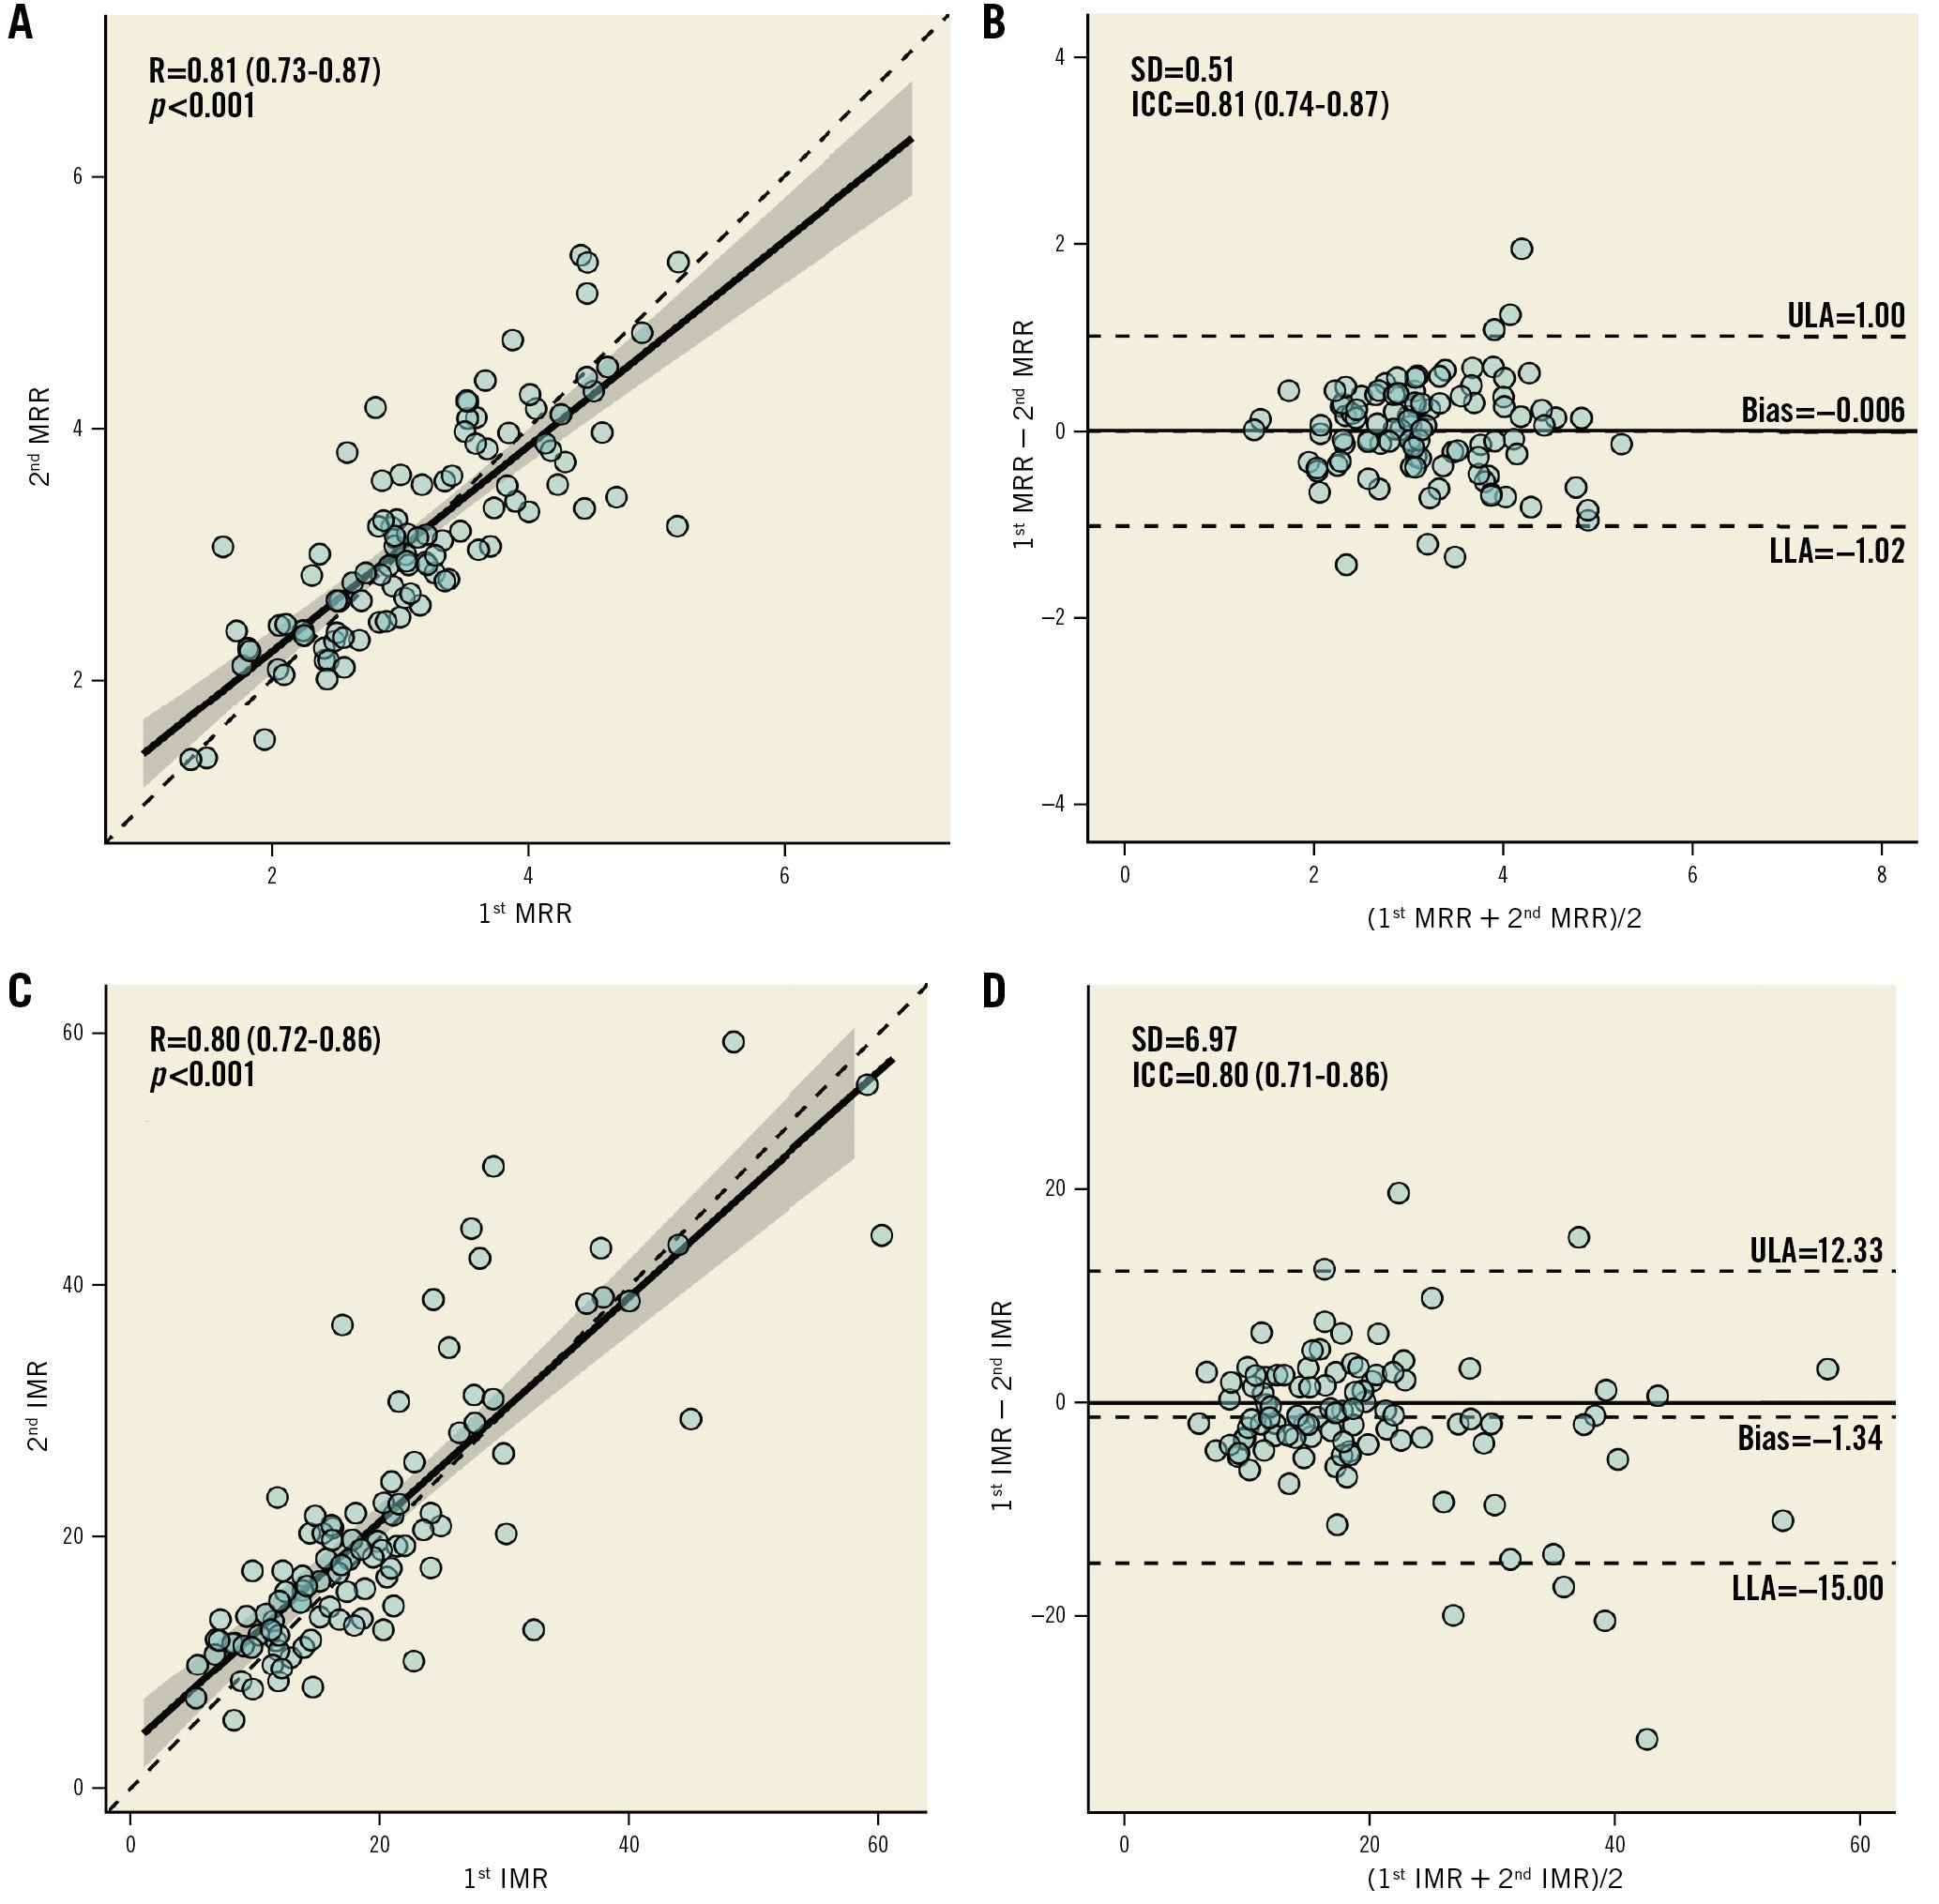
Figure 3. Reproducibility of MRR and IMR. Scatter plots and Bland-Altman plots for repeated measurements of MRR (A,B) and IMR (C,D). ICC: intraclass correlation coefficient; IMR: index of microvascular resistance; LLA: lower limit of agreement; MRR: microvascular resistance reserve; R: Pearson correlation coefficient; RRR: resistance reserve ratio; SD: standard deviation; ULA: upper limit of agreement
Comparison between bolus and continuous thermodilution
The average FFR assessed with the continuous thermodilution was slightly but significantly lower than FFR assessed with intracoronary papaverine (0.82±0.07 vs 0.86±0.06; p<0.001) (Supplementary Figure 7).
As illustrated in the Central Illustration and Figure 4, the test-retest variability of the indices obtained by continuous thermodilution was lower than that of the indices obtained by bolus thermodilution. In particular, the variability of CFRcont was significantly lower than that of CFRbolus (12.8% vs 31.3%; p<0.001). Also, the variability of MRR was significantly smaller than that of IMR and RRR (12.4% vs 23.2% vs 31.8%; p<0.001). Overall, the mean CFRcont was significantly lower than the mean CFRbolus (2.63±0.65 and 3.29±1.17, respectively; p<0.001) (Supplementary Figure 7). The higher variability of CFRbolus was not influenced by any of the clinical characteristics of the patients and is, therefore, related only to the technique itself (Supplementary Table 3). CFRcont and CFRbolus showed a modest correlation and a weak agreement (R=0.40; p<0.001; ICC=0.27 [0.05-0.46]; p=0.007) (Figure 5). Using a CFR threshold of 2.5 or 2, the percentage of disagreement between CFRcont and CFRbolus was 35.3% and 12.7%, respectively (Supplementary Figure 8). MRR showed a mild correlation with the RRR but did not correlate with the IMR (Figure 6). There was no correlation between the IMR and Rμ,hyp (Supplementary Figure 9).
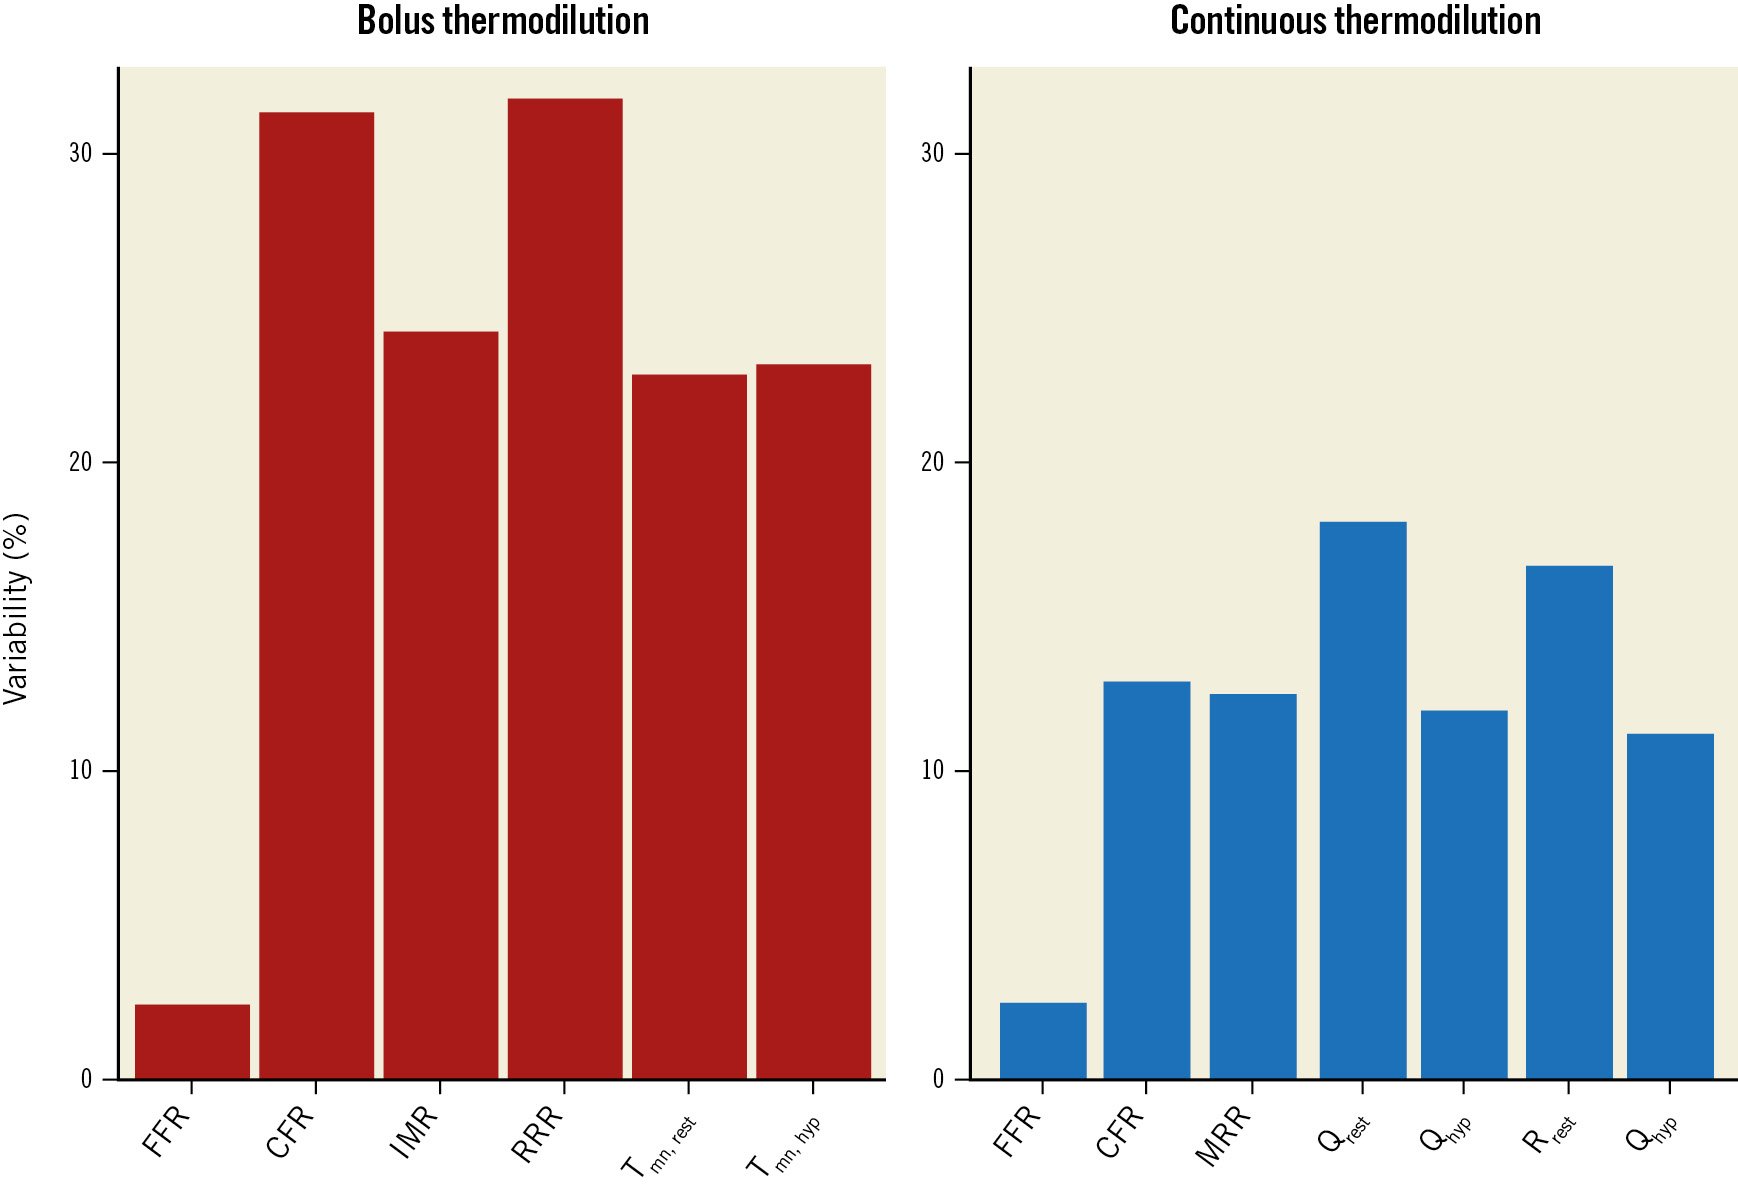
Figure 4. Variability of bolus thermodilution- and continuous thermodilution-derived measurements. Barplots with the variability (expressed as %) of the main indices derived by bolus and continuous thermodilution. CFR: coronary flow reserve; FFR: fractional flow reserve; IMR: index of microvascular resistance; MRR: microvascular resistance reserve; Qhyp: absolute hyperaemic coronary flow; Qrest: absolute coronary flow at rest; RRR: resistance reserve ratio; Rµ,hyp: absolute resistance during hyperaemia; Rµ,rest: absolute resistance at rest; Tmn,hyp: mean transit time during hyperaemia; Tmn,rest: mean transit time at rest
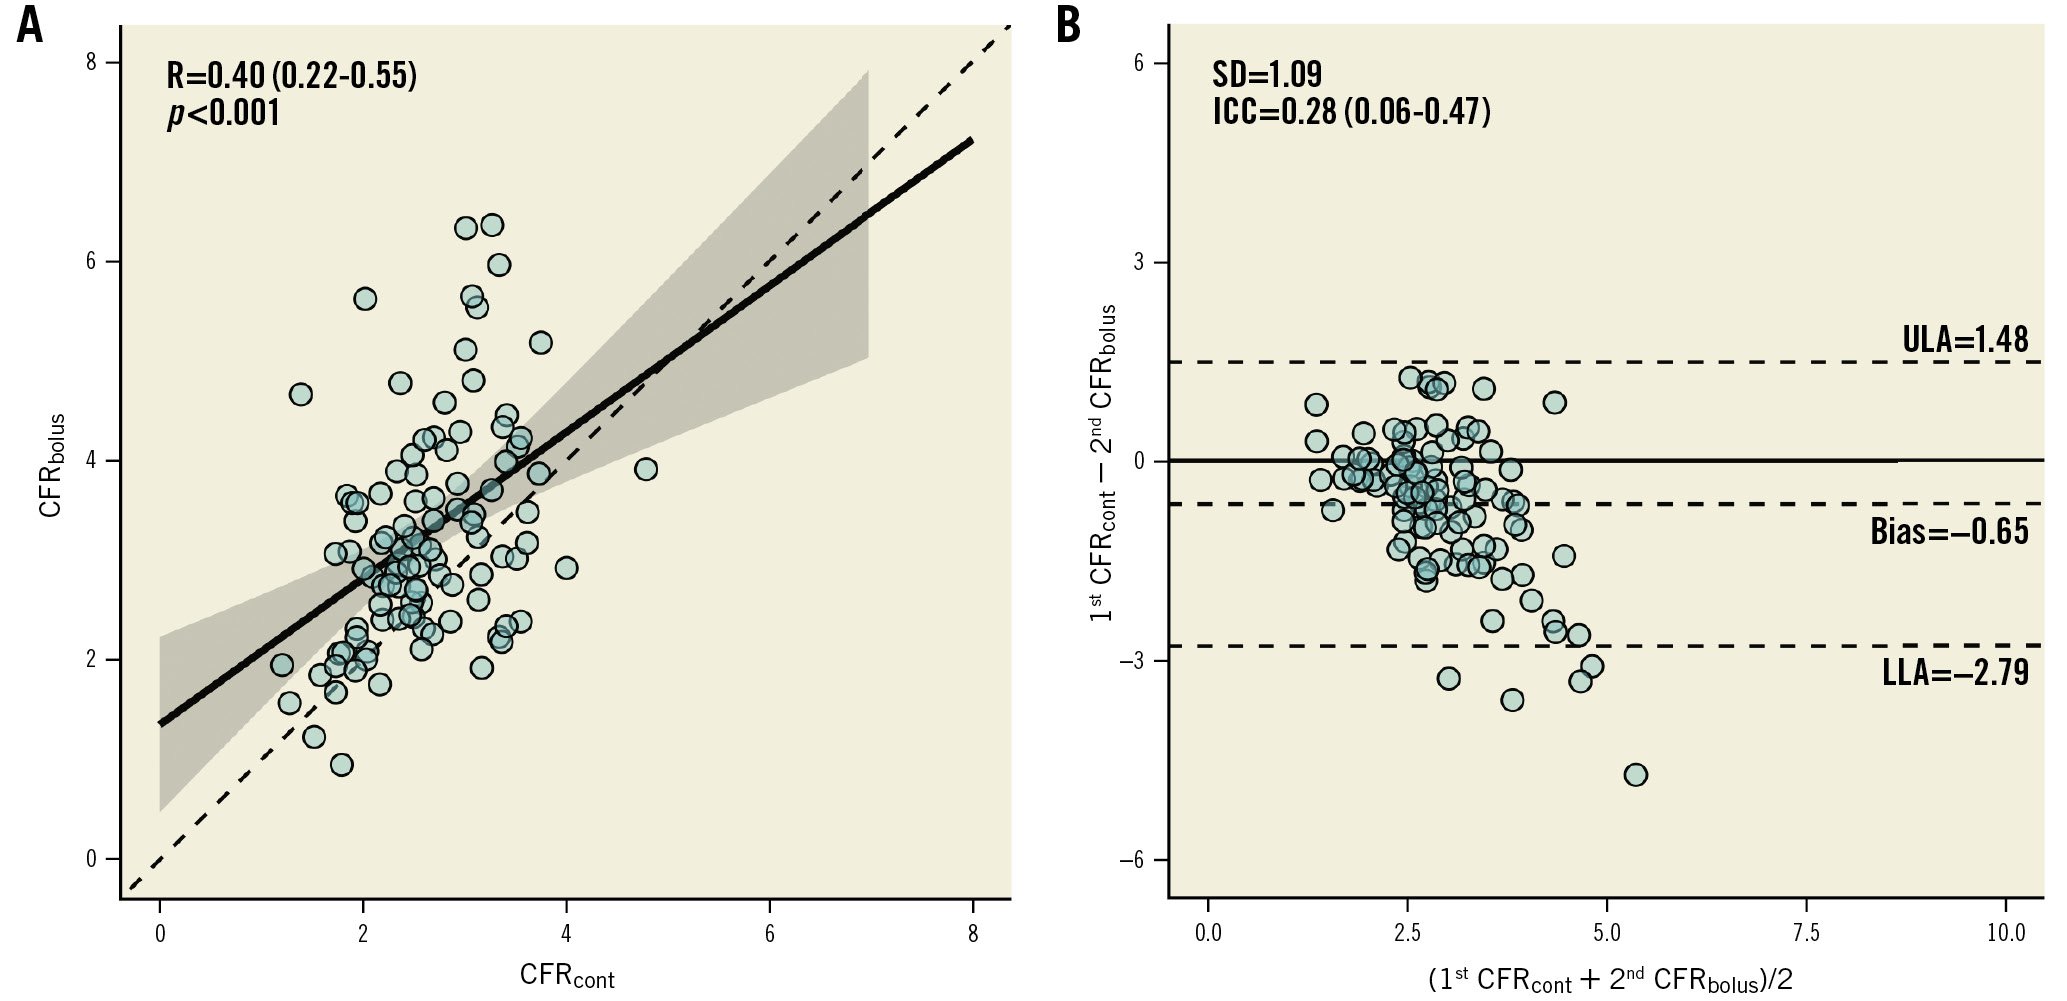
Figure 5. Correlation between bolus and continuous thermodilution-derived CFR. A scatter plot (A) and a Bland-Altman plot (B) showing the correlation and the agreement between CFRcont and CFRbolus. CFRbolus: coronary flow reserve calculated with bolus thermodilution; CFRcont: coronary flow reserve calculated with continuous thermodilution; ICC: intraclass correlation coefficient; LLA: lower limit of agreement; R: Pearson correlation coefficient; SD: standard deviation; ULA: upper limit of agreement
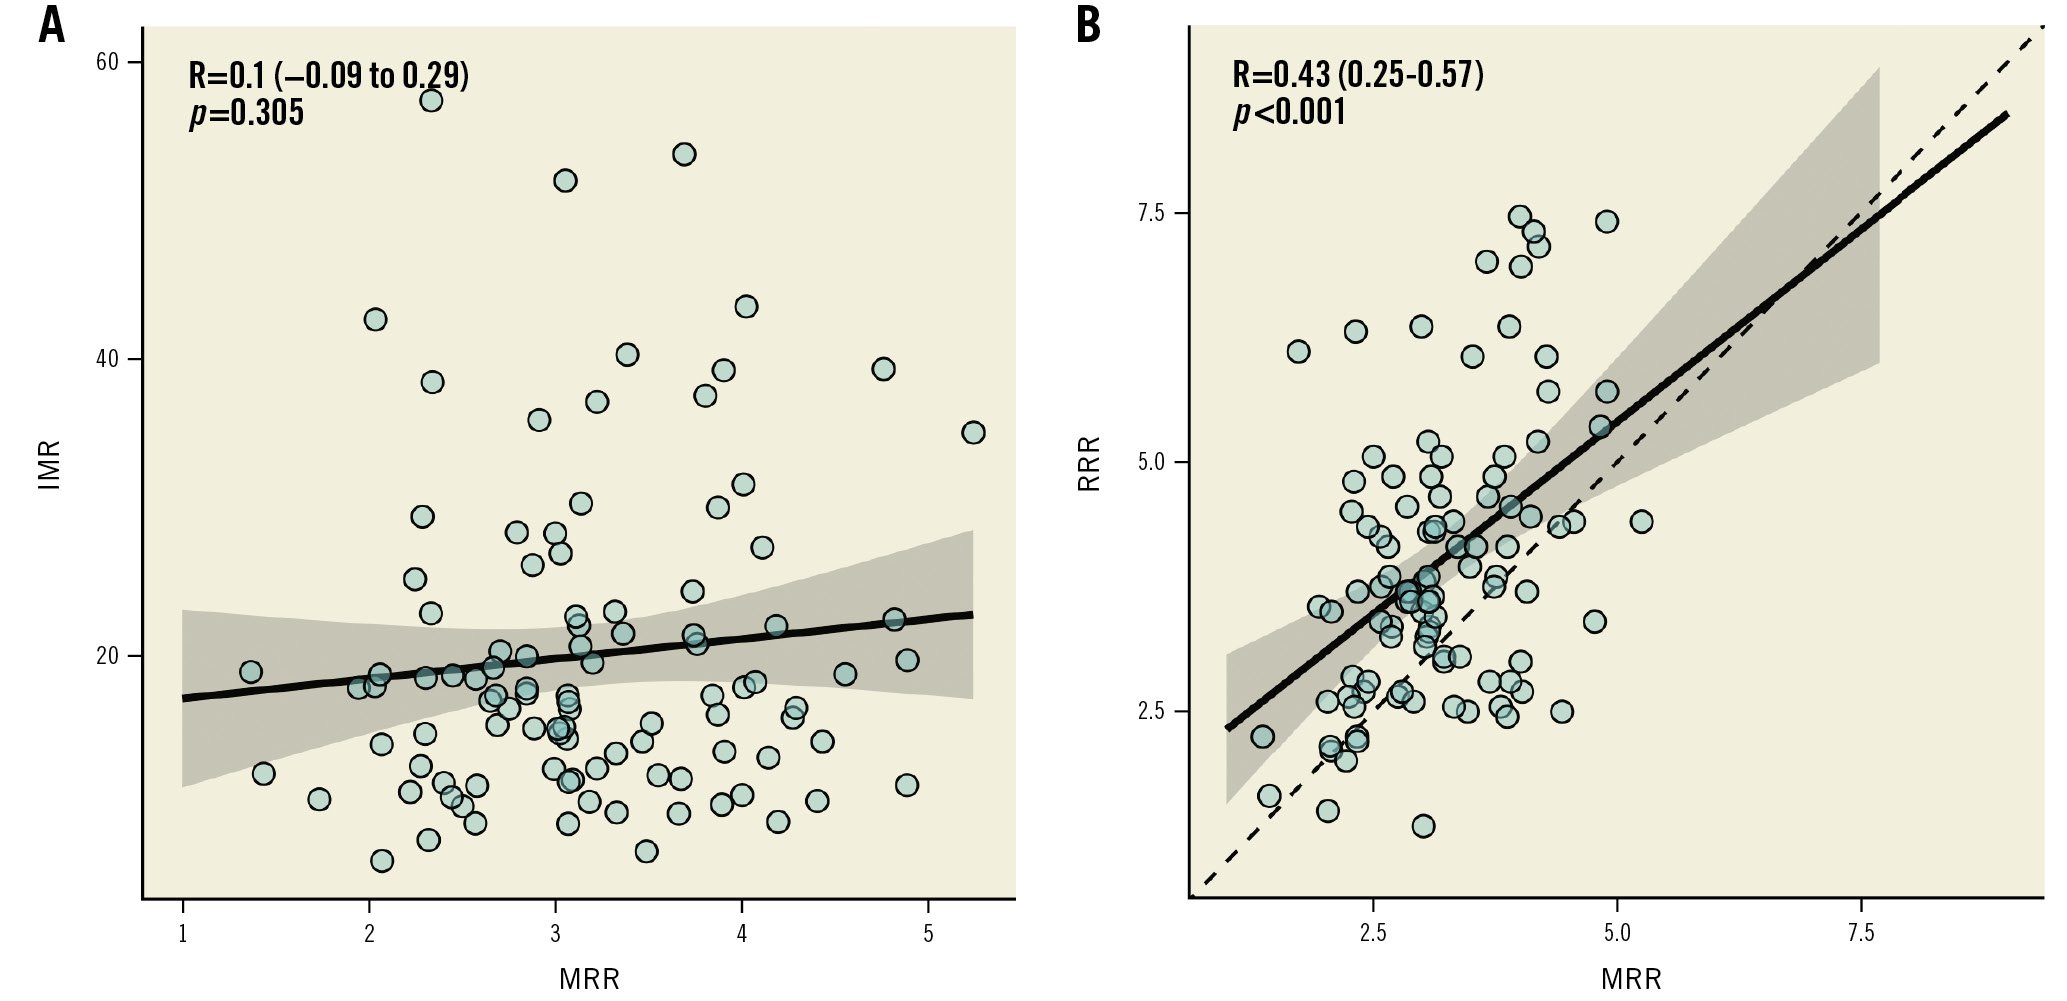
Figure 6. Correlation between MRR and IMR-RRR. Scatter plot showing the correlation between MRR and IMR (A) or RRR (B). IMR: index of microvascular resistance; MRR: microvascular resistance reserve; R: Pearson correlation coefficient; RRR: resistance reserve ratio
Discussion
Summary of results
This is the first study to compare head-to-head the reproducibility of bolus and continuous thermodilution in assessing coronary microvascular function. Overall, the indices obtained by continuous coronary thermodilution have a higher reproducibility than corresponding indices derived from bolus thermodilution. In particular, the variability of CFR is approximately three times lower when derived from continuous thermodilution than when derived from bolus thermodilution, and the variability of MRR is approximately two times lower than that of the IMR. In addition, the absolute value of CFR obtained by continuous thermodilution was lower than the CFR derived from bolus thermodilution. Finally, hyperaemic measurements of Q, Rμ, and Tmn tend to be more reproducible than their corresponding resting measurements.
Accuracy and reproducibility
The clinical utility of any measurement depends on both accuracy (i.e., how close a measured value is to the true value) and reproducibility (i.e., the degree to which repeated measurements give the same results). The accuracy of Q as derived from continuous thermodilution has been validated in vitro for values ranging from 50 to 350 mL/min14. These values cover the range of flow commonly encountered in coronary arteries at rest and during hyperaemia. The accuracy of Q and microvascular R as derived from continuous thermodilution has been also validated in humans by using [15O2]H2O positron emitted tomography (PET) during hyperaemia by Everaars et al12.
When the noise of repeated measurements is large (low reproducibility), individual decision-making will be noisy as well20. In addition, any mechanistic study or therapeutic trial, which would both involve repeated measurements, would be flawed. In the field of CMD, of which the pathophysiology remains largely unknown and for which any specific treatment is lacking, the usage of a metric with a high degree of accuracy and reproducibility is required. The present data indicate that, overall, continuous thermodilution is more reproducible than bolus thermodilution to assess coronary microvascular function. It can be speculated that this relates to the fact that continuous thermodilution is almost operator-independent. In addition, during continuous thermodilution, a prolonged steady-state is reached, while bolus thermodilution relies on the decay of a thermodilution curve that lasts less that one cardiac cycle. We have to note, however, that the reproducibility of pressure-derived metrics like FFR remains markedly higher than that of coronary flow. This likely relates to the stability of pressure measurements, the simultaneous assessment of Pd and Pa, and the linear relationship between Pd and Pa during hyperaemia.
Thermodilution to assess microvascular function
Coronary microvascular dysfunction is increasingly recognised as an important factor of chest pain and additional medical costs. The development of new therapeutic strategies for improving CMD is hampered by the absence of appropriate animal models and of direct visualisation of the microcirculation, but even more fundamentally, by the difficulties in quantifying microvascular resistance. The latter can currently be approximated by indices using surrogates of flow, among which is the Tmn derived from bolus thermodilution4.
Currently, the IMR5 derived from the Tmn and distal coronary pressure is easy to obtain and is considered the invasive standard of reference to diagnose CMD16. This technique, however, presents some limitations, mainly related to the fact that manual injection of saline accounts for some variance in the measurements21. In addition, the duration of the measurements is shorter than the duration of one single heart beat. This is why both resting and hyperaemic measurements are repeated three times and the values averaged when the agreement between these values is acceptable (i.e., less than 30% deviation from each other). In the present study, this agreement between the three resting values and the three hyperaemic values was obtained in a minority of cases. In 69% of patients, more than three bolus injections were required.
In the present study, higher values of CFR were observed when derived from bolus thermodilution than from continuous thermodilution. It is likely that a hand injection of a bolus of saline in a system with a very low resistance may exaggerate the acceleration of coronary flow, thus leading to a shorter Tmn and higher CFR values. Other authors recently reported supraphysiological values of CFR when derived from bolus thermodilution22. Previous studies have shown that CFRbolus tends to overestimate Doppler-derived CFR with a very modest correlation between the two parameters2122. Similarly, Everaars et al found a weaker correlation between CFRbolus and PET-derived CFR21 than between Doppler-derived CFR and PET-derived CFR. Taking into account only the first Tmn value to calculate CFR and the IMR did not improve the reproducibility of the measurements. Furthermore, it has been shown that the IMR does not correlate with Rμ,hyp23. Alternatively, it might be speculated that the presence of an infusion catheter might increase epicardial resistance and, consequently, reduce hyperaemic flow and CFRcont. This was not observed in the present study (Supplementary Table 4), but it cannot be formally excluded when measurements are obtained in vessels with smaller diameters. Yet, while the presence of the infusion catheter might influence CFR, it does not influence MRR, precisely because any epicardial resistance is accounted for, thus making MRR specific for the microcirculation.
No correlation was found between MRR and the IMR. This likely relates to conceptual differences between these two indices. As the IMR reflects hyperaemic microvascular resistance while MRR reflects the vasodilatory capacity of the microcirculation, thus accounting for resting conditions.
Thermodilution and clinical outcome
The relation between the IMR and clinical outcome has been shown in patients with ST-elevation myocardial infarction (STEMI). An IMR value above 40 after primary percutaneous coronary intervention (PCI) has been associated with significantly higher mortality as compared to lower post-PCI IMR values7. In patients with STEMI, it is well established that a post-PCI “sluggish flow” or “no-reflow” observed at angiography after a successful primary PCI is a sign of a poor recovery of left ventricular function and a poor clinical outcome. This “no-reflow” phenomenon has been ascribed to intravascular factors as well as to perivascular oedema24. Since the Tmn is the reverse of flow velocity and is, therefore, the physiological counterpart of the progression of contrast medium in the epicardial conduit, the presence of “no-reflow” goes along with significantly prolonged Tmn and, thus, with very high values of the IMR25. In patients with STEMI, IMR values above 40 immediately after recanalisation of the artery by primary PCI were associated with higher mortality after one year7. In these patients, extreme values of IMR (median 60.5, IQR 44.1-74.5) were found, and the IMR value correlated negatively with the global left ventricular ejection fraction after 6 months26. In stable patients, however, the pathophysiology of abnormal resistance is quite different and depends on several, mainly extravascular, factors. The range of IMR values found in chronic coronary syndrome (CCS) patients is markedly lower. In addition, an IMR value of 25 was proposed as a threshold for distinguishing normal from abnormal microvascular function in CCS patients, almost twice as low as the threshold used after primary PCI2728.
Consequently, in these stable patients, the relationship between IMR values and clinical outcome is weaker than in the acute setting1. We recently proposed a new approach based on continuous thermodilution and allowing the measurement of coronary flow and microvascular resistances in absolute terms14. Yet, even when quantified in absolute terms, Q, Rμ, and CFR depend on myocardial mass and the presence of epicardial stenoses29. Therefore, the concept of MRR was developed to be specific to the coronary microcirculation, i.e., independent of myocardial mass and epicardial resistance11. On top of these theoretical advantages, the present study indicates that MRR based on continuous thermodilution is two to three times more reproducible than the IMR and RRR derived from bolus thermodilution.
Limitations
The present study only assessed and compared the reproducibility of bolus and continuous thermodilution. The study did not investigate the accuracy of the results by comparison with a standard of reference. Both bolus and continuous thermodilution have been previously compared separately with [15O]H2O PET1221.
Also, interobserver reproducibility of the results of bolus and continuous thermodilution was not assessed.
In the present study, papaverine was used as hyperaemic agent. Although there is no direct comparison, the hyperaemic effects of papaverine and saline (as infused by the RayFlow catheter) can be assumed to be similar since the hyperaemic effects of saline and adenosine are similar1730.
Finally, despite the accuracy and reproducibility of continuous thermodilution, its adoption is currently limited by the availability and cost of the RayFlow catheter.
Conclusions
The reproducibility of continuous thermodilution-derived measurements of Q, Rμ, CFR, and MRR is superior to similar measurements derived from bolus thermodilution. MRR derived from continuous thermodilution was shown to be highly reproducible for assessing the function of the microcirculation. Future prospective studies are warranted to address the clinical impact of these metrics.
Impact on daily practice
Accuracy and reproducibility are indispensable prerequisites for the clinical utility of any new metrics. Our findings illustrate that the reproducibility of continuous intracoronary thermodilution is higher than for bolus thermodilution, mainly because the former technique is operator independent.
Conflict of interest statement
G. Esposito is supported by a research grant from the CardioPaTh PhD Program. P. Paolisso is supported by a research grant from the CardioPaTh PhD Program. D. Bertolone is supported by a research grant from the CardioPaTh PhD Program. E. Barbato declares speaker fees from Abbott Vascular, Boston Scientific, and GE Healthcare. C. Collet reports receiving research grants from Biosensor, GE Healthcare, Medis Medical Imaging, Pie Medical Imaging, CathWorks, Boston Scientific, Siemens, HeartFlow, and Abbott Vascular; and consultancy fees from HeartFlow, OpSens, Pie Medical Imaging, Abbott Vascular, and Philips. B. De Bruyne has an institutional consulting relationship with Boston Scientific, Abbott Vascular, CathWorks, Siemens, GE Healthcare, and Coroventis Research; has received institutional research grants from Abbott Vascular, Coroventis Research, CathWorks, and Boston Scientific; and holds minor equities in Philips, Siemens, GE Healthcare, Edwards Lifesciences, HeartFlow, OpSens, and Celiad. The other authors have no conflicts of interest to declare.
Supplementary data
To read the full content of this article, please download the PDF.