Abstract
Aims: Assessment of the coronary circulation has been based largely on pressure ratios (epicardial) and resistance (micro-vessels). Simultaneous assessment of epicardial (CEPI) and microvascular conductance (CMICRO) provides an intuitive approach using the same units for both coronary domains and expressing the actual deliverability of blood. The aim of this study was to develop a novel integral method for assessing the functional severity of epicardial and microvascular disease.
Methods and results: We performed intracoronary pressure and Doppler flow velocity measurements in 403 vessels in 261 patients with stable coronary artery disease. Hyperaemic mid-to-late diastolic pressure and flow velocity (PV) relationships were calculated. The slope of the aortic PV indicates the overall conductance and the slope of the distal PV relationship represents CMICRO. The intercept with the x-axis represents zero-flow pressure (Pzf). CEPI was derived from microvascular and overall conductance. Median CEPI was higher compared to CMICRO (4.2 [2.1-8.0] versus 1.3 [1.0-1.7] cm/s/mmHg, p<0.001). CMICRO was independent of stenosis severity (1.3 [1.0-1.7] in FFR ≤0.80 versus 1.4 [1.0-1.8] in FFR >0.8, p=0.797). ROC curves (using FFR and HSR concordant vessels as standard) demonstrated an excellent ability of CEPI to characterise significant stenoses (AUC 0.93). When CEPI
Conclusions: A comprehensive assessment of separate CEPI and CMICRO was feasible. CEPI has a remarkable diagnostic efficiency to detect a clinically relevant stenosis. When CEPI
Abbreviations
AUC: area under the curve
CEPI: epicardial conductance
CFVR: coronary flow velocity reserve
CMICRO: microvascular conductance
COVERALL: overall conductance
FFR: fractional flow reserve
HMR: hyperaemic microvascular resistance
HSR: hyperaemic stenosis resistance
IHD: ischaemic heart disease
IHDVPS: instantaneous hyperaemic diastolic flow velocity-pressure slope
PCI: percutaneous coronary intervention
Pzf: zero-flow pressure
QCA: quantitative coronary angiography
ROC: receiver operating characteristic
%DS: percent diameter stenosis
Introduction
The current role of coronary physiology is to perform functional assessment of epicardial vessel disease to guide coronary revascularisation1. However, it is foreseeable that, in the near future, interrogation of the coronary microcirculation will also be routinely performed, as microvascular dysfunction is an acknowledged cause of cardiac events in ischaemic heart disease (IHD)2. Methods to assess both epicardial stenosis severity and microvascular disease are lacking. Fractional flow reserve (FFR) provides valuable information on the haemodynamic relevance of stenotic epicardial vessels but does not interrogate the microcirculation; coronary flow velocity reserve (CFVR) may be used to interrogate the microcirculation in the absence of epicardial stenoses3. At present, assessment of the microcirculation is based on the calculation of vascular resistance4-7. An alternative approach is the use of vascular diastolic conductance (the inverse of coronary resistance). Conductance assesses the coronary function in terms of its primary purpose, namely delivery of myocardial blood flow. A higher conductance expresses a greater myocardial blood supply. Theoretically, conductance can be calculated to estimate both epicardial and microcirculatory domains. Calculation of microcirculatory conductance (CMICRO) is feasible and reflects the degree of structural remodelling of arterioles and capillaries8. However, until now, a method to calculate separate epicardial conductance (CEPI) has been unavailable.
The main aim of this study was to develop a method for the separate assessment of CEPI and CMICRO to allow a comprehensive assessment of the coronary circulation in patients with IHD.
Methods
DATA SOURCE
We acquired pressure and Doppler flow velocity measurements from 308 patients with stable angina pectoris included in an ongoing large international registry (the Iberian-Dutch-English [IDEAL] registry) (Figure 1). Prospective patient data were obtained in four different centres - the VU University Medical Center, Amsterdam, the Netherlands (n=120), the Academic Medical Centre, Amsterdam, the Netherlands (n=92), Imperial College London, London, United Kingdom (n=72), and Hospital Clínico San Carlos, Madrid, Spain (n=24). A detailed description of the IDEAL registry was published previously9.
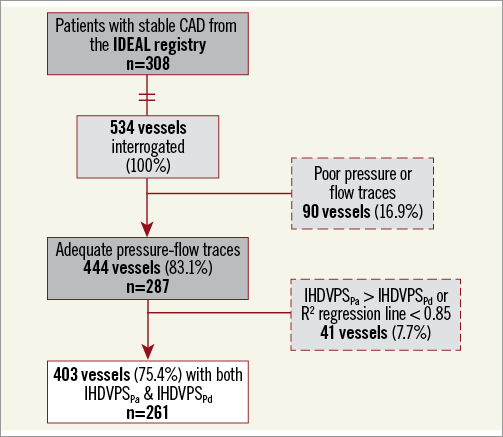
Figure 1. Study flow chart. CAD: coronary artery disease; IDEAL study: Iberian-Dutch-English study9; IHDVPSPa: Instantaneous Hyperaemic Diastolic Velocity Pressure Slope index calculated using aortic pressure; IHDVPSPd : Instantaneous Hyperaemic Diastolic Velocity Pressure Slope index calculated using distal pressure
CARDIAC CATHETERISATION AND HAEMODYNAMIC MEASUREMENTS
Pressure and Doppler flow velocity measurements were performed with the ComboWire® XT (Philips/Volcano, San Diego, CA, USA) in a standardised fashion9. Based on the fact that in the coronary vessels flow velocity is kept relatively constant due to proportionality between subtended myocardial mass and coronary luminal diameter, distal flow velocity was used as a surrogate for proximal flow velocity10,11. Hyperaemia was induced by the administration of adenosine (two-minute infusion with 140 µg/kg/min i.v. or a bolus 60-150 µg i.c.). Finally, the amount of potential drift was assessed. All measurements were directly extracted from the device console (ComboMap®; Philips/Volcano). Data were analysed with specialised software (MATLAB; MathWorks, Inc., Natick, MA, USA). Quantitative coronary angiography (QCA) was performed off-line to assess percent diameter stenosis (%DS) using an automated contour analysis system (CAAS II; Pie Medical, Maastricht, the Netherlands).
CALCULATION OF INTRACORONARY PHYSIOLOGY INDICES
Calculation of coronary physiology indices was performed off-line from digitised pressure and flow recordings12,13. Whenever the difference between aortic pressure (Pa) and distal pressure (Pd) at the level of the guiding catheter was >2 mmHg, it was assumed that this was the result of Pd drift, and all physiological indices using pressure were recalculated after correcting Pd14. FFR was calculated as the Pd/Pa ratio during maximal hyperaemia. We used the lowest stable value of FFR. Whole cycle hyperaemic stenosis resistance (HSR) was calculated as mean trans-stenotic pressure gradient (Pa-Pd) divided by mean flow velocity. Coronary flow velocity reserve (CFVR) was calculated as the ratio of mean hyperaemic and baseline flow velocity. Whole cycle hyperaemic microvascular resistance (HMR) was calculated as mean Pd divided by mean flow velocity.
CALCULATION OF INDICES OF CONDUCTANCE
Vascular conductance (Figure 2) was derived by means of instantaneous hyperaemic diastolic flow velocity-pressure slope (IHDVPS) using a dedicated automated analysis programme written using the R statistical programme (statistical software R version 3.0.2; R Foundation for Statistical Computing, Vienna, Austria, 2013). IHDVPS is defined as the slope (β-coefficient) of the relationship between hyperaemic intracoronary pressure and flow in mid to end diastole, which is displayed by a single regression line (y=a + βx) expressed in cm/s/mmHg (Figure 3)15. The diastolic period was recognised using the peak flow velocity. The R2 regression coefficient was used to evaluate the linearity of the relationship between diastolic hyperaemic pressure and flow (cut-off value of R2 of ≥0.85). Hyperaemic Pa was determined to calculate the overall conductance (COVERALL)15,16 and hyperaemic Pd to calculate CMICRO. Using an electric circuit analogy, the coronary circulation can be described as a resistive (R) model (Figure 2) in which:
![]()
Since conductance (C) is the inverse of resistance,
![]()
where C represents COVERALL, CEPI and CMICRO (Figure 2).
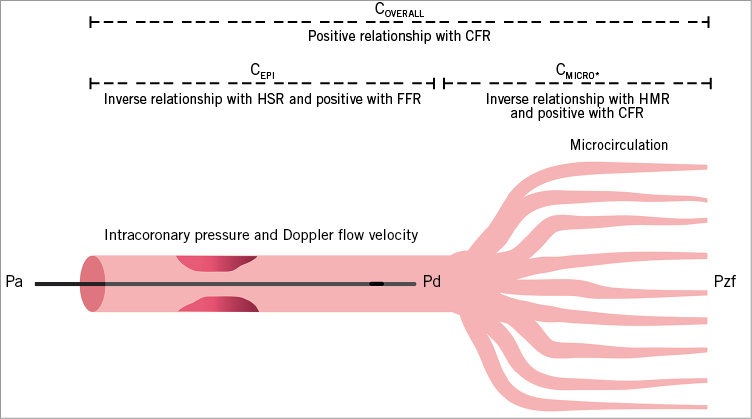
Figure 2. Overview of the indices of coronary conductance. Schematic depiction of the coronary circulation illustrating the different domains explored with vascular conductance and other haemodynamic indices mentioned in this study. CEPI: epicardial conductance; CFR: coronary flow reserve; CMICRO: microvascular conductance; COVERALL: overall conductance; FFR: fractional flow reserve; HMR: hyperaemic microvascular resistance; HSR: hyperaemic stenosis resistance; Pa: aortic pressure; Pd: distal pressure; Pzf: zero-flow pressure; * CMICRO independent of stenosis severity
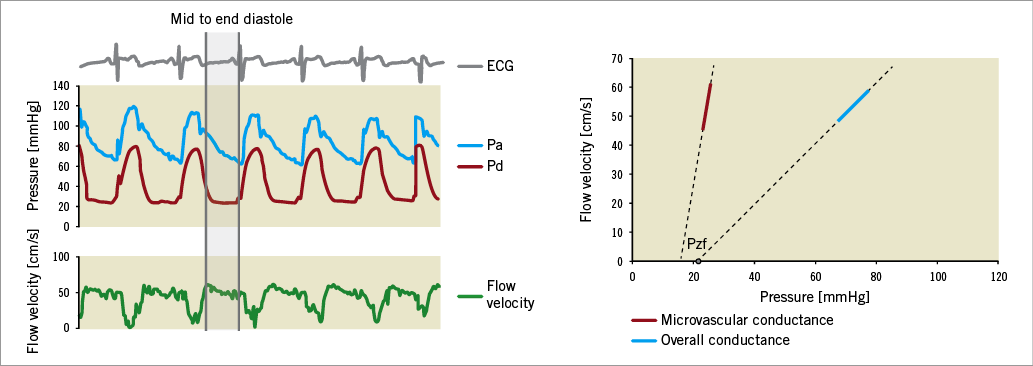
Figure 3. Acquisition and calculation of coronary conductance. The marked area is the mid to end-diastolic part for calculation of conductance. Doppler flow velocity and pressure are plotted during one cardiac beat and the linear relationship between pressure and flow in this period is displayed. The β-coefficient of this line represents overall (blue) and microvascular conductance (red) expressed in cm/s/mmHg. Pzf: zero-flow pressure
Further elaboration of this equation allows calculation of separate epicardial conductance:
![]()
From this CEPI can be readily calculated:
![]()
which is transformed for clarity purposes, multiplying numerator and denominator by −1, in order to obtain the final, equivalent, expression:
![]()
Actual values of epicardial conductance are obtained from IHDVPS as follows:
![]()
To validate CEPI, two clinically validated indices of stenosis severity were used, to obtain the optimal reference standard - FFR and HSR. Only vessels with a concordant value of both indices were used to create a valid cut-off value for CEPI . Zero-flow pressure (Pzf) was extrapolated from the regression line of the relationship between pressure and flow and is defined as the intercept of the regression line with the pressure axis.
STATISTICAL ANALYSIS
SPSS, Version 22.0 (IBM Corp., Armonk, NY, USA) was used for the statistical analysis of our data. Continuous variables were described as mean±SD or median (interquartile range [IQR]), depending on their normality, and categorical variables as frequency (percentage). Spearman’s correlation was used to examine the correlation between the different haemodynamic parameters. Associations between parameters measured on vessel level were assessed using generalised estimating equations with an exchangeable correlation matrix to account for correlation of the dependent variable determined for multiple vessels within the same patient. Differences in conductance between pairs of groups were assessed by an independent samples t-test or Mann-Whitney U test as appropriate. In case of multiple groups, ANOVA with post hoc Bonferroni or Kruskal-Wallis test was used accordingly. Receiver operating characteristic (ROC) curves with the method of DeLong for the calculation of the standard error of the area under the curve (AUC) and of the difference between two AUCs were used to compare the diagnostic efficiency of the indices. To calculate the optimal cut-off value, Youden’s index was used. A value of p<0.05 was considered statistically significant.
Results
PATIENT AND VESSEL CHARACTERISTICS
Figure 1 summarises the study population selection workflow. All values with IHDVPSPa>IHDVPSPd were excluded. The remaining 403 (75.4%) vessels in 261 patients constituted the study population.
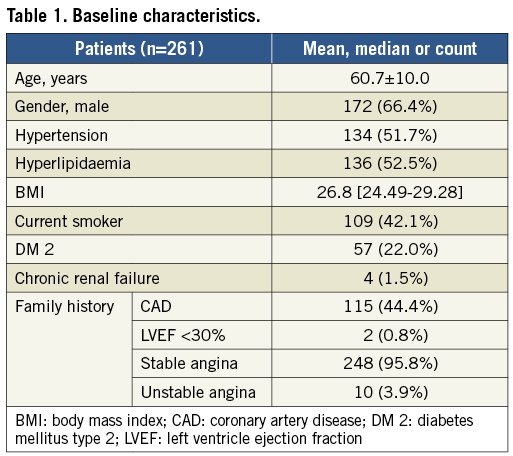
The patient population consisted mostly of men (64.6%) with an average age of 60.2±9.3 (Table 1). The left anterior descending artery (LAD) was the most frequently investigated vessel (n=171, 42.4%). Median FFR was 0.93 (0.84-0.97) in the overall population and was higher than reported in other series as a result of the inclusion of 202 vessels without severe angiographic lesions. The majority of vessels (n=335, 83.1%) had an FFR >0.80, while 66 (16.4%) had an FFR ≤0.8. Median FFR in the FFR ≤0.8 group was 0.67 (0.54-0.75). There were 52 (13.0%) vessels with FFR ≤0.75 and 39 (9.7%) with FFR ≤0.70. In two vessels FFR measurements were not possible. There were 202 (50.1%) vessels without angiographically focal intermediate stenoses (50-90%). %DS was assessed in 195 (48.4%) vessels with angiographically intermediate stenoses with a mean of 53.5±15.9.
MICROVASCULAR CONDUCTANCE
CMICRO in the overall population was 1.3 (1.0-1.7) cm/s/mmHg. CMICRO values were not influenced by the presence of epicardial disease (1.3 [1.0-1.7] in angiographically stenotic versus 1.3 [1.0-1.7] in non-stenotic vessels, p=0.932), nor influenced by stenosis severity (as judged by %DS ≥ or <50, respectively 1.3 [0.9-1.7] versus 1.3 [1.0-1.7], p=0.682). Similar values of mean CMICRO were observed in vessels with an FFR ≤ or >0.80 (respectively 1.3 [1.0-1.7] versus 1.4 [1.0-1.8], p=0.797) or ≤ or >0.70 (respectively 1.3 [1.0-1.7] versus 1.4 [1.0-1.8], p=0.697). In patients with abnormal CFVR (<2.0), COVERALL and CMICRO were significantly lower than in patients with preserved CFVR (≥2.0) (respectively 0.8 [0.6-1.1] versus 1.1 [0.8-1.4], p<0.001, and 1.2 [0.9-1.6] versus 1.3 [1.0-1.8], p=0.032). CMICRO was inversely correlated to HMR (ρ=-0.52, p<0.001).
EPICARDIAL CONDUCTANCE
CEPI was significantly higher than CMICRO with a median of 4.2 (2.1-8.0) cm/s/mmHg (p<0.001). CEPI was significantly lower in vessels with ≥50% DS, compared to vessels <50% DS (2.3 [1.2-4.7] versus 4.3 [1.9-8.5], p=0.001) and it was significantly lower in vessels with abnormal FFR (1.2 [0.7-2.5] versus 5.1 [2.8-9.2] in vessels below and above the FFR cut-off respectively, p<0.001). There was a positive correlation between CEPI and FFR (ρ=0.54, p<0.001) and a negative correlation between CEPI and HSR (ρ=-0.65, p<0.001). Vessels that were concordantly classified by FFR and HSR (280 [84%]) were used as the best possible reference population to establish the diagnostic efficiency of CEPI. ROC curves indicated an optimal cut-off value of 1.69 (AUC 0.93) to characterise a significant epicardial stenosis with a sensitivity of 82% and a specificity of 93%. CEPI demonstrated a higher AUC to determine a significant epicardial stenosis as compared to CFVR or overall conductance (Figure 4). The distribution of CEPI in classification quadrants that are outlined by FFR and HSR is shown in Supplementary Figure 1. The effect of epicardial disease (assessed by CEPI) on hyperaemic pressure, flow velocity (APV) and CMICRO is shown in Figure 5A. The median of the ratio between CEPI and CMICRO was 3.19 (1.54-6.27). The optimal cut-off-value of the CEPI/CMICRO ratio to identify ischaemia-generating stenoses was close to one (≤0.97) with a sensitivity of 67.5% and a specificity of 96.3% (AUC 0.90) (Figure 5B).
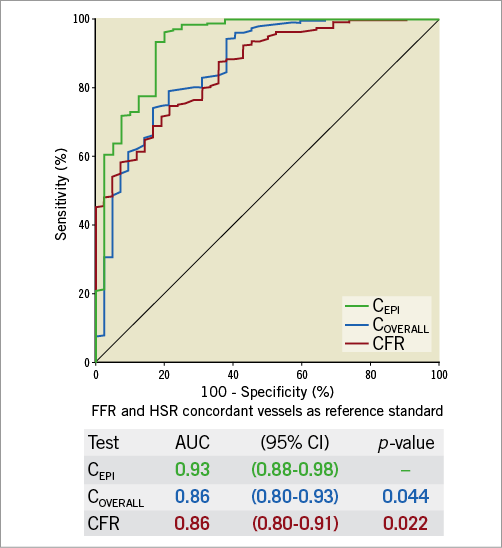
Figure 4. ROC curve of epicardial conductance against FFR and HSR. ROC curves of overall conductance and CFVR are similar and indicate combined microvascular and epicardial disease. There is significant improvement in area under the receiver operating curve of epicardial conductance, supporting its value in detecting clinically relevant obstructive disease. Vessels with concordant values of FFR (≤0.8) and HSR (≤0.8) are used to investigate the diagnostic efficiency of epicardial conductance. AUC: area under the curve; CEPI: epicardial conductance; CFR: coronary flow reserve; COVERALL: overall conductance; FFR: fractional flow reserve; HSR: hyperaemic stenosis resistance
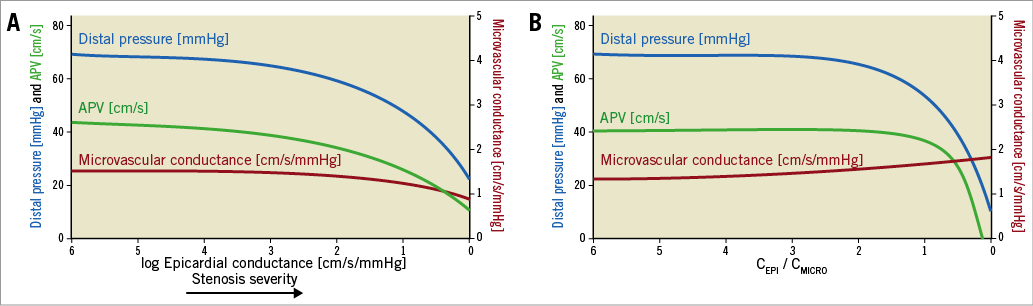
Figure 5. Effect of epicardial disease on distal pressure, coronary flow velocity and microvascular conductance. A) The panel indicates a marked decrease in intracoronary hyperaemic pressure and flow velocity around the values identified as the optimal cut-off value for epicardial conductance. Microvascular conductance is not affected until close to zero. B) The panel indicates a marked decrease in intracoronary hyperaemic pressure and flow velocity around the values identified as the optimal cut-off value (≤0.95) for the ratio between epicardial and microvascular conductance. This is when epicardial conductance becomes lower than microvascular conductance (ratio <1). APV: average peak velocity; CEPI: epicardial conductance; CMICRO: microvascular conductance
ZERO-FLOW PRESSURE
Supplementary Appendix 1 and Supplementary Figure 2 show zero-flow pressure results.
Discussion
In the present study, we demonstrated the feasibility of a combined haemodynamic assessment of the coronary circulation by performing a separate calculation of epicardial and micro diastolic vascular conductance. We found that: 1) CEPI has a great efficiency to detect a clinically relevant stenosis; 2) CMICRO is independent of stenosis severity, thus is a specific index of microvascular dysfunction; and 3) it is possible to obtain Pzf values by this technique. Using a comprehensive new method, it is possible to investigate simultaneously the status of the epicardial vessel and microcirculation separately, using the same units for both domains. In the next paragraphs, we discuss relevant aspects of this diagnostic approach.
CURRENTLY AVAILABLE METHODS TO ASSESS THE INTRACORONARY HAEMODYNAMICS OF THE CORONARY CIRCULATION
The current main role of coronary physiology in the catheterisation laboratory is to guide coronary revascularisation (primarily with FFR). A diagnosis of microvascular dysfunction is also desirable, as it has been demonstrated that it influences prognosis17. Therefore, an intracoronary diagnostic tool capable of providing information simultaneously on the presence of epicardial disease and microcirculatory dysfunction constitutes an unmet need in the assessment of IHD.
Assessment of the coronary microcirculation is performed predominantly with indices of vascular resistance (HMR and the index of microvascular resistance [IMR]), which are frequently influenced by the presence of epicardial stenosis. Consequently, current epicardial and microvascular indices are expressed in different units (a dimensionless pressure ratio and resistance units, respectively). Using conductance, it is possible to compare the amount of epicardial and microvascular disease (same units for both domains) to determine the predominant domain causing myocardial ischaemia.
CONDUCTANCE: AN INTEGRAL APPROACH TO ASSESS BOTH EPICARDIAL AND MICROVASCULAR DOMAINS
Conductance provides an estimate of the maximal delivery of myocardial blood. As the maximal delivery of myocardial blood happens mostly during diastole18, we limited the interrogation to the mid-late diastolic phase. By doing so, measurements were obtained in the absence of fluctuations in extravascular compression (during systole) and capacitance (early diastole)19. We were encouraged by previous research from our group demonstrating that assessment of CMICRO correlated well with documented structural remodelling of micro-vessels8.
The first challenge was to ascertain how separate calculation of CEPI could be obtained. This was solved by deriving a mathematical solution from the electric analogue of the coronary circulation. The second challenge was to validate these findings in the absence of a single reference standard for the severity of epicardial disease. As FFR alone is influenced by the status of the microcirculation and we aimed for a specific epicardial index as reference standard, we opted for its combination with an additional intracoronary index, HSR20, as the best approach in our data set to characterise clinically relevant epicardial disease.
EPICARDIAL CONDUCTANCE HAS A HIGH DIAGNOSTIC EFFICIENCY TO DETECT CLINICALLY RELEVANT EPICARDIAL DISEASE
As expected, we found a much higher conductance in the epicardial vessels (conductance vessels) without stenotic epicardial disease than in the microcirculation. Below the established cut-off value of CEPI, distal pressure and flow velocity steeply decrease. In other words, coronary disease becomes ischaemia-generating when CEPI becomes lower than CMICRO. Beyond that point, the microcirculation is no longer able to compensate for epicardial obstruction21. CEPI had a remarkable power to identify clinically relevant stenoses, as judged by the concordance of two validated clinical indices20,22.
MICROVASCULAR CONDUCTANCE IS INDEPENDENT OF STENOSIS SEVERITY
Mean values of CMICRO in our data set are similar to those in previously published studies8,23. We demonstrated that diastolic CMICRO is independent of epicardial stenosis severity, as opposed to whole-cycle based CFVR, IMR and HMR4-6,24. These prior studies, based on averaged whole-cycle pressure and flow velocity data, reported an increase in microcirculatory resistance in the presence of haemodynamically severe stenoses. More recent studies, which calculated microvascular indices from averaged mid and late diastole data, suggested that such a relationship results from the early diastolic or systolic phenomena25. Our results fit well with the previously published work carried out by our group indicating that CMICRO correlates better to structural microvascular changes compared to other microvascular indices8.
Limitations
While the quality of flow velocity tracings is key for the calculation of conductance, perfect Doppler signals are not always obtainable. In line with previous studies, coronary conductance could not be measured in around 25% due to suboptimal tracings23,26,27. Corrections of pressure drift were made assuming that it resulted from deviation of Pd values (i.e., was caused by the wire pressure sensor). A limitation of our study was that we did not measure proximal flow to calculate overall conductance, but instead we used the distal flow velocity. However, in the coronary vessels, flow velocity is kept constant due to proportionality between subtended myocardial mass and the coronary luminal diameter10. Of note, other indices such as HSR also use distal flow velocity to assess the severity of epicardial disease. Furthermore, we did not assess volumetric flow but rather Doppler flow velocity. However, flow velocity theoretically does not require correction for vessel diameter or subtended mass11,28,29. FFR and HSR were used as the optimal reference standard to validate CEPI in our study, but in future research the potential of coronary conductance should be tested against an independent reference standard (for myocardial flow) such as positron emission tomography. Finally, the acquisition of conductance was performed off-line in the absence of commercially available systems. Future developments in these dedicated software programs might obviate this limitation.
Conclusions
We now provide a new integral approach to assess the coronary circulation haemodynamically with separate assessment of epicardial and microvascular diastolic conductance. CEPI has a high diagnostic accuracy to detect a clinically relevant stenosis and CMICRO is a specific microvascular index independent of stenosis severity. The conductance ratio incorporates both the epicardial and microvascular domains and emerges as a promising index to detect patients with myocardial ischaemia, as demonstrated by a marked decrease in distal intracoronary pressure and flow velocity, which seems to be when CEPI becomes lower than CMICRO.
| Impact on daily practice Vascular conductance is a promising novel technique to assess the epicardial and microvascular domains separately. Further research may focus on the advantages (e.g., diastolic interrogation, simultaneous interrogation of epicardial and microvascular disease, both indices expressing the same units, the ratio between CEPI and CMICRO being used to determine myocardial ischaemia and Pzf perhaps informing on extravascular compression) that each of the indices of conductance may have in clinical practice. Most likely, the combined use of CEPI/CMICRO and CMICRO will suffice to ascertain whether epicardial disease is functionally relevant, while also indicating whether a structural microcirculatory problem exists. |
Conflict of interest statement
The authors have no conflicts of interest to declare.
Supplementary data
Supplementary Appendix 1. Calculation and distribution of zero-flow pressure.
Supplementary Figure 1. Distribution of epicardial conductance in vessels classified by stenosis severity indicated by FFR and HSR.
Supplementary Figure 2. Distribution of Pzf in vessels classified by stenosis severity indicated by FFR and HSR.
To read the full content of this article, please download the PDF.